Ionic hydration-induced evolution of decane–water interfacial tension†
Received
22nd March 2017
, Accepted 8th May 2017
First published on 8th May 2017
Abstract
Building a connection between the variations in interfacial tension and the microstructure of the oil–water interface is still very challenging. Here, we employ a molecular dynamics method to study the effect of monovalent ions on the decane–water interfacial tension and reveal the relationship between ionic hydration and the variation of interfacial tension. Our results indicate that interfacial tension presents a non-monotonic dependence on the ionic concentrations owing to the distinctive adsorption characteristics of ions. At low ionic concentrations, the hydration of the discrete ions at the interface causes an enhancement in the virial term of the interfacial tension, resulting in an increase of the interfacial tension with increasing ionic concentrations. At high ionic concentrations, the ion pairs at the interface weaken the ionic hydration, thus the virial term of the interfacial tension decreases and the interfacial tension decreases slightly. In addition, the kinetic energy term of interfacial tension increases only with increasing temperature, while the virial term decreases with an increase in either temperature or pressure on account of the weakening ionic hydration; therefore, the increase of temperature and pressure induces different degrees of the decrease in the interfacial tension owing to the major contribution of the virial term, particularly at high ionic concentrations.
Introduction
The oil–water interface is a ubiquitous system which plays an important role in many industrial processes, such as extraction separation,1 protein self-assembly,2 nanoparticle assembly,3 enhanced oil recovery,4etc. As an essential and crucial interfacial characteristic, interfacial tension (IFT) can significantly affect the deformation of the interface and mass transfer and accordingly has a substantial effect on the industrial processes involving the oil–water interface. For example, a decrease of the dynamic interfacial tension with aging time provides signatures for protein clustering and crowding processes at the oil–water interface.5 Because of the micro-nano scale feature of the pore-throat channels in the petroleum reservoir, IFT is crucial to understand the oil–gas–water multiphase flow dynamics in porous media,6 including the detachment of adhered oil from rock surfaces, the displacement of trapped oil and the crude oil emulsion stability, and so on.
In general, the multiphase fluid in industrial processes contains many components, such as gases, ions, surfactants, nanoparticles, and asphaltene.7–11 The adsorption of these components at the interface results in distinctive mechanical properties of the oil–water interface like ultra-low IFT12 and viscoelasticity.13 Among them, ions are commonly seen but have considerable effects on the interfacial properties. Because of their inherent charge properties, ions can strongly attract the surrounding water molecules which have a large dipole moment, forming hydration structures, and then affect the molecular arrangement near the interface. Ions can be divided into kosmotropes and chaotropes14 which have an opposite affinity for the interface. Besides, ions have a strong interaction with molecules coupled with charged groups (such as ionic surfactants and asphaltene), changing the diffusion behavior and interfacial molecular packing of these species,15–18 which would lead to special interfacial mechanics.
The ions at or near the interface can change the electric field and the molecular packing, thus altering interfacial charge, IFT, interfacial rheology and other properties. By using Monte Carlo simulations, Guerrero-García et al.19 proposed an enhanced description of the electric field near the oil–water interface and found a reverse of the electric field at the interface caused by the size-asymmetric monovalent ions. Moradi et al.20 revealed that higher ionic strength contributes to a higher partitioning rate of the naphthenic acids by using the high-field NMR spectroscopy. Moeini et al.21 studied the effects of salinity, temperature and pressure on the heavy crude oil/brine interfacial tension using the pendent drop method and reported a critical salt concentration at which IFT reaches the minimum. It has also been found that the migration of the ions near the interface has significant influences on the diffusion and arrangement of the active species at the interface, and thereby changes the interfacial properties. Zwanikken et al.22 concluded that ions near the interface can deform the double layers of the oil-colloids and affect the colloidal density distribution at the interface by means of modified Poisson–Boltzmann theory. Leunissen et al.23 experimentally studied the ion partitioning at the oil–water interface in emulsions with colloids. Khanamiri et al.24 demonstrated that Ca2+ is conductive to lower IFT and changes the oil–water interfacial elastic modulus.
Some technologies have been proposed to investigate the oil–water interface, such as surface second harmonic generation,25 small-angle neutron scattering26 and vibrational sum-frequency spectroscopy,27 but the dynamics of ions or molecules near the interface are not fully addressed. The molecular dynamics (MD) method which can be used to obtain the detailed microscopic structures is a powerful tool to investigate the macroscopic properties of the oil–water interface with the applicability of the statistical mechanics. Some researchers have adopted MD simulations to explore the effects of ions on the interfacial structure, mechanics and mass-transfer characteristics.28–34 For instance, Zhang et al.35 investigated the effects of salt on the oil–water interface. The salt ions can modify the orientation of water molecules in the interfacial region and lead to an increase in IFT. Jian et al.36 demonstrated the effects of salinity and temperature on the water/toluene interfacial tension in the presence of asphaltenes by combining MD simulations with the pendant drop method. They found that an increase in salinity causes an increment in IFT while higher temperature lowers IFT. Kikkawa et al.37 pointed out that the formation/breaking of the water finger is the microscopic barrier for ion transport through the oil–water interface via the MD simulations coupled with the 2D free energy calculations. The above-mentioned works preliminarily reveal the dynamic behavior of ions near the interface and their basic influences on the microstructure and the interfacial mechanics.
However, a connection between the variations in oil–water interfacial tension and the interfacial microstructure, particularly the hydration of ions at the interface, has not been well built. Considering that an analysis of the oil–water interfacial characteristics from a physical point of view is crucial to understand the effects of environmental conditions, our present work focuses on the effects of ions on the oil–water interfacial tension under the action of ionic hydration and reveals the variations in IFT from the physical viewpoint by using MD simulations. We show that IFT evolves non-monotonously with increasing ionic concentrations owing to the distinctive ionic hydration at different concentrations. Further, we discuss the variations in IFT at different temperatures and pressures by considering the relative contributions of the virial term and the kinetic energy term.
Models and methods
MD system
We perform the MD simulations to study the effects of ions on the oil–water interface. The MD system, molecular structures and potential parameters of ions are shown in Fig. 1. The simulation box with a volume equal to Lx × Ly × Lz = 4 × 4 × 11.4 nm3 is made up of two layers of the oil and water phase. The thickness of oil and water layers is large enough to eliminate the interaction between their interfaces. Periodic boundary conditions are utilized in the x-, y- and z-directions. Decane is adopted as the oil phase according to the “equivalent alkane carbon number” value of crude oil.38 Na+ and Cl− ions, which are the basic components of brine and reservoir fluids, are uniformly dissolved in the water phase. The potential parameters of sodium and chloride ions in the simulations are proven to be effective and the simulation results based on these parameters are consistent with the experimental or theoretical results.39,40 The atomic interactions between the decane molecules are described by the OPLS-AA potential41 while the TIP3P water model is adopted (see the ESI,† Section 1.1). We use the Lorentz–Berthelot rule to obtain the potential parameters between the crossing atoms. The cut-off radius of all potentials is 10 Å.
 |
| | Fig. 1 Simulation system and potential parameters of ions. (a) Simulation region. (b) Structures of water, decane and sodium/chloride ions. (c) Potential parameters of ions. | |
The MD simulations are performed using the LAMMPS package42 in the NPT ensemble. We employ the Nose–Hoover barostat and a thermostat to maintain pressure and temperature (see the ESI,† Section 1.2). Different temperatures and pressures are applied to the decane–water system with different ionic concentrations (see Table 1). Given the strong electrostatic interactions between ions and water molecules, we adopt the Particle–Particle Particle–Mesh (PPPM) method to calculate the long-range Coulombic interactions which cannot be neglected (see the ESI,† Section 1.2). Before running the simulations, an energy minimization of the system is done by the steepest descent algorithm to adjust the atom coordinates for avoiding the overlap of atoms. The total simulation time for all the systems with different conditions is 20 ns with a time step of 1 fs.
Table 1 Simulation conditions. For each concentration, a serial of cases under different temperature and pressure conditions are simulated
| Temperature (K) |
300 |
|
|
320 |
|
|
340 |
|
|
| Pressure (atm) |
1 |
20 |
40 |
1 |
20 |
40 |
1 |
20 |
40 |
| Ion concentration (mol L−1) |
0, 0.3, 0.6, 0.9, 1.2, 1.5 |
Calculation of interfacial tension
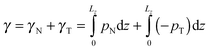
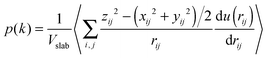
The IFT of the decane–water system is calculated by using the Kirkwood–Buff equation,43| |  | (1) |
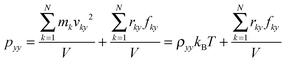
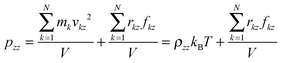
where Lz is the length of the system along the z-direction and p is the local pressure tensor. For a planar interface perpendicular to the z-direction, the pressure tensor p is only a function of z and can be expressed by pN and pT as follows:where pN is the normal component and pT is the tangential component:| | | pN = pzz, pT = ½(pxx + pyy). | (3) |
| |  | (4) |
| |  | (5) |
| |  | (6) |
where k is the number of atoms, v the velocity of atom, N the total number of atoms, m the mass, r the displacement of atoms, f the force applied on atoms, V the volume of the system and x, y, z are the directions.
Therefore, the interfacial tension γ is comprised of two parts, γN and γT, which are, respectively, contributed by pN and pT, as follows.
| |  | (7) |
According to
ref. 44, only the region near the interface contributes to the above integral; hence we calculate the integral value of the region between the positions where
p is almost equal to 0, which is slightly larger than the interfacial thickness.
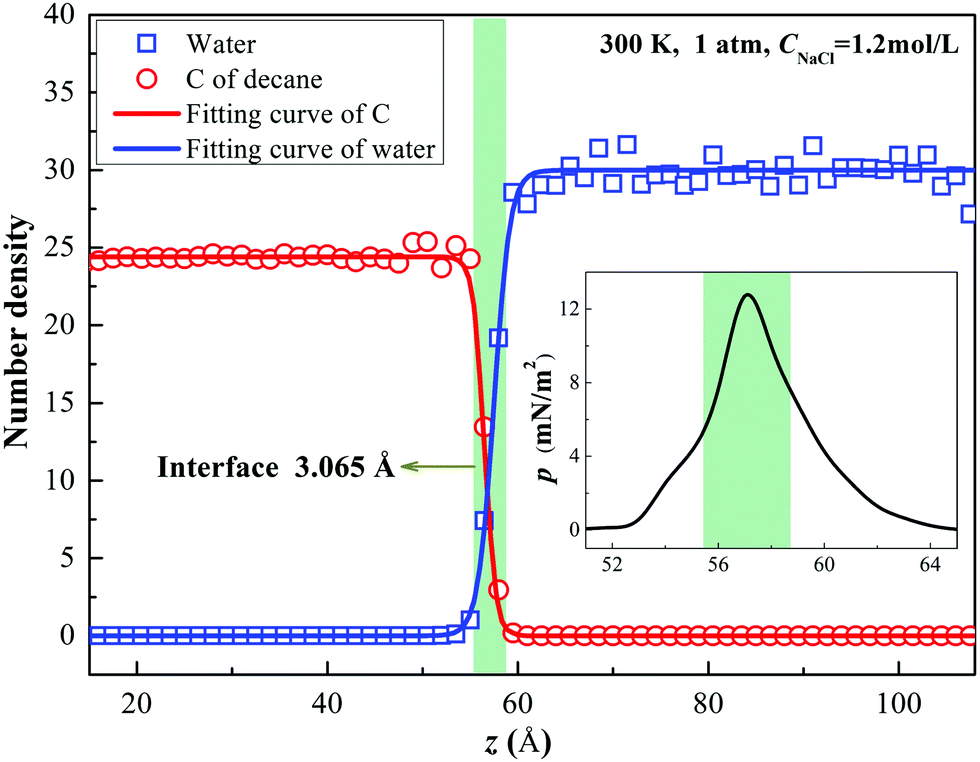
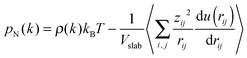
In order to calculate the IFT, we firstly obtain the number density fitting curves of water and decane along the z-direction using the hyperbolic tangent function employed for liquid–vapor interfaces (see Fig. 2). Based on the fitting curves, we can further achieve the interfacial thickness according to the “90–10” criterion (see the ESI,† Section 1.3).45 Similarly, we obtain the interfacial thickness of the decane–water system with different ionic concentrations (see Fig. S2, ESI†). It is obvious that the existence of ions causes a decrease in the interfacial thickness. Next, we split the simulation box into NS slabs along the z-direction. The thickness of each slab is equal to Lz/NS = 0.2 Å. Then, based on eqn (4)–(6), we can calculate pN and pT in each slab k (k = 1,…,NS). pN(k) and pT(k) are expressed as:
| |  | (8) |
| |  | (9) |
where
ρ(
k) is the atom density in slab
k,
Vslab =
LxLyLz/
NS the volume of a slab,
u(
rij) the full inter-atomic potential,
xij,
yij,
zij and
rij the inter-atomic distances and the summation ∑
(i,j) means all pairs of atoms in each slab. Because the interface in the simulations is planar and has cylindrical symmetry, the pressure tensor is only a function of
z. Based on the Kirkwood–Buff equation, the local pressure tensor
p(
k) is equal to the difference between the local normal and tangential pressures
pN(
k) and
pT(
k):
| |  | (10) |
 |
| | Fig. 2 Number density distributions of water and carbon in decane along the z-direction and their fitting curves. (The light-green shadow represents the interfacial region; the inset map shows the distribution of the pressure tensor p across the interface.) | |
After obtaining the local pressure tensor, we can achieve the variation curve of pressure along the z-direction across the interface, as shown in the inset of Fig. 2.
Further, we make a validation of our simulation model. The density of the decane or water bulk phase in our simulations is consistent with the actual density. In addition, compared to the experimental and simulation values in previous studies,46–49 our simulation values of IFT for the decane–water systems under different temperature or pressure conditions are acceptable (see the ESI,† Section 1.4).
Results and discussion
Interfacial tension
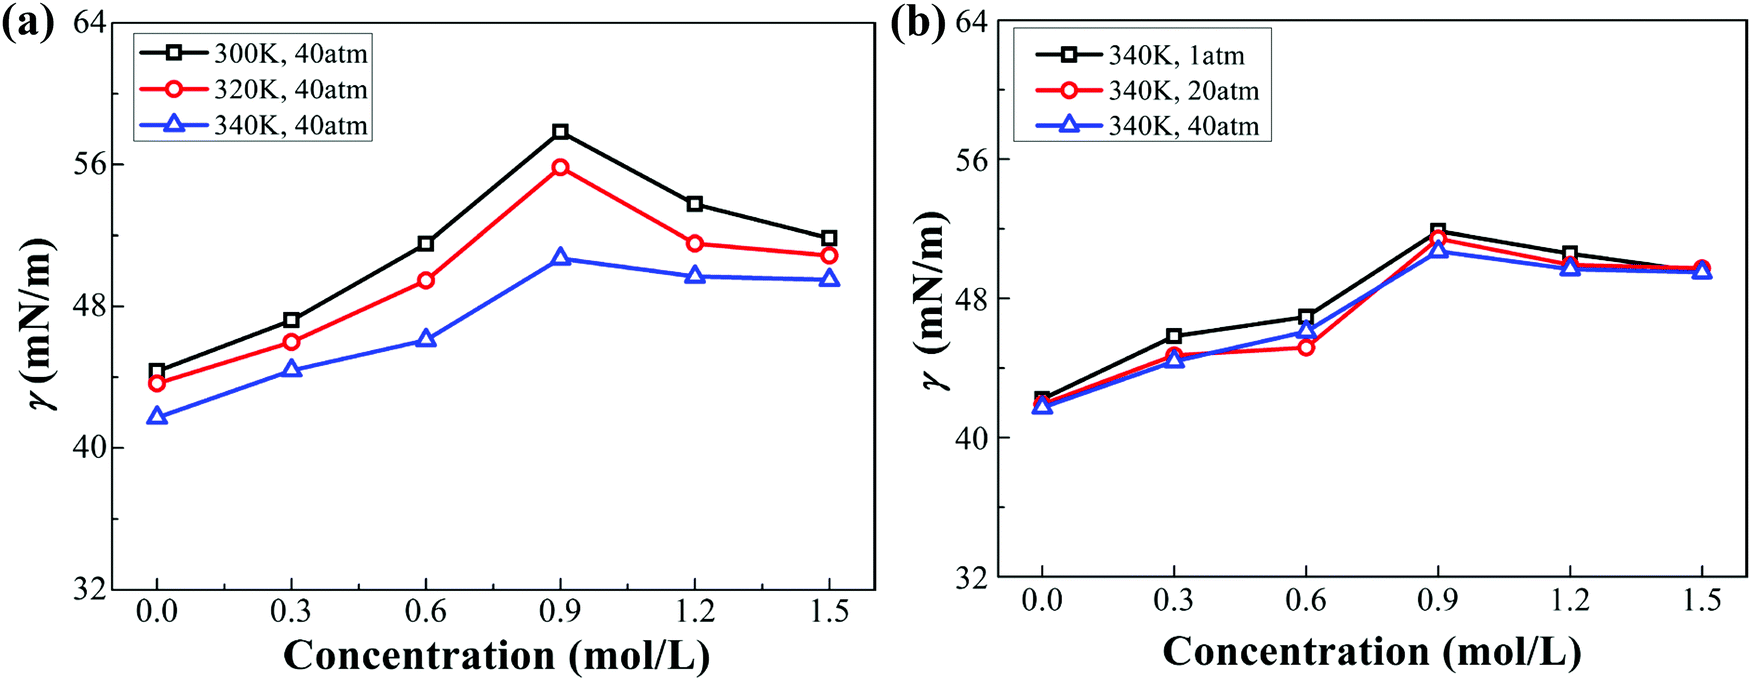
As stated in Section 2.2 of the ESI,† the chloride ions have a stronger affinity for the interface than the sodium ions on account of their weaker hydration. The IFT of the decane–water system with different ionic concentrations under different conditions (pressure or temperature) is calculated (see Fig. 3). Sodium chloride causes an increase in IFT. Note that IFT increases firstly and then decreases slightly with increasing ionic concentrations. This specific non-monotonic trend differs from those reported in ref. 21 and 50–52. Meanwhile, considering the physical conditions of oil reservoirs, higher temperature and pressure are employed to study their effects on IFT. For example, the temperature and pressure for a stratum depth of one thousand meters are about 340 K and 40 atm, respectively. According to Fig. 3, the IFT of the decane–water system decreases as temperature or pressure increases. Compared to pressure, temperature has a more significant influence on IFT. This trend is consistent with the results reported in ref. 43–45. We further analyze the variation of IFT in terms of the interfacial microstructure to explain these phenomena.
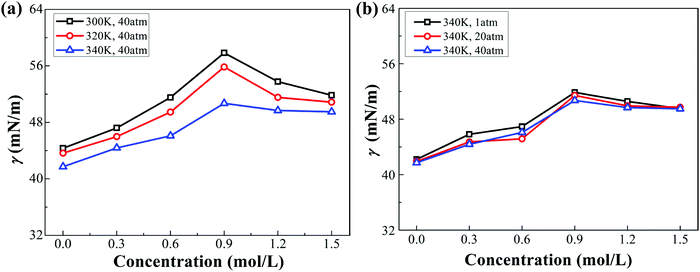 |
| | Fig. 3 IFT of the decane–water system with different ionic concentrations under different conditions. (a) IFT of the decane–water system at different temperatures. (b) IFT of the decane–water system under different pressure. | |
Hydration of ions
Owing to their electric charge, ions have strong electrostatic attraction towards water molecules and accordingly form solvation structures, which can break the tetrahedral hydrogen bonding network in the water bulk phase and affect the arrangement of vicinal water molecules. Former researchers have studied the ionic hydration and concluded the Hofmeister Series53–55 which classifies ions in the order of their solubility of nonpolar or polar molecules (“salting out” or “salting in” effect). IFT is closely related to the number and arrangement of the molecules near or at the interface. Therefore, we firstly study the effect of ions on the microstructure of the decane–water interface.
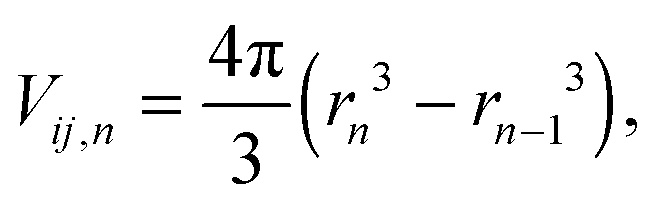
Radial distribution function (RDF) g(r) shows the variation of density near the specific particles and is often employed to describe the local microstructure of fluids, given by
| |  | (11) |
| |  | (12) |
where
i is the central atom,
j the atom around the central atom,
n the thin layer which is far away from the central atom with a distance of
r, Δ
Nij,n the atom number in the
n layer,
ρj the average number density of the
j atom and the thickness of the layer is equal to (
rn −
rn−1). As the distance increases toward infinity,
g(
r) tends to be one, which means that the number density of the
j atom is homogeneous and equal to the average number density. Here, we try to reveal the effects of ions on the interfacial microstructure; thus we focus on
g(
r) of Na–O and Cl–O which reflects how the density of water molecules changes as a function of distance from sodium or chloride ions at the interface.
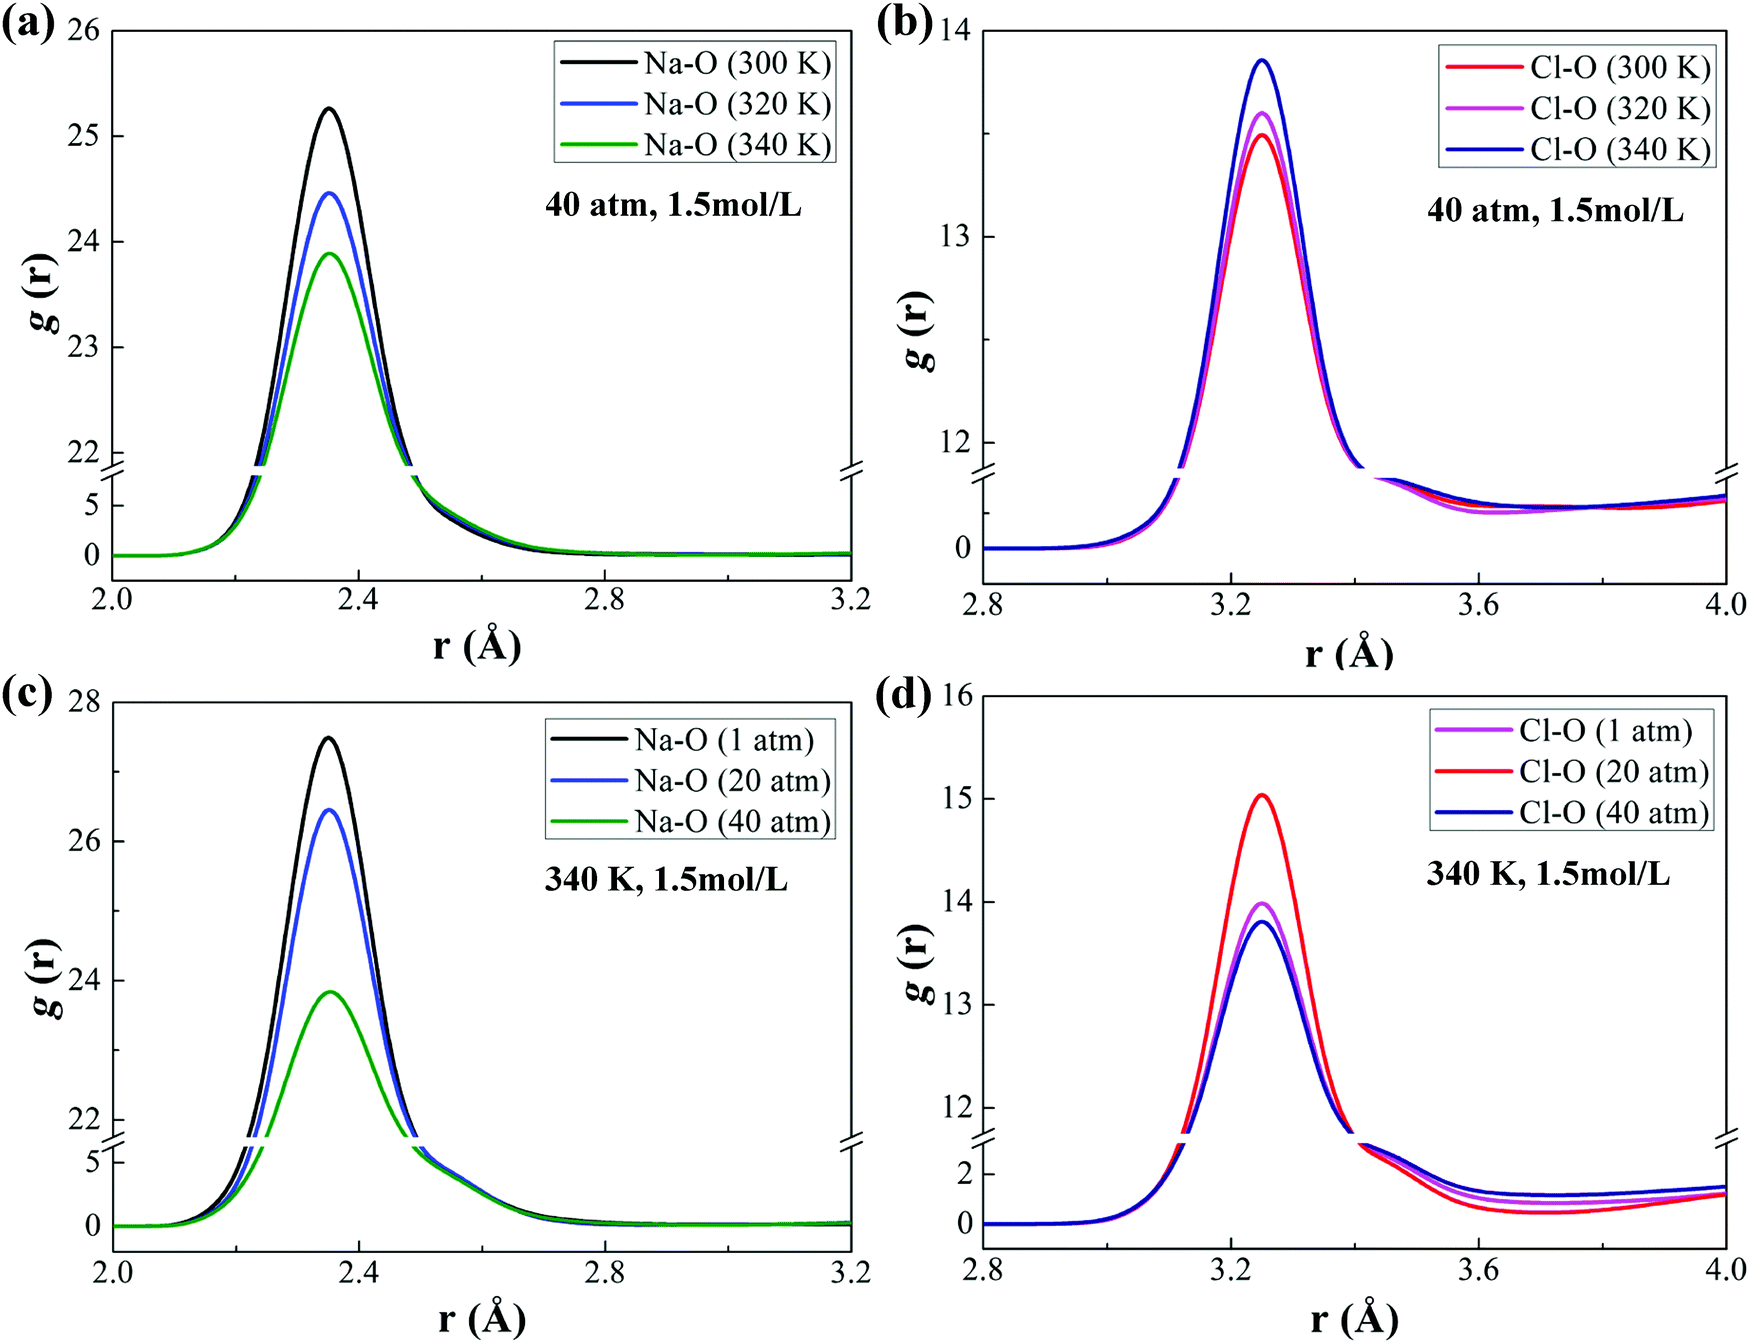
Fig. 4(a) shows g(r) of O–O, Na–O and Cl–O in the water bulk phase and interface. The peaks of g(r) at the interface are smaller than those in the bulk phase because of the fewer water molecules near the decane phase. The peaks of gNa–O(r) and gCl–O(r) are larger than those of gO–O(r), which indicates the aggregation of water molecules near the ions. The larger peak of gNa–O(r) stands for the stronger hydration of sodium ions. Owing to its strong hydration, a second peak of gNa–O(r) appears. The position where g(r) reaches its peak is dependent on the radius of ionic hydration. Furthermore, we analyze the effects of ionic concentrations on the peak of gNa–O(r) and gCl–O(r) at the interface (see Fig. 4(b) and (c)). While the peak of gCl–O(r) decreases with increasing ionic concentrations, the peak of gNa–O(r) increases firstly and then decreases.
 |
| | Fig. 4 RDF and the number of hydrogen bond at the interface with different ionic concentrations under 300 K, 1 atm conditions. (a) g(r) of O–O, Na–O and Cl–O in the water phase and interface. (b) gNa–O(r) at the interface with different ionic concentrations. (c) gCl–O(r) at the interface with different ionic concentrations. (d) Number of hydrogen bond versus ionic concentration (the inset map of (b) and (c) shows the peak of RDF versus ionic concentration; the inset map of (d) illustrates how the ionic hydration structures change at the interface with increasing ionic concentration.) | |
Importantly, we explain the evolution of interfacial tension versus ionic concentrations in terms of adsorption ability and ionic hydration, as shown in the inset schematic map of Fig. 4(d). At low ionic concentrations, the number of ions at the interface is small and the majority of them are chloride ions. The distance between the chloride ions at the interface is large and the ionic hydration interacts to a small extent. As a result, the strong attraction of the chloride ions towards the water molecules at the interface causes an increase in IFT. As ionic concentrations increase, the number of the chloride ions at the interface increases; thus the interaction between the ionic hydration structures enhances gradually, causing a decrease in the peak of gCl–O(r). While some sodium ions gradually occur at the interface, the peak of gNa–O(r) increases. Overall, the attraction of ions towards water molecules at the interface increases sequentially; therefore, IFT goes up gradually. At high ionic concentrations (>0.9 mol L−1), the number of ions at the interface is large and the distance between the ions at the interface is reduced accordingly; hence the interaction between ionic hydration is strong, leading to a decrease in the peak of gNa–O(r) and gCl–O(r). Some sodium and chloride ions are even bound in the form of ion-pairs (see ESI,† Section 3.1 and 3.2). Therefore, the attraction of ions towards water molecules at the interface weakens and IFT instead decreases slightly. In addition, the ionic hydration has influences on the hydrogen bond at the interface, as shown in Fig. 4(d). With increasing ionic concentrations, the number of hydrogen bonds at the interface increases firstly and then decreases, which is similar to the variation of IFT.
Note that we calculate gNa–O(r) and gCl–O(r) at the interface with an ionic concentration of 1.5 mol L−1 under different temperature and pressure conditions (see Fig. 5). The peaks of gNa–O(r) and gCl–O(r) decrease with increasing temperature or pressure. It means that ionic hydration at the interface weakens with the increase of temperature or pressure. The increase of temperature results in severe thermal motion of molecules or ions at the interface. The interaction between ions is more frequent and the water molecules are squeezed out from the ionic hydration; therefore, the attraction of ions towards water molecules at the interface weakens. As a result, IFT decreases, as shown in Fig. 3(a). The higher pressure leads to a smaller interfacial area. Accordingly, the distance between ions at the interface is reduced and the interaction between ions at the interface becomes stronger, causing more water molecules excluded from the ionic hydration. The attraction of ions towards water molecules at the interface weakens and IFT decreases consequently. However, due to the weak compressibility of liquid, this decreasing degree is smaller than that induced by the rising temperature, which will be discussed in detail in the next section.
 |
| | Fig. 5 RDF of Na–O and Cl–O at the interface under different temperature and pressure conditions. (a) gNa–O(r) at different temperatures (P = 40 atm, CNaCl = 1.5 mol L−1.) (b) gCl–O(r) at different temperatures (P = 40 atm, CNaCl = 1.5 mol L−1). (c) gNa–O(r) at different pressures (T = 300 K, CNaCl = 1.5 mol L−1). (d) gCl–O(r) at different pressures (T = 300 K, CNaCl = 1.5 mol L−1). | |
Physical analysis of interfacial tension
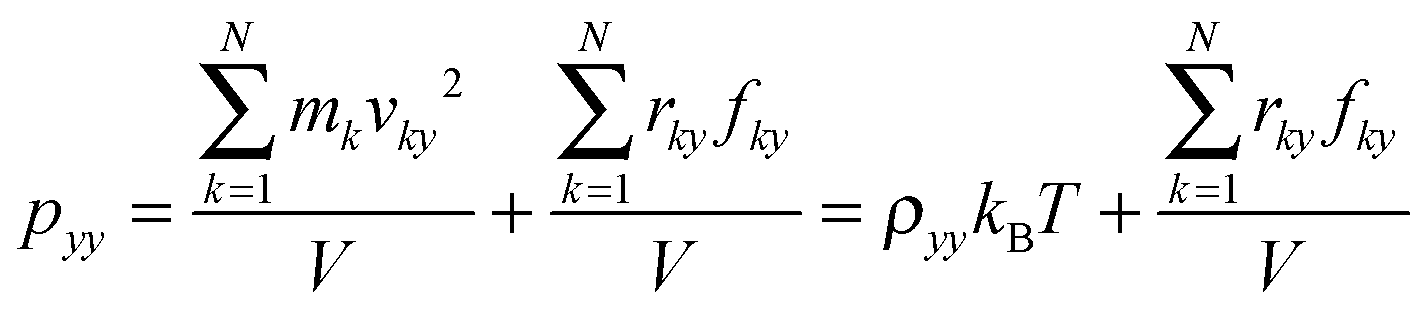
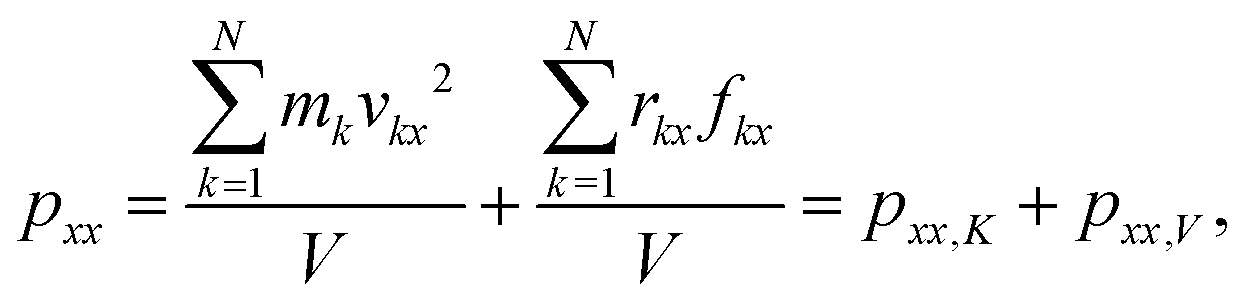
According to the physical definition of the pressure tensor p, its three components, i.e. pxx, pyy and pzz, can be, respectively, decomposed into two terms. Take pxx for example.| |  | (13) |
where k is the number of atoms, N the total number of atoms, m the mass, r the displacement of atoms, f the force applied on atoms, V the volume of the system and x is the direction. pxx includes a kinetic energy term and a virial term. For simplicity, we use pxx,K and pxx,V to represent the two terms.
Similarly, pyy and pzz can be expressed by a kinetic energy term and a virial term. Thus, p can be rewritten as
| | | p = pzz − ½(pxx + pyy) = [pzz,K − ½(pxx,K + pyy,K)] + [pzz,V − ½(pxx,V + pyy,V)] = pK + pV | (14) |
Therefore, the interfacial tension
γ is reduced to
| |  | (15) |
The interfacial tension
γ is made up of two parts,
γK and
γV, which are, respectively, integrated by
pK and
pV. The
pK term is determined by the motion of atoms, while the
pV term is the indicator of the atomic interactions which are contributed by the sum of the pair, bond, angle, dihedral, long-range interactions as well as the fixed constraint. Thus,
γK is directly related to the thermal motion of molecules while
γV is closely concerned with the intermolecular interactions at the interface.
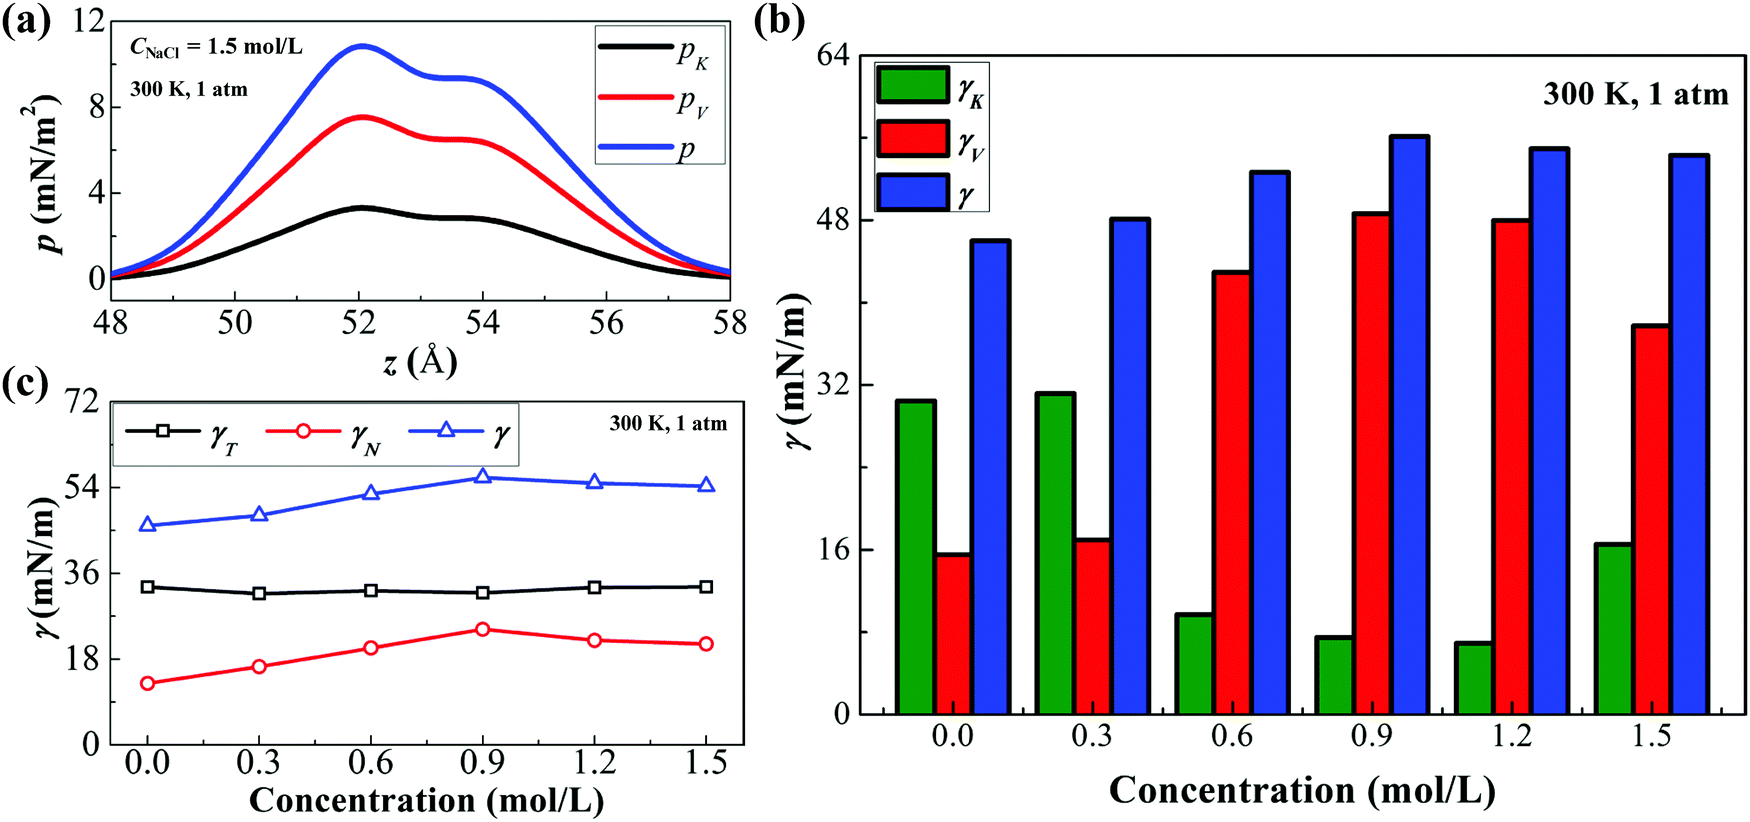
Based on the above equations, we can calculate the two components of IFT. Fig. 6(a) displays the variation of the pressure tensor and its two components (pK and pV) along the z-direction near the interface under the condition of 300 K and 1 atm. After integrating eqn (9), we can obtain IFT and its two components (see Fig. 6(b)). As the ionic concentration increases, γK decreases sharply while γV increases, indicating that γV plays a dominant role in the increase of IFT with a high ionic concentration. This trend is directly related to the ionic hydration at the interface. With increasing ionic concentrations, more ions occur at the interface, enhancing the electrostatic interaction and the van der Waals forces between water molecules and ions; thus γV increases sharply. On the other hand, more ions at the interface indicate that more water molecules are confined by the hydrated structure of ions and the total kinetic energy of molecules at the interface accordingly decreases; therefore, γK decreases. At a high ionic concentration (>0.9 mol L−1), because of the strong interaction of ionic hydration, water molecules are squeezed out from the ionic hydration and some ions are even paired (see the ESI,† Sections 3.1 and 3.2). Consequently, γV decreases slightly while γK increases.
 |
| | Fig. 6 Analysis of the decane–water interfacial tension with different ionic concentrations. (a) The distributions of pressure tensors p, pK and pV along the z-direction near the interface. (b) γ, γK and γV of the decane–water system with different ionic concentrations. (c) γ, γN and γT of the decane–water system with different ionic concentrations. | |
Further, we analyze the normal and tangential components of IFT (γNvs. γT) at different ionic concentrations (Fig. 6(c)). The variation of IFT is dominated by the normal component while the tangential component is nearly invariable. The ionic hydration at the interface causes a strong attraction towards the water molecules along the z-direction while the attraction of cations and anions on the water molecules along the tangential directions counteracts each other. Although the normal component of IFT increases with increasing ionic concentrations, it is still smaller than the tangential component of IFT. The tangential component γT plays a more important role in IFT.
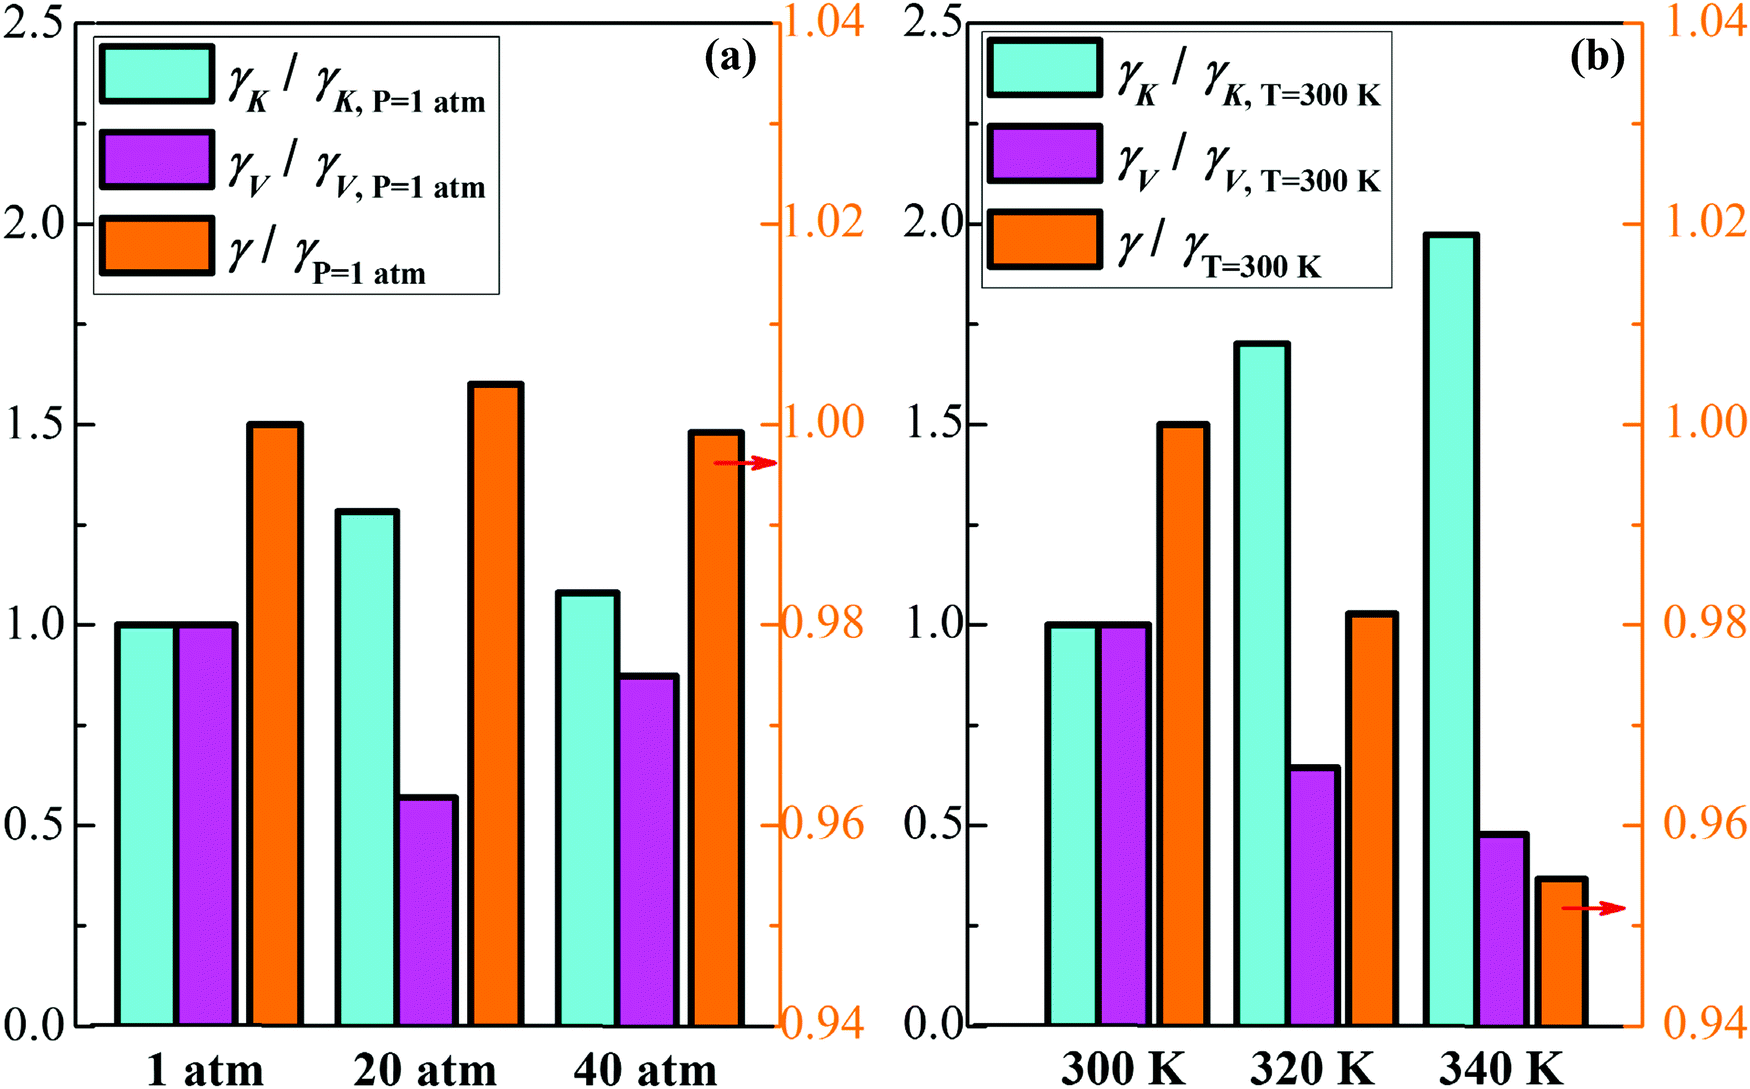
Fig. 7 shows the relative value of the decane–water interfacial tension with an ionic concentration of 1.5 mol L−1 under different pressure and temperature conditions (compared to the condition of 1 atm or 300 K). With increasing pressure, IFT has no significant change, as shown in Fig. 7(a). At high pressure, the reduction of the interfacial area causes a smaller distance between ions and the enhanced collision between molecules at the interface; therefore, γV decreases slightly and γK increases to a small degree. However, as temperature increases, γK increases owing to the enhanced thermal motion of molecules at the interface, while γV decreases because of the weaker ionic hydration at the interface. Although the increasing degree of γK is greater than the decreasing extent of γV, the component γV occupies a greater proportion of IFT (as shown in Fig. 6(b)), IFT thereby goes down. Based on the above analysis, we can conclude that compared to temperature and pressure, the ionic concentration is a more significant parameter which we can adjust to modulate IFT of the oil–water interface in many industrial processes.
 |
| | Fig. 7 Analysis of the decane–water interfacial tension with 1.5 mol L−1 NaCl under different conditions. (a) Relative value of γ, γK and γV under different pressure (compared to the case under 1 atm). (b) Relative value of γ, γK and γV at different temperatures (compared to the case at 300 K). | |
Conclusions
We study the effects of monovalent ions on the decane–water interfacial tension by using MD simulations and build a correlation between the ionic hydration and the variation of IFT. We find that IFT shows a non-monotonic variation trend with increasing ionic concentrations. The virial term which is primarily contributed by the ionic hydration plays a dominant role in the variation of IFT. At low ionic concentrations, owing to the ionic hydration at the interface, the interactions among molecules and ions increase significantly with increasing ionic concentrations; therefore, the virial term increases and accordingly IFT increases. At high ionic concentrations, the ionic hydration at the interface interacts strongly and ion pairs appear, causing the weakening of ionic hydration; thus, the virial term and IFT go down slightly with increasing ionic concentrations. With the increase of temperature, the kinetic energy term increases for the enhanced mobility of molecules while the virial term decreases resulting from the weakening ionic hydration at the interface, and accordingly IFT decreases obviously on account of the major contribution of the virial term. With increasing pressure, the virial term decreases because of the exclusion of water molecules at strong interactions among ions while the kinetic energy term remains constant; accordingly IFT decreases slightly. We hope that our research results can be helpful to provide physical guidance for modulating IFT by ions to achieve the control and optimization of industrial processes involving the oil–water interface, such as the salt water flooding, liquid–liquid extraction, protein assembly and so on.
Acknowledgements
This work was supported by the National Natural Science Foundation of China for Distinguished Young Scientists (51425603) and project No. 51506166. Oleg A. Kabov and Elizaveta Ya. Gatapova acknowledge financial support from Ministry of Education and Science of the Russian Federation (Agreement 14.613.21.0038, project identifier RFMEFI61315X0038). We also acknowledge the support of Special Program for Applied Research on Super Computation of the NSFC-Guangdong Joint Fund (the second phase).
References
- E. W. E. Scoppola, G. Li Destri, L. Porcar, R. A. Campbell, O. Konovalov, G. Fragneto and O. Diat, Phys. Chem. Chem. Phys., 2015, 17, 15093–15097 RSC.
- K. M. Bromley, R. J. Morris, L. Hobley, G. Brandani, R. M. Gillespie, M. McCluskey, U. Zachariae, D. Marenduzzo, N. R. Stanley-Wall and C. E. MacPhee, Proc. Natl. Acad. Sci. U. S. A., 2015, 112, 5419–5424 CrossRef CAS PubMed.
- J. B. Edel, A. A. Kornyshev, A. R. Kucernak and M. Urbakh, Chem. Soc. Rev., 2016, 45, 1581–1596 RSC.
- S. Sakthivel, R. L. Gardas and J. S. Sangwai, Energy Fuels, 2016, 30, 2514–2523 CrossRef CAS.
- A. C. McUmber, N. R. Larson, T. W. Randolph and D. K. Schwartz, Langmuir, 2015, 31, 5882–5890 CrossRef CAS PubMed.
- L. He, F. Lin, X. Li, H. Sui and Z. Xu, Chem. Soc. Rev., 2015, 44, 5446–5494 RSC.
- S. Ou, D. Cui and S. Patel, Phys. Chem. Chem. Phys., 2016, 18, 30357–30365 RSC.
- S. M. Kirby, S. L. Anna and L. M. Walker, Langmuir, 2015, 31, 4063–4071 CrossRef CAS PubMed.
- W. Gao, Y. Jiao and L. L. Dai, J. Nanopart. Res., 2016, 18, 1–11 CrossRef.
- M. Lashkarbolooki, M. Riazi, S. Ayatollahi and A. Zeinolabedini Hezave, Fuel, 2016, 165, 75–85 CrossRef CAS.
- B. Y. Wen, C. Z. Sun, Y. Q. Che and B. F. Bai, J. Eng. Thermophys., 2016, 5, 1011–1015 Search PubMed.
- Z. Weng, P. Y. Zhang, G. W. Chu, W. Wang, J. Yun and J. F. Chen, Can. J. Chem. Eng., 2015, 93, 1410–1415 CrossRef CAS.
- D. Langevin, Annu. Rev. Fluid Mech., 2014, 46, 47–65 CrossRef.
- Y. Levin and A. P. dos Santos, J. Phys.: Condens. Matter, 2014, 26, 203101 CrossRef PubMed.
- K. Masschaele, B. J. Park, E. M. Furst, J. Fransaer and J. Vermant, Phys. Rev. Lett., 2010, 105, 048303 CrossRef PubMed.
- A. P. dos Santos and Y. Levin, Langmuir, 2012, 28, 1304–1308 CrossRef CAS PubMed.
- T. Tichelkamp, H. Hosseinzade Khanamiri, M. Nourani, J. Åge Stensen, O. Torsæter and G. Øye, Energy Fuels, 2016, 30, 2919–2924 CrossRef CAS.
- M. Luo, G. K. Olivier and J. Frechette, Soft Matter, 2012, 8, 11923–11932 RSC.
- G. I. Guerrero-García, Y. Jing and M. Olvera de la Cruz, Soft Matter, 2013, 9, 6046–6052 RSC.
- M. Moradi, E. Topchiy, T. E. Lehmann and V. Alvarado, Fuel, 2013, 112, 236–248 CrossRef CAS.
- F. Moeini, A. Hemmati-Sarapardeh, M. H. Ghazanfari, M. Masihi and S. Ayatollahi, Fluid Phase Equilib., 2014, 375, 191–200 CrossRef CAS.
- J. Zwanikken and R. van Roij, Phys. Rev. Lett., 2007, 99, 178301 CrossRef PubMed.
- M. E. Leunissen, J. Zwanikken, R. Van Roij, P. M. Chaikin and A. Van Blaaderen, Phys. Chem. Chem. Phys., 2007, 9, 6405–6414 RSC.
- H. Hosseinzade Khanamiri, O. Torsæter and J. Å. Stensen, Energy Fuels, 2016, 30, 8114–8124 CrossRef CAS.
- G. Licari, P. F. Brevet and E. Vauthey, Phys. Chem. Chem. Phys., 2016, 18, 2981–2992 RSC.
- J. Penfold, R. K. Thomas, P. X. Li, J. T. Petkov, I. Tucker, J. R. Webster and A. E. Terry, Langmuir, 2015, 31, 3003–3011 CrossRef CAS PubMed.
- E. J. Robertson and G. L. Richmond, J. Phys. Chem. C, 2014, 118, 28331–28343 CAS.
- C. Sun and B. Bai, Phys. Chem. Chem. Phys., 2017, 19, 3894–3902 RSC.
- V. Venkateshwaran, S. Vembanur and S. Garde, Proc. Natl. Acad. Sci. U. S. A., 2014, 111, 8729–8734 CrossRef CAS PubMed.
- N. Holmberg, M. Sammalkorpi and K. Laasonen, J. Phys. Chem. B, 2014, 118, 5957–5970 CrossRef CAS PubMed.
- M. Vazdar, E. Pluhařová, P. E. Mason, R. Vácha and P. Jungwirth, J. Phys. Chem. Lett., 2012, 3, 2087–2091 CrossRef CAS.
- P. Sahu, S. M. Ali and K. T. Shenoy, Phys. Chem. Chem. Phys., 2016, 18, 23769–23784 RSC.
- I. Benjamin, J. Phys. Chem. B, 2013, 117, 4325–4331 CrossRef CAS PubMed.
- C. Sun and B. Bai, Appl. Therm. Eng., 2017, 116, 724–730 CrossRef CAS.
- C. Zhang and P. Carloni, J. Phys.: Condens. Matter, 2012, 24, 124109 CrossRef PubMed.
- C. Jian, M. R. Poopari, Q. Liu, N. Zerpa, H. Zeng and T. Tang, Energy Fuels, 2016, 30, 10228–10235 CrossRef CAS.
- N. Kikkawa, L. Wang and A. Morita, J. Am. Chem. Soc., 2015, 137, 8022–8025 CrossRef CAS PubMed.
- W. Wan, J. Zhao, J. H. Harwell and B. J. Shiau, J. Dispersion Sci. Technol., 2016, 37, 280–287 CrossRef CAS.
- A. P. Lyubartsev and A. Laaksonen, J. Phys. Chem., 1996, 100, 16410–16418 CrossRef CAS.
- C. Zhang, S. Raugei, B. Eisenberg and P. Carloni, J. Chem. Theory Comput., 2010, 6, 2167–2175 CrossRef CAS PubMed.
- S. W. I. Siu, K. Pluhackova and R. A. Böckmann, J. Chem. Theory Comput., 2012, 8, 1459–1470 CrossRef CAS PubMed.
- S. Plimpton, J. Comput. Phys., 1995, 117, 1–19 CrossRef CAS (http://lammps.sandia.gov).
- J. G. Kirkwood and F. P. Buff, J. Chem. Phys., 1949, 17, 338–343 CrossRef CAS.
- Y. Zhang, S. E. Feller, B. R. Brooks and R. W. Pastor, J. Chem. Phys., 1995, 103, 10252–10266 CrossRef CAS.
- S. S. Jang, S. T. Lin, P. K. Maiti, M. Blanco, W. A. Goddard, P. Shuler and Y. Tang, J. Phys. Chem. B, 2004, 108, 12130–12140 CrossRef CAS.
- S. S. Susnar, H. A. Hamza and A. W. Neumann, Colloids Surf., A, 1994, 89, 169–180 CrossRef CAS.
- A. Goebel and K. Lunkenheimer, Langmuir, 1997, 13, 133–142 CrossRef.
- A. Georgiadis, G. Maitland, J. P. M. Trusler and A. Bismarck, J. Chem. Eng. Data, 2011, 56, 4900–4908 CrossRef CAS.
- M. A. Fernandez-Rodriguez, J. Ramos, L. Isa, M. A. Rodriguez-Valverde, M. A. Cabrerizo-Vilchez and R. Hidalgo-Alvarez, Langmuir, 2015, 31, 8818–8823 CrossRef CAS PubMed.
- B. Y. Cai, J. T. Yang and T. M. Guo, J. Chem. Eng. Data, 1996, 41, 493–496 CrossRef CAS.
- S. Zeppieri, J. Rodríguez and A. López de Ramos, J. Chem. Eng. Data, 2001, 46, 1086–1088 CrossRef CAS.
- T. Al-Sahhaf, A. Elkamel, A. Suttar Ahmed and A. Khan, Chem. Eng. Commun., 2005, 192, 667–684 CrossRef CAS.
- F. Hofmeister, Arch. Exp. Pathol. Pharmakol., 1888, 25, 1–30 Search PubMed.
- Y. Zhang and P. S. Cremer, Curr. Opin. Chem. Biol., 2006, 10, 658–663 CrossRef CAS PubMed.
- Z. Yang, J. Biotechnol., 2009, 144, 12–22 CrossRef CAS PubMed.
Footnote |
| † Electronic supplementary information (ESI) available. See DOI: 10.1039/c7cp01826f |
|
| This journal is © the Owner Societies 2017 |
Click here to see how this site uses Cookies. View our privacy policy here. 
 Open Access Article
 This Open Access Article is licensed under a
  *a,
Elizaveta Ya.
Gatapova
*a,
Elizaveta Ya.
Gatapova