 Open Access Article
Creative Commons Attribution 3.0 Unported Licence
Isomerisation of an intramolecular hydrogen-bonded photoswitch: protonated azobis(2-imidazole)†
James N.
Bull
 ,
Michael S.
Scholz
,
Neville J. A.
Coughlan
and
Evan J.
Bieske
,
Michael S.
Scholz
,
Neville J. A.
Coughlan
and
Evan J.
Bieske
 *
*
School of Chemistry, University of Melbourne, Parkville, VIC 3010, Australia. E-mail: evanjb@unimelb.edu.au
First published on 2nd May 2017
Abstract
Photoisomerisation of protonated azobis(2-imidazole), an intramolecular hydrogen-bonded azoheteroarene photoswitch molecule, is investigated in the gas phase using tandem ion mobility mass spectrometry. The E and Z isomers exhibit distinct spectral responses, with E–Z photoisomerisation occurring over the 360–520 nm range (peak at 460 nm), and Z–E photoisomerisation taking place over the 320–420 nm range (peak at 390 nm). A minor photodissociation channel involving loss of N2 is observed for the E-isomer with a maximum efficiency at 390 nm, blue-shifted by ≈70 nm relative to the wavelength for maximum photoisomerisation response. Loss of N2 is also the predominant collision-induced dissociation channel. Electronic structure calculations suggest that E-isomer photoisomerisation involves S1(ππ*) excitation, whereas the Z-isomer photoisomerisation involves S2(ππ*) excitation. Conversion between the E and Z isomers through collisional excitation, which is calculated to occur through both inversion and torsion pathways, is investigated experimentally by colliding the molecular ions with nitrogen buffer gas over a range of electric fields. This study demonstrates the versatility of tandem ion mobility mass spectrometry for exploring the isomerisation of molecular photoswitches initiated by either light or collisions.
1 Introduction
Molecules consisting of two arene or heteroarene moieties linked by an azo group (–N![[double bond, length as m-dash]](https://www.rsc.org/images/entities/char_e001.gif) N–) exhibit reversible E (trans) → Z (cis) photoisomerisation about the azo bond, and in some cases possess the desirable characteristics for a molecular photoswitch, including high isomerisation quantum yield, photostability, and possibility of reversible photoisomerisation using different colours of visible light.1–3 They have potential applications as biological probes,2,4 actuators in molecular machines,5–7 molecular units for data storage,8 photochromic ionic liquid solvents,9 linking units to control peptide conformation and enzyme activity,10–13 and in photopharmacology.14–16 In a recent development, Weston et al.17 demonstrated that protonated azobis(2-imidazole) (PABI, Fig. 1), an imidazole-based photoswitch, can photoswitch an aqueous solution's pH by exploiting a pKa difference of ≈1.3 between the E and Z isomers in their ground electronic states. The origin of the E–Z isomer pKa difference is a stabilising hydrogen bond for the Z-isomer with the two imidazole rings sharing the additional proton. Imidazole-based azo moieties such as PABI are increasingly being used in photoswitching applications due to higher photoisomerisation quantum yields and slower thermal reversion rates compared with conventional azoarene based photoswitches.1 Because of their growing importance, it is desirable to understand the photochemistry and photoswitching behaviour of azoheteroarenes in a range of environments.
N–) exhibit reversible E (trans) → Z (cis) photoisomerisation about the azo bond, and in some cases possess the desirable characteristics for a molecular photoswitch, including high isomerisation quantum yield, photostability, and possibility of reversible photoisomerisation using different colours of visible light.1–3 They have potential applications as biological probes,2,4 actuators in molecular machines,5–7 molecular units for data storage,8 photochromic ionic liquid solvents,9 linking units to control peptide conformation and enzyme activity,10–13 and in photopharmacology.14–16 In a recent development, Weston et al.17 demonstrated that protonated azobis(2-imidazole) (PABI, Fig. 1), an imidazole-based photoswitch, can photoswitch an aqueous solution's pH by exploiting a pKa difference of ≈1.3 between the E and Z isomers in their ground electronic states. The origin of the E–Z isomer pKa difference is a stabilising hydrogen bond for the Z-isomer with the two imidazole rings sharing the additional proton. Imidazole-based azo moieties such as PABI are increasingly being used in photoswitching applications due to higher photoisomerisation quantum yields and slower thermal reversion rates compared with conventional azoarene based photoswitches.1 Because of their growing importance, it is desirable to understand the photochemistry and photoswitching behaviour of azoheteroarenes in a range of environments.
 | ||
| Fig. 1 E1 and Z1 isomers of protonated azobis(2-imidazole), PABI. The Z1-isomer has a hydrogen bond between the imidazole rings and is calculated to lie 5 kJ mol−1 above the E1-isomer. | ||
Photoisomerisation of azoheteroarenes such as PABI is generally assumed to occur through similar mechanisms to azobenzene.18 The S1(nπ*) ← S0 transition for E-azobenzene is symmetry forbidden due to the planar geometry, whereas the S2(ππ*) ← S0 transition has high oscillator strength (≈0.8).3 Time-resolved measurements in the gas phase demonstrate that E-azobenzene molecules in the S2 state undergo internal conversion to the S1 state on a 110–170 fs timescale, followed by isomerisation on a ≈500 fs timescale (≈25% quantum yield) and recovery of the S0 state.19–21 The S3(ππ*) and S4(ππ*) states of E-azobenzene, which are associated with weak absorption profiles overlapping the blue end of the S2 absorption band, undergo direct internal conversion to the S0 state without isomerisation (although ground state isomerisation of the hot molecules may subsequently occur).19 Experiment and theory suggest that S1-mediated isomerisation occurs through both inversion and torsion of the azo bond, with the relative importance of the two mechanisms depending on the excitation wavelength, identity of the arene or heteroarene rings, functional group substitution, and solvent.19–25
In the current work we have investigated the isomerisation of E and Z isomers of PABI in the gas phase initiated through absorption of light or collisional excitation. The experimental approach involves tandem ion mobility spectrometry (IMS), whereby charged isomers drifting under the influence of an electric field through a buffer gas are separated according to their drift speeds, which depend on their collision cross sections. The E and Z isomers are separated in a first IMS stage and are then excited by either light or collisions, with separation of the resulting isomers in the second IMS stage. By monitoring the photoisomer yield as a function of wavelength, one can record a photoisomerisation action (PISA) spectrum that reflects the photoresponse of a particular isomer in the gas phase. A similar approach has been used by our group to investigate the photoisomerisation of polyene dye molecules,26,27 retinal protonated Schiff base,28–30 merocyanine,31 and recently by others to investigate an alkene-pyridinium chromophore embedded in a crown ether.32 One of the crucial issues we wish to address for PABI is whether reversible photoswitching is possible using light of different wavelengths, a characteristic of an ideal molecular photoswitch. We also aim to provide structural and spectroscopic data for PABI in the gas phase that can be compared with predictions from high-level theoretical calculations for the structures and relative energies for the various isomers, and the energies and intensities of their electronic transitions.
2 Experimental methods
Azobis(2-imidazole) was synthesised following the procedure of Weston et al.17 (see ESI†). The ion mobility experiments were performed using a custom IMS-IMS-MS apparatus illustrated in Fig. 2.33 Briefly, a solution of ≈10−4 mol L−1 analyte dissolved in methanol and adjusted to pH ≈ 4 with acetic acid was loaded into a syringe, which was connected via a section of silica capillary (flow rate ≈10 μL min−1) to an electrospray source operating at ≈3 kV. Electrosprayed ions were transferred via a heated capillary into a RF ion funnel (IF1), which gathered the ions and propelled them towards an electrostatic ion gate (IG1) that was opened to inject ≈100 μs packets of ions at 20 Hz into the first IMS region (IMS1). In IMS1 the ions were propelled by an electric field (44 V cm−1) through N2 buffer gas at a pressure of ≈6 Torr. The E and Z isomers become spatially separated because of differences in their collision cross-sections. At the end of IMS1 a Bradbury–Nielsen ion gate (IG2) was opened briefly (100 μs) to select either the E or Z isomer. These mobility-selected ions were excited immediately after IG2 with either a pulse of light or by collisional excitation in a short collision region with an adjustable electric field (slammer). The ions then passed through a second IMS region (IMS2) which serves to separate isomers formed by light or collisions. At the end of IMS2 a second ion funnel (IF2) collected the ions and introduced them into a differentially pumped octupole ion guide and then a quadrupole mass filter (QMF) that mass-selected the ions before they reached a channeltron ion detector. The detector was connected to a multichannel scaler that produced a histogram of ion counts against arrival time, corresponding to an arrival time distribution (ATD). The mobility resolution for singly-charged ions is typically 70–80.33 Collision cross-sections with N2 buffer gas were calibrated with respect to the cross sections for a series of tetraalkylammonium salts (see ESI†).For the photoisomerisation measurements, every second mobility-selected ion packet was irradiated using light from an optical parametric oscillator (OPO, EKSPLA NT342B, 2–3 mJ cm−2 pulse). The difference between the light-on and light-off ATDs (action signal) reflects the photoisomerisation response. The action signal was normalised with respect to total light-off ion signal and light pulse fluence.
For the collision-induced isomerisation measurements, the mobility-selected ion packets were energised in the slammer region between two electrodes that were separated by 3 mm and whose apertures were covered by 90% transmission nickel mesh. The slammer potential difference could be adjusted to increase the ions' drift velocity and energy of collisions with N2 buffer gas, promoting thermal isomerisation.34,35 In a collision-induced isomerisation experiment, ATDs were measured as a function of slammer potential difference, ΔV, typically ranging from 20 to 200 V (70–667 V cm−1). Potentials of all upstream electrodes were appropriately adjusted such that electric fields in other IMS drift regions were unaffected.
3 Theoretical methods
Electronic structure calculations for all PABI isomers were performed using the PSI4,36 GAMESS-US,37 ORCA 3.0.3,38 and Gaussian 09 software packages.39 Ground state isomer energies were computed at either the CCSD(T)/cc-pVTZ or DLPNO-CCSD(T)/cc-pVTZ level of theory at the MP2//cc-pVTZ or ωB97X-D//cc-pVTZ geometry.40–44 The DLPNO-CCSD(T) method has the advantage of being significantly faster than CCSD(T), although with a sacrifice in accuracy of typically ±4 kJ mol−1 relative to CCSD(T) – see further details in the ESI.†![[thin space (1/6-em)]](https://www.rsc.org/images/entities/char_2009.gif) 41 Vibrational zero-point energy corrections were determined from ωB97X-D//cc-pVTZ vibrational frequency calculations. The multistate XMCQDPT2/GEN and EOM-CCSD/GEN level of theory were used for determining excited state energies of the PABI isomers.45,46 The GEN basis set is the cc-pVTZ basis set from which f functions are excluded for computational tractability. Several recent studies used the multistate XMCQDPT2 method to provide reliable excited state potential energy surfaces for understanding the photoisomerisation of stilbene and azobenzene.23,47 These studies provide a detailed account of the CASSCF reference state averaging needed for a physically meaningful wavefunction for such systems. Following their recommendations, our multistate XMCQDPT2 calculations used a (12,12) reference space to provide a balanced description of the excited states. A series of XMCQDPT2 calculations with different denominator level shift values were performed to identify any intruder state influences, and allowed selection of the final value of 0.01 Hartree. No wavefunction symmetry restrictions were applied.
41 Vibrational zero-point energy corrections were determined from ωB97X-D//cc-pVTZ vibrational frequency calculations. The multistate XMCQDPT2/GEN and EOM-CCSD/GEN level of theory were used for determining excited state energies of the PABI isomers.45,46 The GEN basis set is the cc-pVTZ basis set from which f functions are excluded for computational tractability. Several recent studies used the multistate XMCQDPT2 method to provide reliable excited state potential energy surfaces for understanding the photoisomerisation of stilbene and azobenzene.23,47 These studies provide a detailed account of the CASSCF reference state averaging needed for a physically meaningful wavefunction for such systems. Following their recommendations, our multistate XMCQDPT2 calculations used a (12,12) reference space to provide a balanced description of the excited states. A series of XMCQDPT2 calculations with different denominator level shift values were performed to identify any intruder state influences, and allowed selection of the final value of 0.01 Hartree. No wavefunction symmetry restrictions were applied.
Collision cross-sections (Ωc) for all E and Z isomers of PABI and fragment ions were calculated using MOBCAL with the trajectory method parametrised for N2 buffer gas.48–50 Input charge distributions were computed at the ωB97X-D//cc-pVTZ level of theory with the Merz–Singh–Kollman scheme constrained to reproduce the electric dipole moment.51 Sufficient trajectories were computed to give calculated standard deviations less than 1 Å2.
4 Results and discussion
4.1 ATDs and isomer assignments
The ion mobility data clearly show that PABI has two stable isomers in the gas phase with relative abundances that depend on the treatment of the ions. As shown in Fig. 3, ATDs for PABI recorded with low and high drive voltage for IF1 exhibit two peaks, whose relative intensities depend on the IF1 drive voltage. At high IF1 RF drive voltage violent collisions convert the faster isomer to the slower isomer prior to their injection into the IMS drift region suggesting that the slower isomer is the more stable form.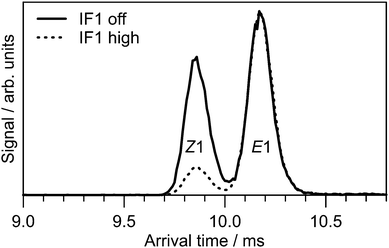 | ||
| Fig. 3 ATDs for PABI with no RF drive voltage applied to IF1 (solid line) and high RF drive voltage applied to IF1 (dashed line). The two peaks are assigned to predominately the E1 and Z1 isomers. | ||
Calculated structures for the lowest energy E and Z isomers of PABI are shown in Fig. 1, with relative energies given in Table 1. Although the three bonds linking the two arene groups can each have E or Z configuration giving a total of eight isomers, only seven of these isomers are potential energy minima (see ESI† for more details). According to the calculations, two of the higher energy E isomers (E3 and E4) should thermally convert over relatively low barriers to the global E-isomer (E1). A second E-isomer (E2) is predicted to have a similar Ωc to E1 and may also be present in small amounts. The E1 and E2 isomers are calculated to have similar excited states energies and are possibly indistinguishable in our experiment. The Z1-isomer of PABI (Fig. 1) is the only Z-isomer expected to be present in our experiments based on its relative stability and low isomerisation barriers for conversion to other Z-isomers.
| Species | ΔE/kJ mol−1 | Ω m/Å2 | Ω c/Å2 |
|---|---|---|---|
| E1 | 0 | 139.8 | 146 |
| Z1 | 5 | 135.2 | 141 |
| E-Azonium | 67 | — | 145 |
| Z-Azonium | 99 | — | 142 |
The CCSD(T) benchmark calculations (Table 1) predict the E1-isomer to be 5 kJ mol−1 more stable than the Z1-isomer, suggesting the slower peak in Fig. 3 is associated with the E1-isomer. This assignment is consistent with calculated (Ωc) and measured (Ωm) collision cross-sections, which are included in Table 1. Ωc values for other E and Z isomers are given in the ESI.† The ≈4% overestimation of Ωc compared with Ωm is consistent with measurements and calculations for other azo cations.52
It is worth noting that the minimum energy E-azonium and Z-azonium protomers of PABI, in which a proton is attached to an N atom of the azo group, are calculated to lie much higher in energy E1-PABI (Table 1) and are unlikely to be important in our experiment.
4.2 Photoisomerisation of E1 and Z1-PABI
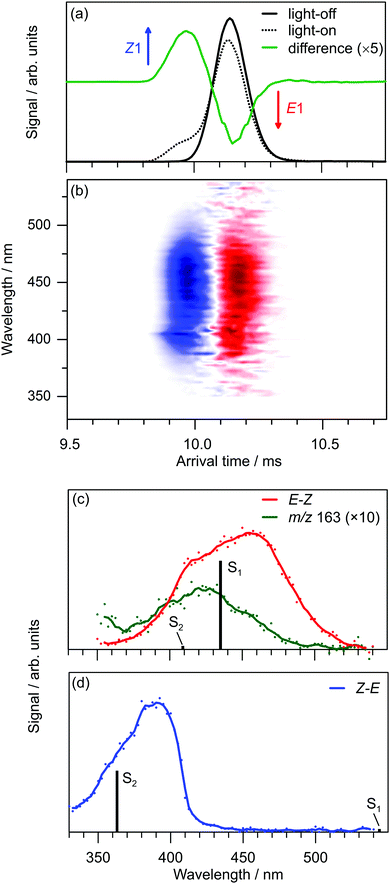
Exposing E and Z PABI to light in the drift region caused photoisomerisation. For example, Fig. 4a shows light-off, light-on, and difference (light-on–light-off) ATDs following exposure of the E1-isomer to 460 nm light. The difference ATD clearly shows depletion of the E1-isomer and its photoconversion to the Z1-isomer.‡ The photoisomerisation efficiency depends on wavelength, as shown Fig. 4b, which displays the difference ATD as a function of OPO wavelength. Integrating over the Z1-isomer appearance peak in Fig. 4b yields the E–Z photoisomerisation action (PISA) spectrum shown in Fig. 4c, which exhibits a broad photoisomerisation response over the 540–350 nm range, peaking at 460 nm (2.70 eV). The peak in the corresponding Z–E PISA spectrum, which is shown in Fig. 4d, has a maximum at 390 nm (3.18 eV), blue-shifted by ≈70 nm (0.48 eV) relative to the peak in the E–Z PISA spectrum. A similar difference between the E1 and Z1 isomer absorption is predicted by high level multistate XMCQDPT2 calculations, summarised in Fig. 5. These calculations predict the bright S1 state of the E1-isomer has ππ* character and occurs at 435 nm (2.85 eV, oscillator strength 1.0), whereas the optically dark S2 state with nπ* character occurs at 413 nm (oscillator strength 0.02). This S1 and S2 state ordering is reversed compared with E-azobenzene because the n orbital in PABI is stabilised by the added proton thereby increasing the energy of the nπ* excitation. For the Z1-isomer the optically dark nπ* S1 state occurs at 540 nm (oscillator strength 0.01), while the bright S2 ππ* state occurs at 363 nm (3.42 eV, oscillator strength 0.84). Thus, the XMCQDPT2 calculations are consistent with the PISA spectra in predicting that the Z1-isomer absorbs ≈0.5 eV higher in energy than the E1-isomer. The results of EOM-CCSD calculations are also broadly consistent with the multistate XMCQDPT2 calculations and give a similar separation for the bright states of the E1 and Z1-isomers.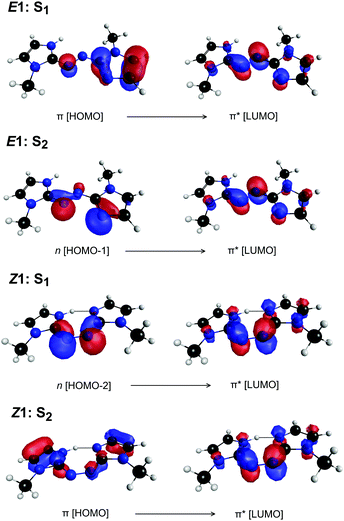 | ||
| Fig. 5 Predominant orbital excitations (CASSCF natural orbitals) to give the S1 and S2 states of E1-PABI and Z1-PABI. | ||
The marked difference between the PISA spectra of E1 and Z1 PABI isomers is at odds with the results for PABI in methanol solution reported by Weston et al.17 who deduced that E and Z PABI had similar absorption spectra, a result that was supported by accompanying TD-DFT calculations [CAM-B3LYP//6-311G(2df,2p) level] with a PCM continuum model. The UV-vis absorption spectrum of PABI in methanol at low-pH reported by Weston et al.,17 which appears to have a maximum at ≈440 nm is similar to the E–Z PISA spectrum. Comparisons between solution and gas-phase spectra for the Z-isomer are more difficult. Weston et al.17 reported an absorption spectrum for the photostationary state (PSS) established at 415 nm, which contains a mixture of E and Z-isomers (and perhaps also isomers of the neutral ABI molecule which absorb in the same range). The absorption spectrum of the PSS is similar to that of the E-isomer with a minor diminution of the main peak intensity, an observation that is consistent with overlapping E-isomer and Z-isomer bands for PABI in methanol.§ Reconciling the solution and gas-phase spectra of the E and Z isomers would require that methanol solvation of the Z isomer leads to a substantial red shift (≈50 nm) in its absorption maximum.
4.3 Photodissociation of E1-PABI
A small fraction of PABI photodissociated at wavelengths shorter than 470 nm to yield a m/z 163 photoproduct, consistent with loss of a N2 molecule. The m/z 163 degradation product could also be formed by exposing the PABI solution in the syringe with continuous 473 nm irradiation for several hours. N2 loss from azo and diazo compounds is a well-known thermal and photochemical decomposition process in both the gas phase and in solution.53–55 There is evidence for two m/z 163 isomers with the ATD for the m/z 163 photofragments (Fig. 6) displaying two peaks. The slower, more intense peak is assigned to protonated 1,1′-dimethyl-biimidazole (PDMB) whereas the faster peak is assigned to 1-methyl-3-(1-methyl-imidazol-2-yl)-1H-imidazol-3-ium (MMII) which is calculated (DLPNO-CCSD(T)/cc-pVTZ/ωB97XD/cc-pVTZ level) to lie 42 kJ mol−1 higher in energy. The isomer in which a ring tertiary nitrogen atom is protonated was calculated to lie >100 kJ mol−1 higher in energy than E-PDMB.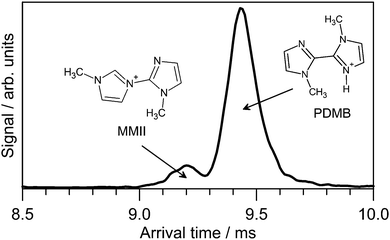 | ||
| Fig. 6 ATD recorded at m/z 163 following 473 nm irradiation of E1-PABI. Proposed PDMB and MMII isomer structures are indicated. | ||
The photodissociation action spectrum of PABI, obtained by monitoring the m/z 163 fragment (Fig. 4a), is blue-shifted compared to the PISA spectrum with the peak maxima separated by ≈50 nm. Although the reason for the blue shift is unclear, it may be associated with an energy barrier for the N2 loss channel, such that the process is more efficient for higher energy photons. CCSD(T)/cc-pVTZ/ωB97X-D/cc-pVTZ calculations determined the E1-PABI → E-PDBM + N2 channel to be exoergic with ΔE = −27 kJ mol−1 (the ωB97X-D//cc-pVTZ value is −8 kJ mol−1), suggesting that PABI should be susceptible to thermal decomposition in the gas-phase. In separate collisional excitation experiments, we confirmed that N2 loss is also the predominant collision-induced dissociation channel and that it has an onset somewhat above that for E–Z isomerisation (Section 4.4).
4.4 Collision-induced isomerisation of E1 and Z1-PABI
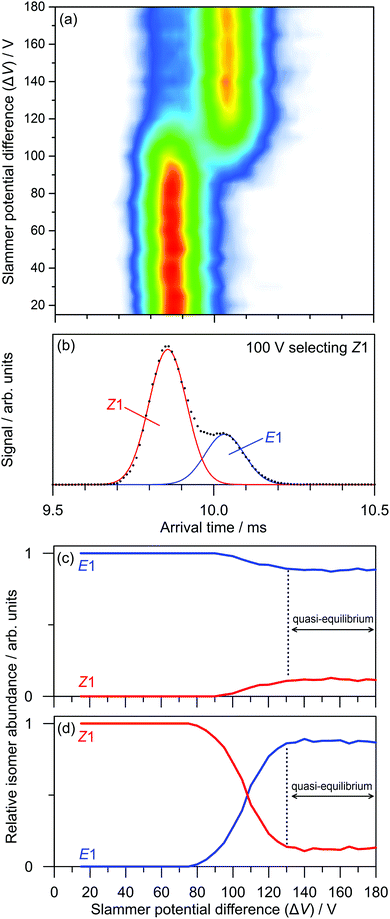
The transformations of PABI on the ground state potential energy surface were investigated by colliding the ions with N2 buffer gas in the slammer region. As an example, Fig. 7a illustrates the effect of collisions on the Z1-isomer over a range of slammer potential differences (ΔV). There is an obvious conversion of the Z1-isomer to the E1-isomer with an onset over the 90–130 V range. The presence of both isomers in this range is apparent in an ATD recorded with ΔV = 100 V (Fig. 7b). One can construct breakdown diagrams by fitting ATDs for each ΔV to a sum of Z1 and E1 Gaussian curves and plotting the amplitudes against ΔV. Breakdown curves, obtained starting with mobility-selected Z1 and E1-isomers, are shown in Fig. 7c and d, respectively. Analysis of the curves shows that E–Z isomerisation has a 88 ± 3 V threshold (Fig. 7c), whereas Z–E isomerisation has a 75 ± 3 V threshold (Fig. 7d). The ordering of these thresholds is consistent with the greater stability of the E1-isomer. As can be seen from Fig. 7c and d, a quasi-equilibrium is established over the ΔV = 130–180 V range with a 0.12![[thin space (1/6-em)]](https://www.rsc.org/images/entities/char_2009.gif) :
:![[thin space (1/6-em)]](https://www.rsc.org/images/entities/char_2009.gif) 0.88 Z1
0.88 Z1![[thin space (1/6-em)]](https://www.rsc.org/images/entities/char_2009.gif) :
:![[thin space (1/6-em)]](https://www.rsc.org/images/entities/char_2009.gif) E1 population ratio, independent of the initially selected isomer, again consistent with the greater stability of the E1-isomer.
E1 population ratio, independent of the initially selected isomer, again consistent with the greater stability of the E1-isomer.
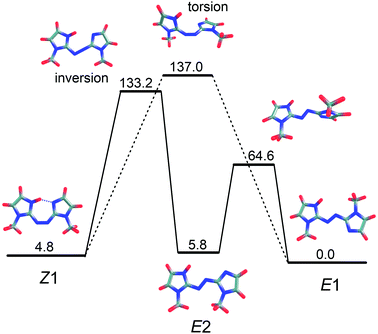
Through DLPNO-CCSD(T)/cc-pVTZ/ωB97X-D/cc-pVTZ calculations, we identified two ground state isomerisation pathways, illustrated in Fig. 8, corresponding to an inversion mechanism (barrier of 133 kJ mol−1) and a torsion mechanism (barrier of 137 kJ mol−1). Because the two pathways have similar barriers, both should contribute to collision-induced isomerisation in the gas phase. Note that Z–E isomerisation through the inversion mechanism first forms E2, which then rotates about a single bond to form the E1-isomer. The predicted importance of both the inversion and torsion pathways for PABI differs from the situation for neutral azobenzene, for which it is well established that thermal isomerisation proceeds through an inversion mechanism with a barrier of 189 kJ mol−1,24 somewhat larger than for PABI.
5 Conclusions
We have characterised the photoisomerisation of protonated azobis(2-imidazole), an intramolecular hydrogen-bonded photoswitch. In the gas phase, E–Z photoisomerisation occurs over the 360–520 nm range, and Z–E photoisomerisation occurs over the 420–320 nm range. The peak in the gas-phase photoisomerisation spectrum of the Z-isomer is blue-shifted by ≈70 nm relative to the E-isomer (consistent with the predictions from XMCQDPT2 calculations) implying that in the gas phase PABI fulfils one of the primary requirements of an ideal molecular switch – reversible photoswitching with different colours of light. Loss of an N2 molecule is identified as the predominant photo and collisional decomposition pathway.Acknowledgements
This research was funded through the Australian Research Council Discovery Project scheme (DP150101427 and DP160100474). Computational resources were provided by the Australian National Computational Infrastructure (NCI) through award of Early Career Allocation ya1 to JNB.References
- J. Calbo, C. E. Weston, A. J. P. White, H. S. Rzepa, J. Contreras-Garcia and M. J. Fuchter, J. Am. Chem. Soc., 2017, 139, 1261 CrossRef CAS PubMed.
- A. A. Beharry and G. A. Woolley, Chem. Soc. Rev., 2011, 40, 4422 RSC.
- H. M. D. Bandara and S. C. Burdette, Chem. Soc. Rev., 2012, 41, 1809 RSC.
- A. A. Beharry, L. Wong, V. Tropepe and G. A. Woolley, Angew. Chem., Int. Ed., 2011, 50, 1325 CrossRef CAS PubMed.
- T. Hugel, N. B. Holland, A. Cattani, L. Moroder, M. Seitz and H. E. Gaub, Science, 2002, 296, 1103 CrossRef PubMed.
- T. Muraoka, K. Kinbara and T. Aida, Nature, 2006, 440, 512 CrossRef CAS PubMed.
- W. R. Browne and B. L. Feringa, Nat. Nanotechnol., 2006, 1, 25 CrossRef CAS PubMed.
- Z. F. Liu, K. Hashimoto and A. Fujishima, Nature, 1990, 347, 658 CrossRef CAS.
- A. Ida, B. Cohen, T. Asaka, A. Kawai, J. A. Organero, K. Shibuya and A. Douhal, Phys. Chem. Chem. Phys., 2011, 13, 20318 RSC.
- P. Hamm, J. Helbing and J. Bredenbeck, Annu. Rev. Phys. Chem., 2008, 59, 291 CrossRef CAS PubMed.
- C. Renner and L. Moroder, ChemBioChem, 2006, 7, 869 CrossRef PubMed.
- W. Szymanński, J. M. Beierle, H. A. V. Kistemaker, W. A. Velema and B. L. Feringa, Chem. Rev., 2013, 113, 6114 CrossRef PubMed.
- Y. Kim, J. A. Phillips, H. Liu, H. Kang and W. Tan, Proc. Natl. Acad. Sci. U. S. A., 2009, 106, 6489 CrossRef CAS PubMed.
- W. A. Velema, W. Szymanski and B. L. Feringa, J. Am. Chem. Soc., 2014, 136, 2178 CrossRef CAS PubMed.
- M. Borowiak, W. Nahaboo, M. Reynders, K. Nekolla, P. Jalinot, J. Hasserodt, M. Rehberg, M. Delattre, S. Zahler, A. Vollmar, D. Trauner and O. Thorn-Seshold, Cell, 2015, 162, 403 CrossRef CAS PubMed.
- M. R. Banghart, A. Mourot, D. L. Fortin, J. Z. Yao, R. H. Kramer and D. Trauner, Angew. Chem., Int. Ed., 2009, 48, 9097 CrossRef CAS PubMed.
- C. E. Weston, R. D. Richardson and M. J. Fuchter, Chem. Commun., 2016, 52, 4521 RSC.
- J. Otsuki, K. Suwa, K. K. Sarker and C. Sinha, J. Phys. Chem. A, 2007, 111, 1403 CrossRef CAS PubMed.
- T. Schultz, J. Quenneville, B. Levine, A. Toniolo, T. J. Martínez, S. Lochbrunner, M. Schmitt, J. P. Shaffer, M. Z. Zgierski and A. Stolow, J. Am. Chem. Soc., 2003, 125, 8098 CrossRef CAS PubMed.
- E. M. M. Tan, S. Amirjalayer, S. Smolarek, A. Vdovin, F. Zerbetto and W. J. Buma, Nat. Commun., 2015, 6, 5860 CrossRef PubMed.
- T. Fujino, S. Y. Arzhantsev and T. Tahara, J. Phys. Chem. A, 2001, 105, 8123 CrossRef CAS.
- T. Cusati, G. Granucci and M. Persico, J. Am. Chem. Soc., 2011, 133, 5109 CrossRef CAS PubMed.
- M. Quick, A. L. Dobryakov, M. Gerecke, C. Richter, F. Brendt, I. N. Ioffe, A. A. Granovsky, R. Mahrwald, N. P. Ernsting and S. A. Kovalenko, J. Phys. Chem. B, 2014, 118, 8756 CrossRef CAS PubMed.
- J. Casellas, M. J. Bearpark and M. Reguero, ChemPhysChem, 2016, 17, 1 CrossRef PubMed.
- I. Conti, M. Garavelli and G. Orlandi, J. Am. Chem. Soc., 2008, 130, 5216 CrossRef CAS PubMed.
- B. D. Adamson, N. J. A. Coughlan, R. E. Continetti and E. J. Bieske, Phys. Chem. Chem. Phys., 2013, 15, 9540 RSC.
- B. D. Adamson, N. J. A. Coughlan, G. da Silva and E. J. Bieske, J. Phys. Chem. A, 2013, 117, 13319 CrossRef CAS PubMed.
- N. J. A. Coughlan, B. D. Adamson, K. J. Catani, U. Wille and E. J. Bieske, J. Phys. Chem. Lett., 2014, 5, 3195 CrossRef CAS PubMed.
- N. J. A. Coughlan, K. J. Catani, B. D. Adamson, U. Wille and E. J. Bieske, J. Chem. Phys., 2014, 140, 164307 CrossRef CAS PubMed.
- N. J. A. Coughlan, B. D. Adamson, L. Gamon, K. Catani and E. J. Bieske, Phys. Chem. Chem. Phys., 2015, 17, 22623 RSC.
- P. B. Markworth, N. J. A. Coughlan, B. D. Adamson, L. Goerigk and E. J. Bieske, Phys. Chem. Chem. Phys., 2015, 17, 25676 RSC.
- I. Czerwinska, A. Kulesza, C. Choi, F. Chirot, A.-L. Simon, J. Far, C. Kune, E. de Pauw and P. Dugourd, Phys. Chem. Chem. Phys., 2016, 18, 32331 RSC.
- B. D. Adamson, N. J. A. Coughlan, P. B. Markworth, R. E. Continetti and E. J. Bieske, Rev. Sci. Instrum., 2014, 85, 123109 CrossRef CAS PubMed.
- N. A. Pierson, S. J. Valentine and D. E. Clemmer, J. Phys. Chem. B, 2010, 114, 7777 CrossRef CAS PubMed.
- N. A. Pierson and D. E. Clemmer, Int. J. Mass Spectrom., 2015, 377, 646 CrossRef CAS PubMed.
- J. M. Turney, A. C. Simmonett, R. M. Parrish, E. G. Hohenstein, F. Evangelista, J. T. Fermann, B. J. Mintz, L. A. Burns, J. J. Wilke, M. L. Abrams, N. J. Russ, M. L. Leininger, C. L. Janssen, E. T. Seidl, W. D. Allen, H. F. Schaefer, R. A. King, E. F. Valeev, C. D. Sherrill and T. D. Crawford, Wiley Interdiscip. Rev.: Comput. Mol. Sci., 2012, 2, 556 CrossRef CAS.
- M. W. Schmidt, K. K. Baldridge, J. A. Boatz, S. T. Elbert, M. S. Gordon, J. H. Jensen, S. Koseki, N. Matsunaga, K. A. Nguyen, S. Su, T. L. Windus, M. Dupuis and J. A. Montgomery, J. Comput. Chem., 1993, 14, 1347 CrossRef CAS.
- F. Neese, Wiley Interdiscip. Rev.: Comput. Mol. Sci., 2012, 2, 73 CrossRef CAS.
- M. J. Frisch, G. W. Trucks, H. B. Schlegel, G. E. Scuseria, M. A. Robb, J. R. Cheeseman, G. Scalmani, V. Barone, B. Mennucci, G. A. Petersson, H. Nakatsuji, M. Caricato, X. Li, H. P. Hratchian, A. F. Izmaylov, J. Bloino, G. Zheng, J. L. Sonnenberg, M. Hada, M. Ehara, K. Toyota, R. Fukuda, J. Hasegawa, M. Ishida, T. Nakajima, Y. Honda, O. Kitao, H. Nakai, T. Vreven, J. A. Montgomery, Jr., J. E. Peralta, F. Ogliaro, M. Bearpark, J. J. Heyd, E. Brothers, K. N. Kudin, V. N. Staroverov, R. Kobayashi, J. Normand, K. Raghavachari, A. Rendell, J. C. Burant, S. S. Iyengar, J. Tomasi, M. Cossi, N. Rega, J. M. Millam, M. Klene, J. E. Knox, J. B. Cross, V. Bakken, C. Adamo, J. Jaramillo, R. Gomperts, R. E. Stratmann, O. Yazyev, A. J. Austin, R. Cammi, C. Pomelli, J. W. Ochterski, R. L. Martin, K. Morokuma, V. G. Zakrzewski, G. A. Voth, P. Salvador, J. J. Dannenberg, S. Dapprich, A. D. Daniels, Ö. Farkas, J. B. Foresman, J. V. Ortiz, J. Cioslowski and D. J. Fox, Gaussian 09 Revision D.01, Gaussian Inc., Wallingford, CT, 2009 Search PubMed.
- J. A. Pople, M. Head-Gordon and K. Raghavachari, J. Chem. Phys., 1987, 87, 5968 CrossRef CAS.
- C. Riplinger, B. Sandhoefer, A. Hansen and F. Neese, J. Chem. Phys., 2013, 139, 134101 CrossRef PubMed.
- M. J. Frisch, M. Head-Gordon and J. A. Pople, Chem. Phys. Lett., 1990, 166, 281 CrossRef CAS.
- J.-D. Chai and M. Head-Gordon, Phys. Chem. Chem. Phys., 2008, 10, 6615 RSC.
- T. H. Dunning, Jr., J. Chem. Phys., 1989, 90, 1007 CrossRef.
- A. A. Granovsky, J. Chem. Phys., 2011, 134, 214113 CrossRef PubMed.
- J. F. Stanton and R. J. Bartlett, J. Chem. Phys., 1993, 98, 7029 CrossRef CAS.
- I. N. Ioffe and A. A. Granovsky, J. Chem. Theory Comput., 2013, 9, 4973 CrossRef CAS PubMed.
- A. A. Shvartsburg and M. F. Jarrold, Chem. Phys. Lett., 1996, 261, 86 CrossRef CAS.
- M. Mesleh, J. Hunter, A. Shvartsburg, G. Schatz and M. Jarrold, J. Phys. Chem., 1996, 100, 16082 CrossRef CAS.
- I. Campuzano, M. F. Bush, C. V. Robinson, C. Beaumont, K. Richardson, H. Kim and H. I. Kim, Anal. Chem., 2012, 84, 1026 CrossRef CAS PubMed.
- B. H. Besler, K. M. Merz, Jr. and P. A. Kollman, J. Comput. Chem., 1990, 11, 431 CrossRef CAS.
- J. N. Bull, M. S. Scholz, N. J. A. Coughlan, A. Kawai and E. J. Bieske, Anal. Chem., 2016, 88, 11978 CrossRef CAS PubMed.
- P. S. Engel, Chem. Rev., 1980, 80, 99 CrossRef CAS.
- D. Srzic, M. Žinić, Z. Meić, G. Czira and J. Tainás, Org. Mass Spectrom., 1992, 27, 1305 CrossRef CAS.
- A. Leiba and I. Oref, J. Chem. Soc., Faraday Trans. 1, 1979, 75, 2694 RSC.
Footnotes |
| † Electronic supplementary information (ESI) available: Synthetic procedure; all PABI isomers and isomerisation barriers; review of the level of electronic structure theory; procedure for measuring collision cross-sections; ATDs recorded following irradiation of the photoswitch solution in the electrospray syringe with blue light. See DOI: 10.1039/c7cp01733b |
| ‡ Because the ions were irradiated approximately halfway along the drift region (after IMS1 and IG2), the photoisomer peak (Z1 for E–Z photoconversion or E1 for Z–E photoconversion) appears between the parent isomer peak and the peak for the product isomer when it is separated over both drift regions (IMS1 + IMS2). The same situation prevails for the slammer measurements described in Section 4.4. Note that in all presented ATDs t = 0 corresponds to the opening of IG1. |
| § Using IMS, we confirmed that PSSs established at 473 nm and 438 nm contain an appreciable fraction of the Z-isomer (≈60% Z-isomer at 473 nm, ≈40% Z-isomer at 438 nm). Note that Z–E thermal reversion from the PSS at pH 4 is slow (t1/2 = 1860 s, see ESI†) compared with the sampling time of our experiment (≈60 s), so measured ATDs should reflect PSS populations.52 |
| This journal is © the Owner Societies 2017 |


