
 Open Access Article
 This Open Access Article is licensed under a
 Creative Commons Attribution 3.0 Unported Licence
Factors affecting bubble size in ionic liquids†
Sarah F. R. Taylor ab,
Stuart A. Brittlec,
Pratik Desaic,
Johan Jacquemin*bd,
Christopher Hardacre*ab and
William A. Zimmerman*c
ab,
Stuart A. Brittlec,
Pratik Desaic,
Johan Jacquemin*bd,
Christopher Hardacre*ab and
William A. Zimmerman*c
aSchool of Chemical Engineering and Analytical Science, The University of Manchester, The Mill, Sackville Street, Manchester M13 9PL, UK. E-mail: c.hardacre@manchester.ac.uk
bSchool of Chemistry and Chemical Engineering, Queen's University Belfast, Belfast, BT9 5AG, Northern Ireland. E-mail: johan.jacquemin@qub.ac.uk
cDepartment of Chemical and Biological Engineering, University of Sheffield, Mappin Street, Sheffield, S1 3JD, UK. E-mail: w.zimmerman@sheffield.ac.uk
dUniversité François Rabelais, Laboratoire PCM2E, Parc de Grandmont, 37200, Tours, France. E-mail: jj@univ-tours.fr
First published on 16th May 2017
Abstract
This study reports on understanding the formation of bubbles in ionic liquids (ILs), with a view to utilising ILs more efficiently in gas capture processes. In particular, the impact of the IL structure on the bubble sizes obtained has been determined in order to obtain design principles for the ionic liquids utilised. 11 ILs were used in this study with a range of physico-chemical properties in order to determine parametrically the impact on bubble size due to the liquid properties and chemical moieties present. The results suggest the bubble size observed is dictated by the strength of interaction between the cation and anion of the IL and, therefore, the mass transport within the system. This bubble size – ILs structure–physical property relationship has been illustrated using a series of QSPR correlations. A predictive model based only on the sigma profiles of the anions and cations has been developed which shows the best correlation without the need to incorporate the physico-chemical properties of the liquids. Depending on the IL, selected mean bubble sizes observed were between 56.1 and 766.9 μm demonstrating that microbubbles can be produced in the IL allowing the potential for enhanced mass transport and absorption kinetics in these systems.
Introduction
The development of materials for gas capture and separation is important for many industrial applications. Recently, ionic liquids (ILs) have been widely investigated as gas sorbents.1 Results have shown that certain ILs can exhibit high gas solubility and more importantly the ability to selectively dissolve particular gases from mixed gas streams. Therefore, ILs have the potential to be drop in replacements for volatile molecular solvents in many industrial processes. ILs possess benefits over organic solvents such as chemically tunability, stability and low vapour pressure.2 However, in general, ILs have much higher viscosities than molecular solvents and, therefore, the reduced mass transfer associated with this property has hindered their employability on an industrial level.3Bubbling arrangements are commonplace in industrial capture and release applications to either achieve heat and/or mass transfer. Microbubbles, i.e. bubbles with diameter in the range 1 μm to 999 μm, have advantageous mass transfer properties over larger size bubbles. The rate at which mass transfer can occur is proportional to the interfacial area between which mass transfer is to occur. A reduction in bubble size increases the surface area to volume ratio and, therefore, smaller bubbles are favourable for increased surface area and mass transfer properties.4,5 Previously reported research documenting the use of microbubbles illustrates how these finer bubbles can improve numerous aqueous systems. Processes which have been shown to increase their efficiency through introduction of microbubbles include algal growth, separation rates and mixing in airlift-loop-bioreactors (ALBS).4,6–9 Therefore, the ability to create small bubbles within the IL media would enhance the mass transport and make ILs more applicable for gas capture systems.
In aqueous solutions, it has been shown that the charge density of the ions in solution effects the stabilisation of bubbles,10 a similar trend has also been seen with IL ions in solution.11 However the use of neat IL media will result in a different system with a number of other factors influencing bubble size/stability.
The mass transport properties within ILs is not well studied, to date, and bubble size data is only reported for a small number of ILs with the focus mainly on imidazolium-based ILs.12–16 These reports agree that viscosity and surface tension are the dominating factors in determining the bubble behaviour. In general, bubble size increases as viscosity increases and in cases where IL viscosities are similar, surface tension becomes the governing factor.16 Other experimental conditions have been investigated such as addition of water,13 temperature,12,16 gas flow rate,12 gas type15 and reactor geometry.15 The effect of the addition of water and the increase in temperature both result in decreases in bubble diameter potentially due to the subsequent decrease in viscosity. It has been found that mass transport models used for molecular solvents do not fit the data gained from IL systems as the gas–liquid interface is different; cations and anions are both present at the interface with no segregation and cation rings have been found to sit perpendicular rather than parallel to the surface.17 Other studies have been performed examining the mass transfer properties of CO2 in ILs using a combined computational fluid dynamic (CFD) and population balance model (PBM).18 However, the study of bubble size distribution within multi bubble systems in many ILs is still largely unreported and, therefore, a comprehensive study of bubble distributions within a wide range of ILs is required if ILs are to be implemented as reaction/separation media at an industrial scale.
This study considers a family of 11 ILs examining the key IL physico-chemical parameters that affect the sizes of bubbles produced within the media. The overall aim of this work is to develop design parameters which allow the IL to facilitate the generation of small bubbles without detrimentally affecting the gas affinity or increasing the energy consumption or process cost. For this reason, several Quantitative Structure–Property-Relationships-based correlations (QSPR) were investigated to illustrate a bubble size – ILs structure–physical properties relationships using key physical properties and/or molecular descriptors.
Experimental
Materials
Trihexyltetradecylphosphonium bromide [P66614]Br (97%), trihexyltetradecylphosphonium chloride [P66614]Cl (98%), trihexyltetradecylphosphonium decanoate [P66614][Dec] (97%) and trihexyltetradecylphosphonium dicyanamide [P66614][DCA] (97%) were used as received from Cytec and 1-ethyl-3-methylimidazolium dicyanamide [C2mim][DCA] (98%), 1-ethyl-3-methylimidazolium bis(trifluoromethylsulfonyl)imide [C2mim][NTf2] (≥97%), 1-butyl-3-methylimidazolium bis(trifluoromethylsulfonyl)imide [C4mim][NTf2] (≥98%) and 1-butyl-3-methyl pyrrolidinium bis(trifluoromethylsulfonyl)imide [C4mpyr][NTf2] (≥98%) were used as received from Merck. Trihexyltetradecylphosphonium bis(trifluoromethylsulfonyl)imide ([P66614][NTf2]) was synthesised by dissolving [P66614]Cl (50.8 g, 0.098 mol) in dichloromethane (100 cm3) and adding this solution dropwise to LiNTf2 (3 M, 97%, 28.7 g, 0.1 mol) dissolved in Milli-Q ultra-pure water (100 cm3). This solution was stirred under ambient conditions overnight. The organic layer was then removed and washed with doubly distilled, deionised water (100 cm3) five times and dried in vacuo. 1-Ethyl-3-methylimidazolium ethylsulfate ([C2mim][EtSO4]) was synthesised by dissolving diethylsulfate (Sigma-Aldrich, 98%, 154.2 g, 1 mol) in ice cold toluene (Sigma-Aldrich, ≥99.5%, 100 cm3) and adding this solution dropwise to 1-methylimidazole (Sigma-Aldrich, 99%, 82.1 g, 1 mol) dissolved in water (500 cm3) in an ice bath under a nitrogen atmosphere. This solution was stirred overnight. The organic solvent was then removed and the former IL was then sequentially washed with toluene (100 cm3) and dried in vacuo five times. 1-Butyl-3-methylimidazolium trifluoroacetate [C4mim][TFA] was synthesised from trifluoroacetic acid (Sigma-Aldrich, 99%, 114.0 g, 1 mol) added dropwise to 1-butyl-3-methylimidazolium chloride (174.7 g, 1 mol) dissolved in Milli-Q ultra-pure water (500 cm3) in an ice bath and allowed to stir overnight. The solvent was then removed using a rotary evaporator to obtain the IL. All ILs were dried in vacuo (<10−2 mbar@40 °C) for a minimum of 48 h and maintained under a flow of dry N2 overnight before microbubble measurements were carried out. After drying, the water content of the ILs was measured using a Metrohm 787 KF Titrino Karl Fischer as <0.1 wt% for all ILs. The purity of the synthesized ILs was analysed using 1H NMR using a Bruker 300 MHz Ultra shield Plus NMR spectrometer and the results were consistent with literature reports.19,20Methods
Nitrogen (BOC, 99.998%) was delivered to the IL via a Bronkhorst mass flow controller. The gas was flowed for ∼5 min prior to the measurements being made in order to equilibrate the pressure within the system, including the ceramic porous material. During this time bubbles continuously detached from the surface of the ceramic and into the IL. The ceramic porous material used in this study had an average pore size of 2.5 μm as shown in Fig. 1. Scanning electron microscopy (SEM) was carried out on a JEOL JSM 6300 SEM with an Agar MB7240 gold sputter coater. This material has a thickness of 10 mm and the pressure required to allow bubbling in an aqueous system is 2.4 bar (gauge) at 298 K and 101.325 kPa.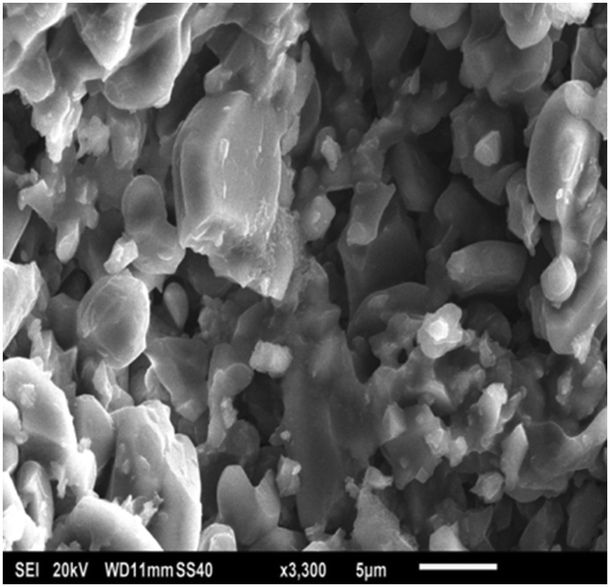 | ||
| Fig. 1 A scanning electron microscope (SEM) image of the porous ceramic material. | ||
Typically, the microbubble rigs reported previously have volumes of >50 L;8 however, due to the use of ILs and the associated synthesis and procumbent costs, the equipment was scaled down to allow the use of smaller volumes. In these measurements, ∼120 cm3 of IL was employed. The rig, consists of a stainless-steel base with an inlet chamber and a microporous ceramic diffuser. The chamber section is secured to a quartz glass viewing section for bubble visualisation and imaging. Nitrogen is bubbled into the IL at 3 cm3 min−1 for each of the ILs in order to directly compare the bubble size distribution in each case. This particularly low flow rate is used to minimise the amount of bubbles created within the IL and, therefore, reduce the risk of overlapping bubbles during imaging. In addition, all materials of construction were tested to examine the effect of the ILs to ensure compatibility with the IL media.
 | (1) |
This relationship suggests that the contact angle is independent of drop size, provided that the drop is small enough to ignore gravitational effects.21
The contact angle reported, herein, is the angle that a droplet of IL makes when it is placed on a ceramic surface. It is measured at 293.15 K and 101.325 kPa using an Attension Theta tensiometer, which is able to measure contact angles using its optimised setup including a monochromatic light source, adjustable sample holder and dedicated software. This allows a droplet of IL placed on a non-porous ceramic substrate to be analysed and its volume and contact angle easily measured. The ceramic substrate material was chosen to replicate that of the porous ceramic diffuser of the microbubble rig without the complications of a porous structure. The IL was pipetted onto a cleaned substrate stage. The ceramic substrates were cleaned by applying chloroform then propan-2-ol then water followed by the propan-2-ol then chloroform before drying. Three measurements were taken and an average value taken providing a standard deviation of 2 sigma. Prior to both bubble imaging and contact angle experiments the ILs were dried/equilibrated with the gas stream by bubbling nitrogen through the media overnight at room temperature and stored within a vacuum desiccator.
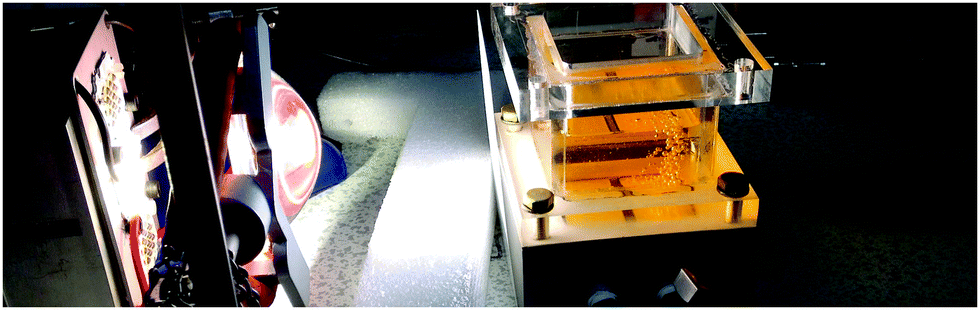 | ||
| Fig. 2 Imaging set-up, with light LED light source, focusing lens, diffusion sheet, bubble visualisation rig and imaging microscope. | ||
Once the images of bubbles in the IL have been taken, the bubble size distribution was obtained using bespoke bubble-sizing software (Fig. 3).22 This software is able to automate a number of imaging processing techniques on a large number of images, each containing multiple bubbles.
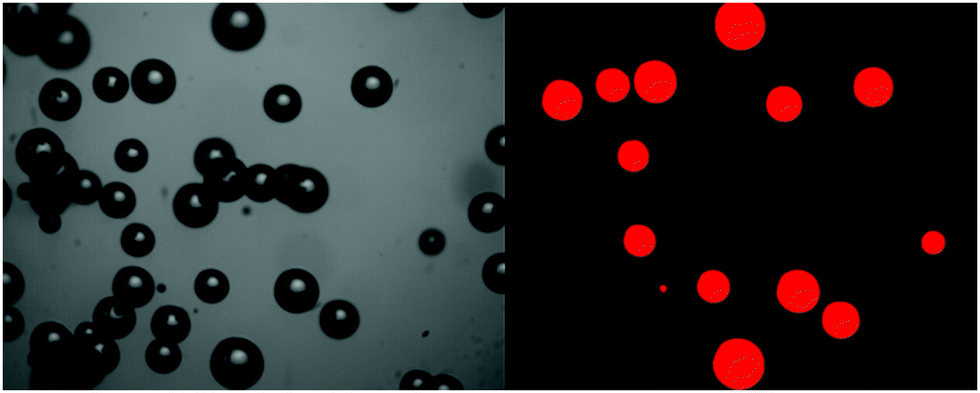 | ||
| Fig. 3 Black and white optical images bubbles in [C4mim][NTf2], left, and identified bubbles in foreground red using automated bubble-sizing software, right. | ||
The software program takes a folder of bubble images and outputs both an average bubble size from the collection of images in a folder and also a complete set of bubbles sizes for further size distribution analysis. The data gained from the bubble-sizing software is used to produce a bubble size distribution and repeated for each IL. The bin size was chosen as 5 μm within a range from 0 to 2000 μm. The bin sizes and the range are kept constant for all the IL for ease of comparison. The bubble size distributions for the 11 ILs studied are shown in Fig. S1–S11 of the ESI.†
From the bubble size distributions presented in these figures, it is apparent that there are significant differences in the shape of the distributions curves for each of the ILs. In order to further analyse the bubble size distribution each was examined quantitatively using the mean bubble size and kurtosis.
The mean bubble size is obtained using eqn (2):
 | (2) |
Kurtosis is also used to describe the distribution of a data set. Kurtosis is a measure of how flat (negative kurtosis) or sharp (positive kurtosis) the peak of the data set appears. Kurtosis for Gaussian distributions is zero. Kurtosis values were obtained using the following equation:
 | (3) |
Prior to utilisation of this software, the structure of each ion involved was optimized within the Turbomole 7.0 program package,24 with a convergence criterion of 10−8 Hartree in the gas phase DFT calculations combining the Resolution of Identity (RI) approximation25 utilizing the B3LYP functional with the def-TZVP basis set.26 Each resultant optimized structure was then used as an input for the generation of the most stable conformer of each species using the COSMOconfX program (version 4.0). The COSMOthermX software (version C30_1602) was then used to determine the sigma profile, COSMO volume of each ion, as well as, the free volume in each selected IL by following the same methodology as already presented previously by our group.27 Additionally, sigma-moments were determined to further analyse the capability of the COSMOthermX software to be used as a QSPR-based approach to correlate average IL bubble sizes as the function of the ILs structure by following the same approach as that reported by Klamt et al.23
Results and discussion
The series of ILs were selected for microbubble testing to cover a wide range of viscosities (16–2900 mPa s), densities (0.8–1.5 g cm−3), molecular weights (170–760 g mol−1) and hydrophobicity as measured by contact angle (11.7–56.4°) at 293.15 K and 101.325 kPa. The structures of the cations and anions of the various ILs used are given in Fig. 4.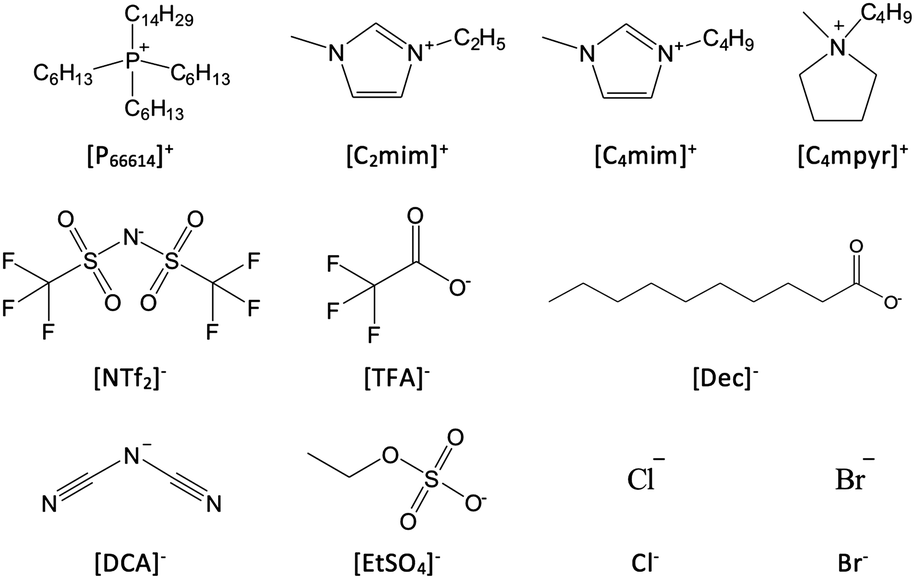 | ||
| Fig. 4 IL anions and cations molecular structures. | ||
In this study, the bubble size data have been acquired after bubbling with nitrogen to understand how the various IL properties correlate with the bubble size observed. Nitrogen gas was used instead of CO2 to limit the effect of gas dissolved in selected ILs on the bubble size distributions observed as it is very well reported in the literature that N2 has a lower solubility than CO2 in several ILs.28,29 The results from the microbubble experiments are given in Table 1; including average bubble size and measures of distributions (standard deviation and kurtosis).
![[thin space (1/6-em)]](https://www.rsc.org/images/entities/char_2009.gif) 325 Pa; mean bubble radius, standard deviation and kurtosis values calculated for the bubble size data, molecular weight, literature values for viscosity and density, free volume determined using COSMOthermX by following methodology reported previously,27 as well as, experimental contact angle measurements
325 Pa; mean bubble radius, standard deviation and kurtosis values calculated for the bubble size data, molecular weight, literature values for viscosity and density, free volume determined using COSMOthermX by following methodology reported previously,27 as well as, experimental contact angle measurements
| Molecular weight (g mol−1) | Viscosity (Pa s) | Density (kg m−3) | Contact angle (°) | Free volume (cm3 mol−1) | Mean bubble radius (μm) | Standard deviation (μm) | Kurtosis | |
|---|---|---|---|---|---|---|---|---|
| [C2mim][DCA] | 177.2 | 0.016130 | 1104.030 | 43.7 | 19.96 | 56.1 | 29.3 | 5.03 |
| [C4mim][TFA] | 252.2 | 0.076931 | 1215.531 | 35.3 | 23.51 | 62.9 | 32.9 | 8.56 |
| [C2mim][EtSO4] | 236.3 | 0.097632 | 1238.832 | 53.5 | 21.76 | 102.0 | 52.3 | 3.72 |
| [P66614][DCA] | 549.9 | 0.363033 | 897.633 | 25.2 | 134.42 | 270.9 | 109.6 | 0.10 |
| [C4mim][NTf2] | 419.4 | 0.050734 | 1436.634 | 36.7 | 31.93 | 276.9 | 109.5 | −0.02 |
| [C2mim][NTf2] | 391.3 | 0.032535 | 1518.735 | 56.4 | 24.82 | 279.4 | 69.7 | 1.51 |
| [C4mpyr][NTf2] | 422.4 | 0.077636 | 1394.936 | 27.3 | 35.36 | 400.6 | 205.6 | −0.43 |
| [P66614][NTf2] | 764.0 | 0.336737 | 1066.137 | 20.9 | 140.25 | 415.4 | 168.7 | 0.44 |
| [P66614][Dec] | 655.1 | 0.471537 | 880.637 | 18.5 | 167.90 | 517.7 | 150.3 | 1.79 |
| [P66614]Br | 563.8 | 2.988437 | 955.237 | 21.6 | 119.19 | 582.1 | 334.6 | −0.64 |
| [P66614]Cl | 519.3 | 2.729137 | 889.937 | 11.7 | 125.39 | 766.9 | 349.7 | −0.01 |
Table 1 shows, in general, that the ILs containing a tetraalkyl phosphonium cation exhibited the largest bubble sizes whereas the imidazolium based ILs resulted in the smallest bubble sizes observed. The lowest mean bubble size was observed in [C2mim][DCA] and the largest mean bubble size was observed in [P66614]Cl. To help understand the cause of the differing bubble size distributions and average bubble sizes in a selection of ILs, individual properties (viscosity,30–37 density,30–37 contact angle, molecular weight and free volume) are considered and are also listed in Table 1.
From an initial inspection of bubble size results and IL parameters (Table 1) coupled with previous work,15,16 it was expected that the viscosity would be a significant factor in determining the bubble size with an expected trend of increased bubble size with increased viscosity. The dependence of bubble size with respect to the ILs viscosity is given in Fig. 5.
 | ||
| Fig. 5 A graph showing average bubble radius against viscosity for each IL. The line represents the correlation obtained using the eqn (4). | ||
Fig. 5 shows the expected general trend that with increased viscosity (η) larger average bubble radii are found.13Eqn (4) was then used to correlate this data set within a R2 value close to 0.70.
| Mean bubble size = 526.1 + 109.7·ln(η) | (4) |
However, the six ILs with the lowest viscosities ([C2mim][DCA], [C2mim][EtSO4], [C2mim][NTf2], [C4mim][NTf2], [C4mim][TFA] and [C4mpyr][NTf2]) have viscosities within a similar range (0.0161–0.0976 Pa s) but produce very different average bubble sizes differing by up to 500% from 56.1 μm to 279.4 μm. In particular, [C4mpyr][NTf2] which has a viscosity of 0.0776 Pa s gives an average bubble size of 400.6 μm and [C4mim][TFA] which has a similar viscosity of 0.0769 Pa s results in a much lower average bubble size of 62.9 μm. This clearly shows that there are other factors apart from viscosity that affect the ILs bubble size distribution.
Wettability (contact angle) has also been reported previously as a contributing factor in determining the bubble size.38 It has been shown that bubble sizes increase with increasing contact angle; however, this was demonstrated using water as the liquid and the hydrophobicity of the surface was modified to produce a range of contact angles and the resulting bubble size measured. Fig. 6 shows the average bubble radius against contact angle for each IL studied. In all cases, the surface remained constant and the hydrophobicity of the liquid is varied. In contrast to the previous observations, in general, the bubble size was found to decrease with increasing contact angle which could be correlated reasonably (R2 = 0.77) using the following equation:
| Mean bubble size = 1395.6·exp(−0.0522·γ) | (5) |
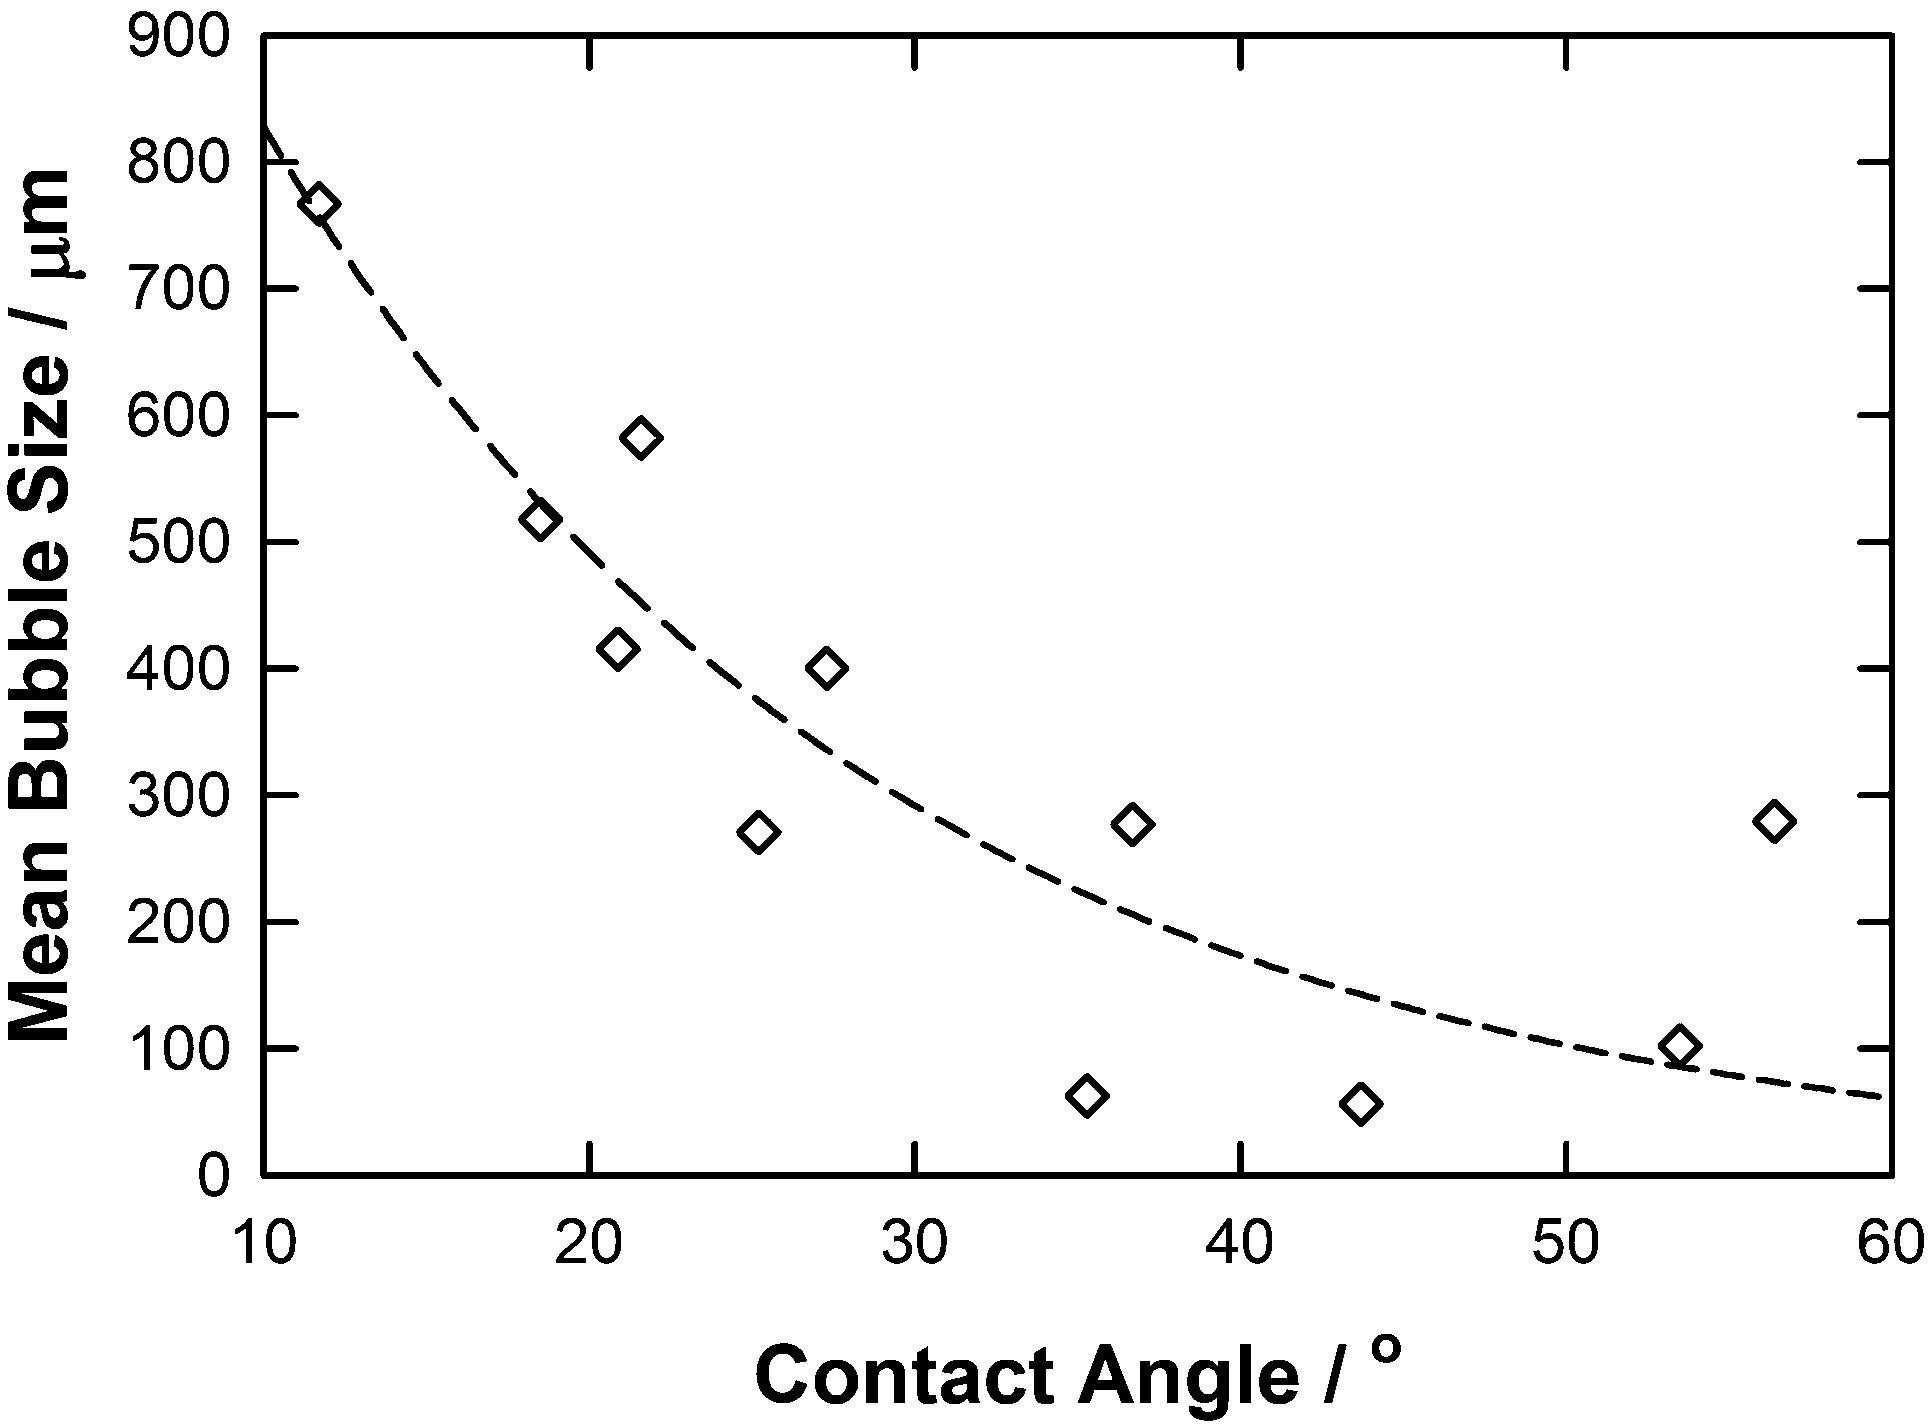 | ||
| Fig. 6 A graph showing average bubble radius against contact angle for each IL. The line represents the correlation obtained using the eqn (5). | ||
However, as observed with the trends with viscosity, ILs with similar contact angles resulted in significantly different bubble sizes. For example [C4mim][TFA] and [C4mim][NTf2] have very similar contact angles (35.3 and 36.7°, respectively) but produce bubbles with an average size of 62.9 and 276.9 μm, respectively. This clearly demonstrates again that there are other factors apart from viscosity and contact angle that could affect the ILs mean bubble size distribution.
The relationship of mean bubble size against molecular weight (MW) is plotted in Fig. 7. In general, the lower the molecular weight of the IL the smaller the bubble size formed. This tendency may be represented by a straight line (R2 = 0.51) which follows the equation below:
| Mean bubble size = 0.7717·MW | (6) |
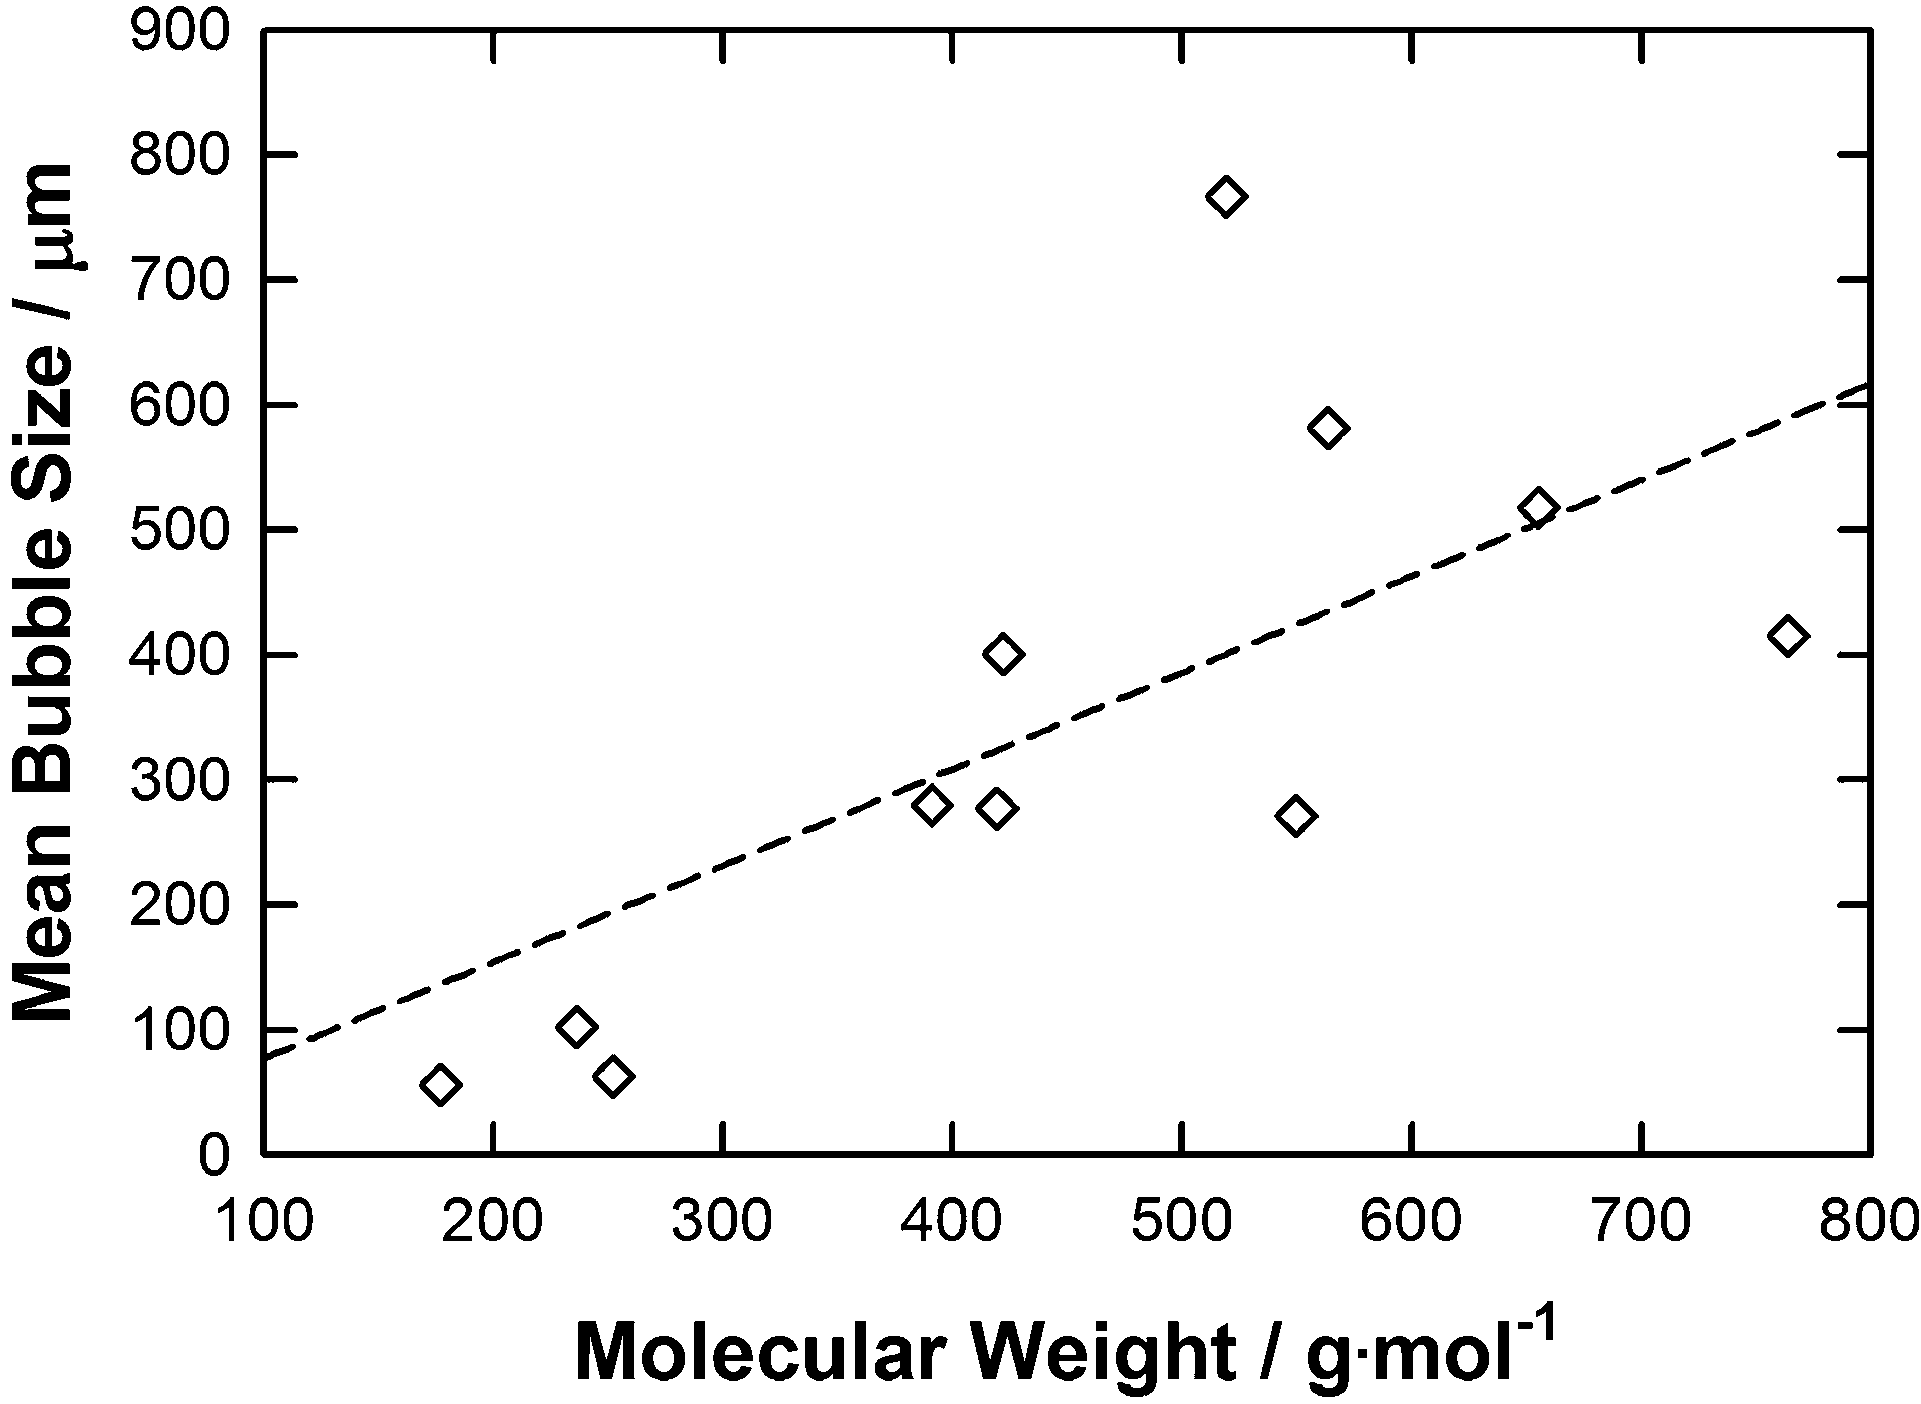 | ||
| Fig. 7 A graph showing average bubble radius against molecular weight for each IL. The line represents the correlation obtained using the eqn (6). | ||
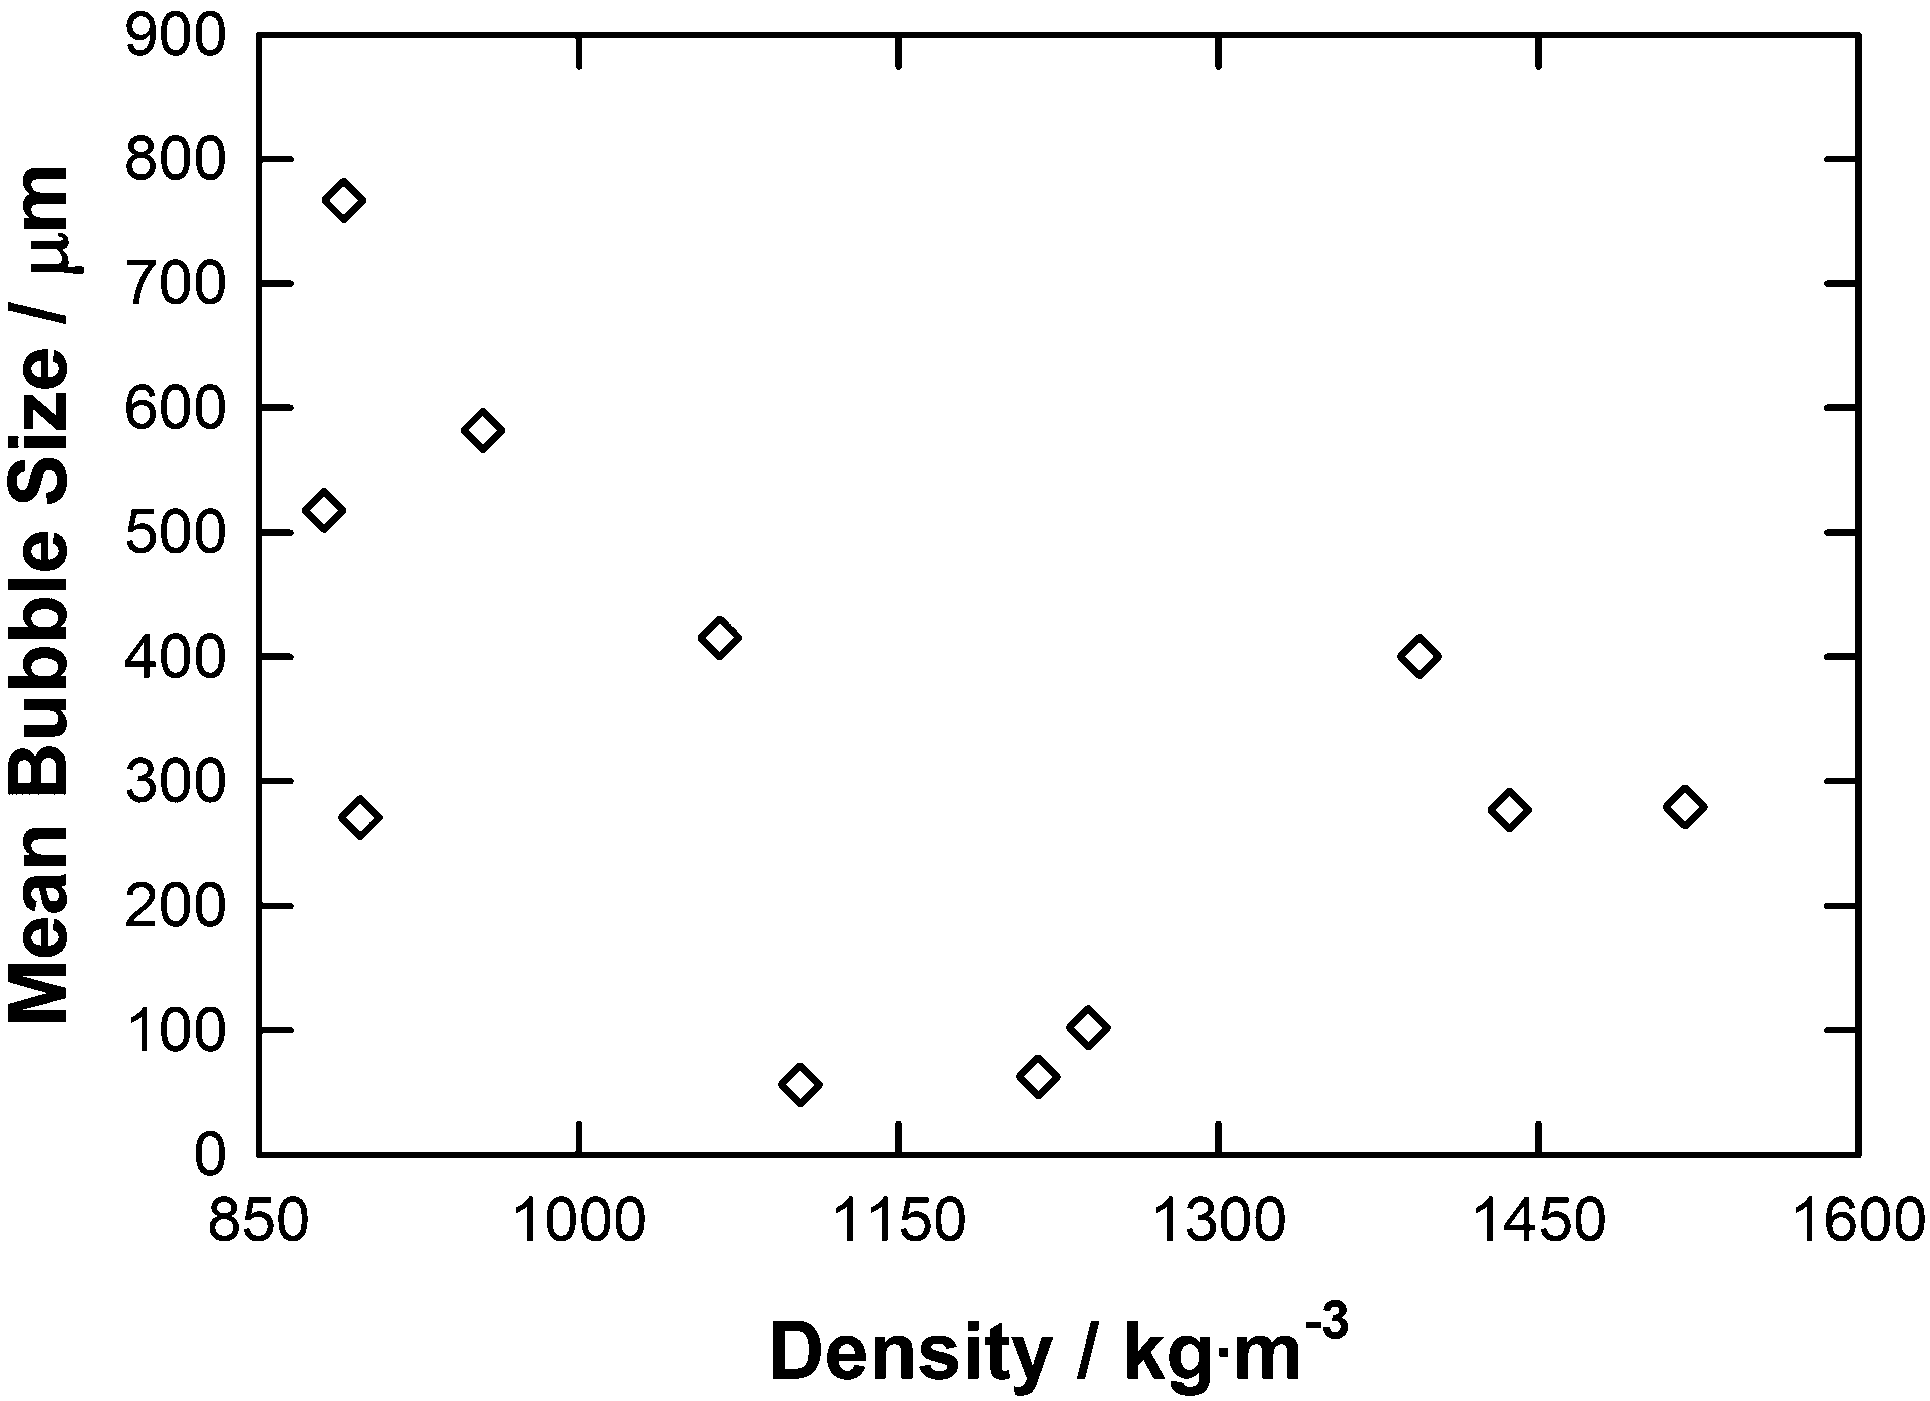 | ||
| Fig. 8 A graph showing average bubble radius against density for each IL. | ||
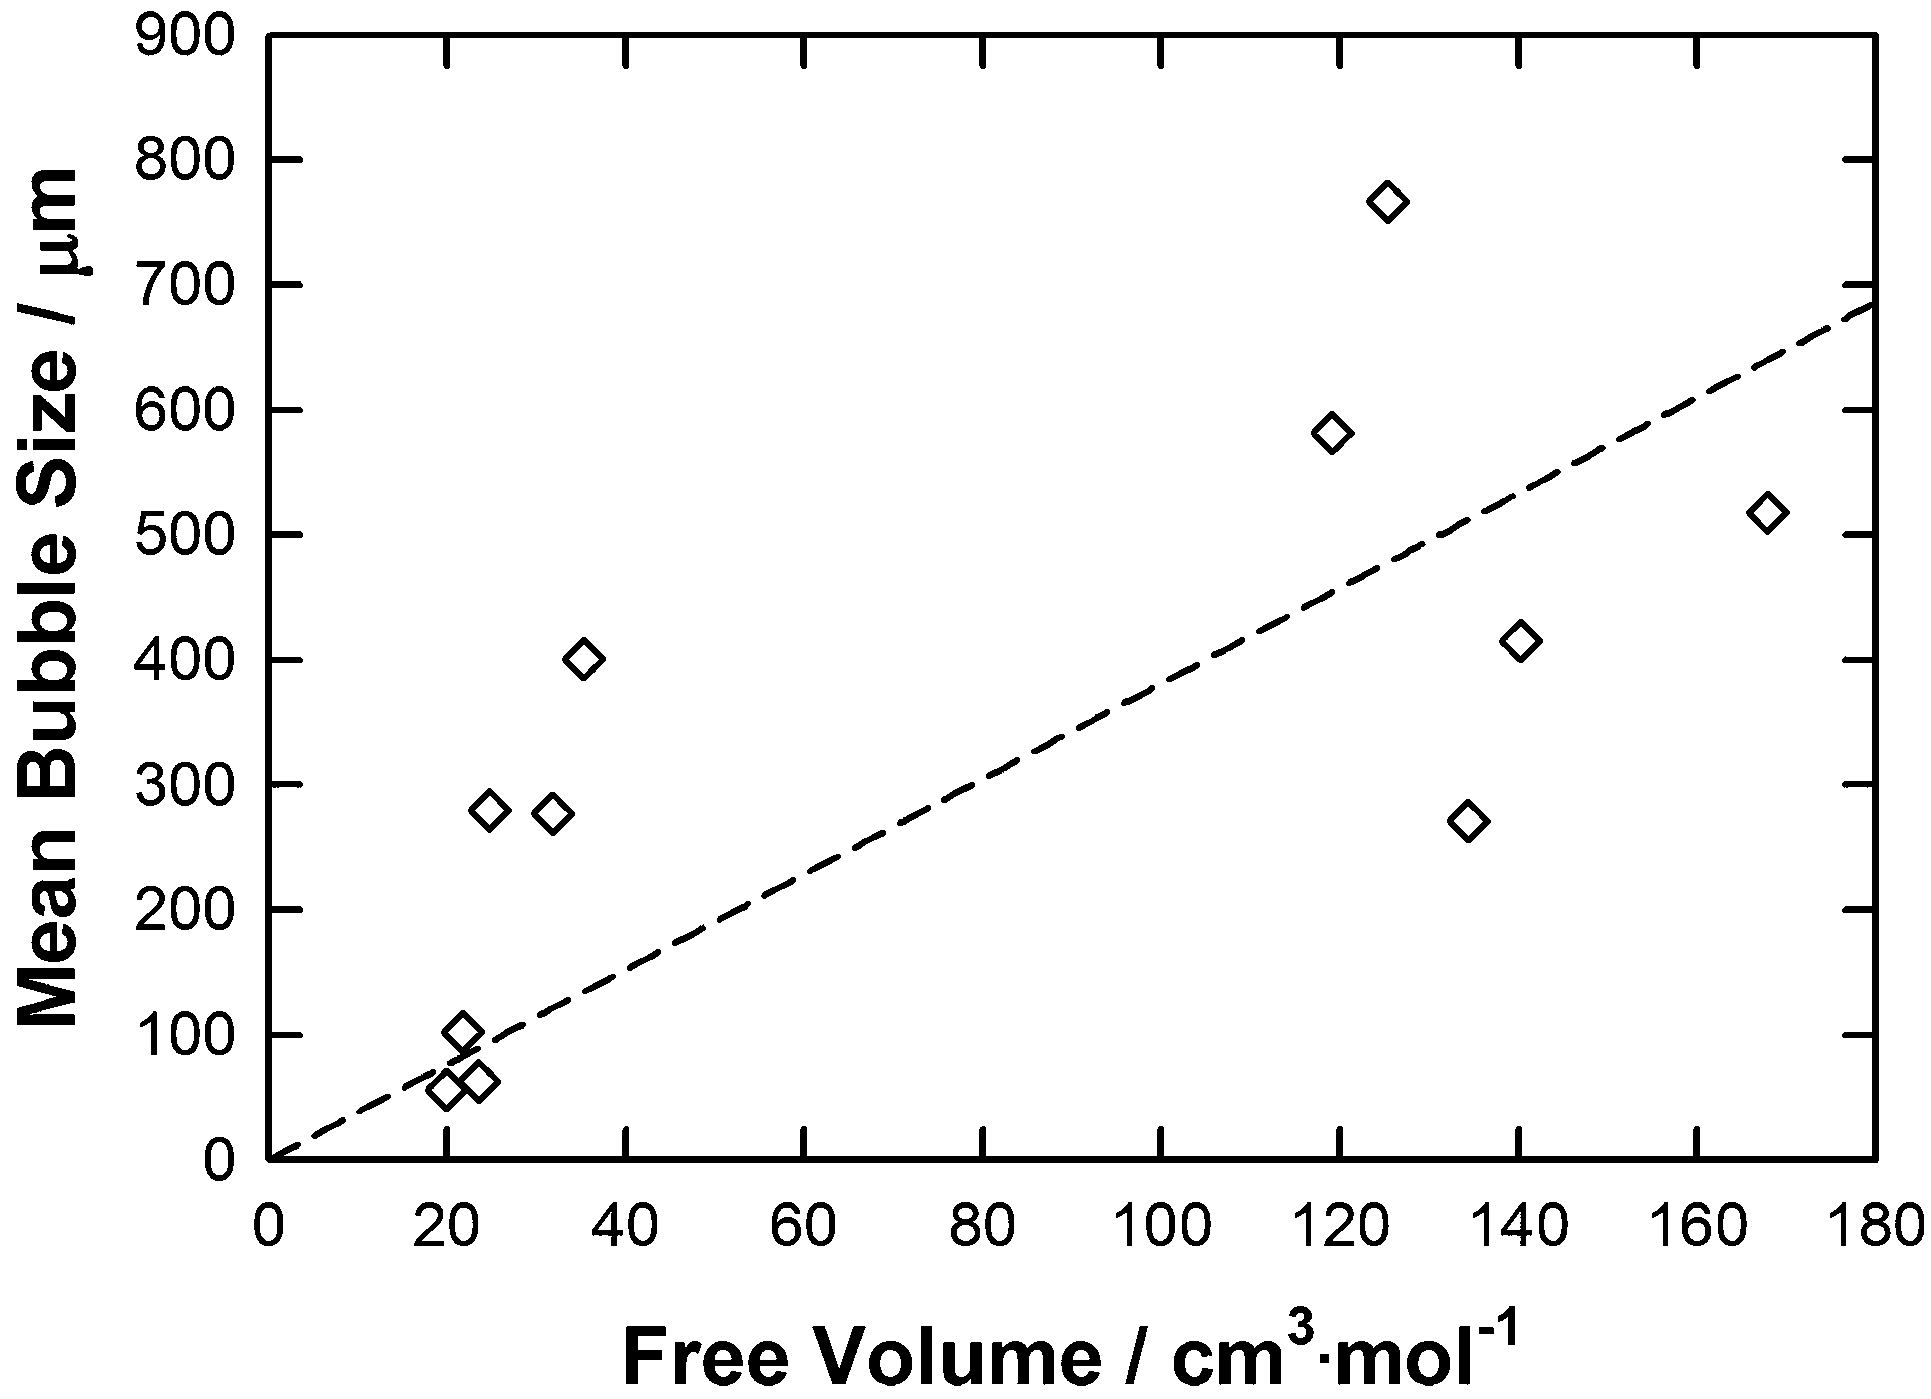 | ||
| Fig. 9 A graph showing average bubble radius against free volume for each IL. The line represents the correlation obtained using the eqn (7). | ||
To obtain the free volume, the total COSMO volume of each IL was calculated by the sum of the COSMO volumes of the anion and the cation directly determined by COSMOthermX. An estimation of each IL free volume (see Table 1) is then calculated by taking the difference between the calculated molar volume and the COSMO volume of the IL by following the same approach as that reported previously.27 As shown in Fig. 9 a general trend in bubble size as the function of the IL free volume is observed. As the free volume (fv) of the IL increases a larger average bubble size is observed. This overall trend was then fitted by a straight line (R2 = 0.38) which follows eqn (7):
| Mean bubble size = 3.8125·fv | (7) |
Whilst there is a general trend the correlation is poor and is only qualitative. For example, [P66614]Cl and [P66614][DCA] have similar molar volumes (583.6 and 612.6 cm3 mol−1, respectively) and free volumes (125.4 and 134.4 cm3 mol−1, respectively) but give very different average bubble sizes (766.9 and 270.9 μm, respectively). Correlation of the bubble size data to physico-chemical properties of each IL shows that no individual physical property is the determining factor and that a combination of the properties influences the results. However, notably contact angle and viscosity have the strongest correlation to the mean bubble size in ILs. To further analyse this behaviour, a simple QSPR was setup to correlate the mean bubble size as the function of these key properties as follows:
| Mean bubble size = a·η + b·γ + c·MW + d·fv | (8) |
| a | b | c | d |
|---|---|---|---|
| +125.6 | −1.749 | +0.8894 | −1.175 |
| Mean bubble radius (μm) | RADa | |||||
|---|---|---|---|---|---|---|
| Experimental | Correlated | (%) | ||||
| [C2mim][DCA] | 56.1 | 59.8 | 7 | |||
| [C4mim][TFA] | 62.9 | 144.6 | 130 | |||
| [C2mim][EtSO4] | 102.0 | 103.3 | 1.3 | |||
| [P66614][DCA] | 270.9 | 332.7 | 23 | |||
| [C4mim][NTf2] | 276.9 | 277.7 | 0.3 | |||
| [C2mim][NTf2] | 279.4 | 224.3 | 20 | |||
| [C4mpyr][NTf2] | 400.6 | 296.2 | 26 | |||
| [P66614][NTf2] | 415.4 | 520.5 | 25 | |||
| [P66614][Dec] | 517.7 | 412.3 | 20 | |||
| [P66614]Br | 582.1 | 699.1 | 20 | |||
| [P66614]Cl | 766.9 | 637.0 | 17 | |||
a Relative absolute deviation (RAD) calculated as follows:
|
||||||
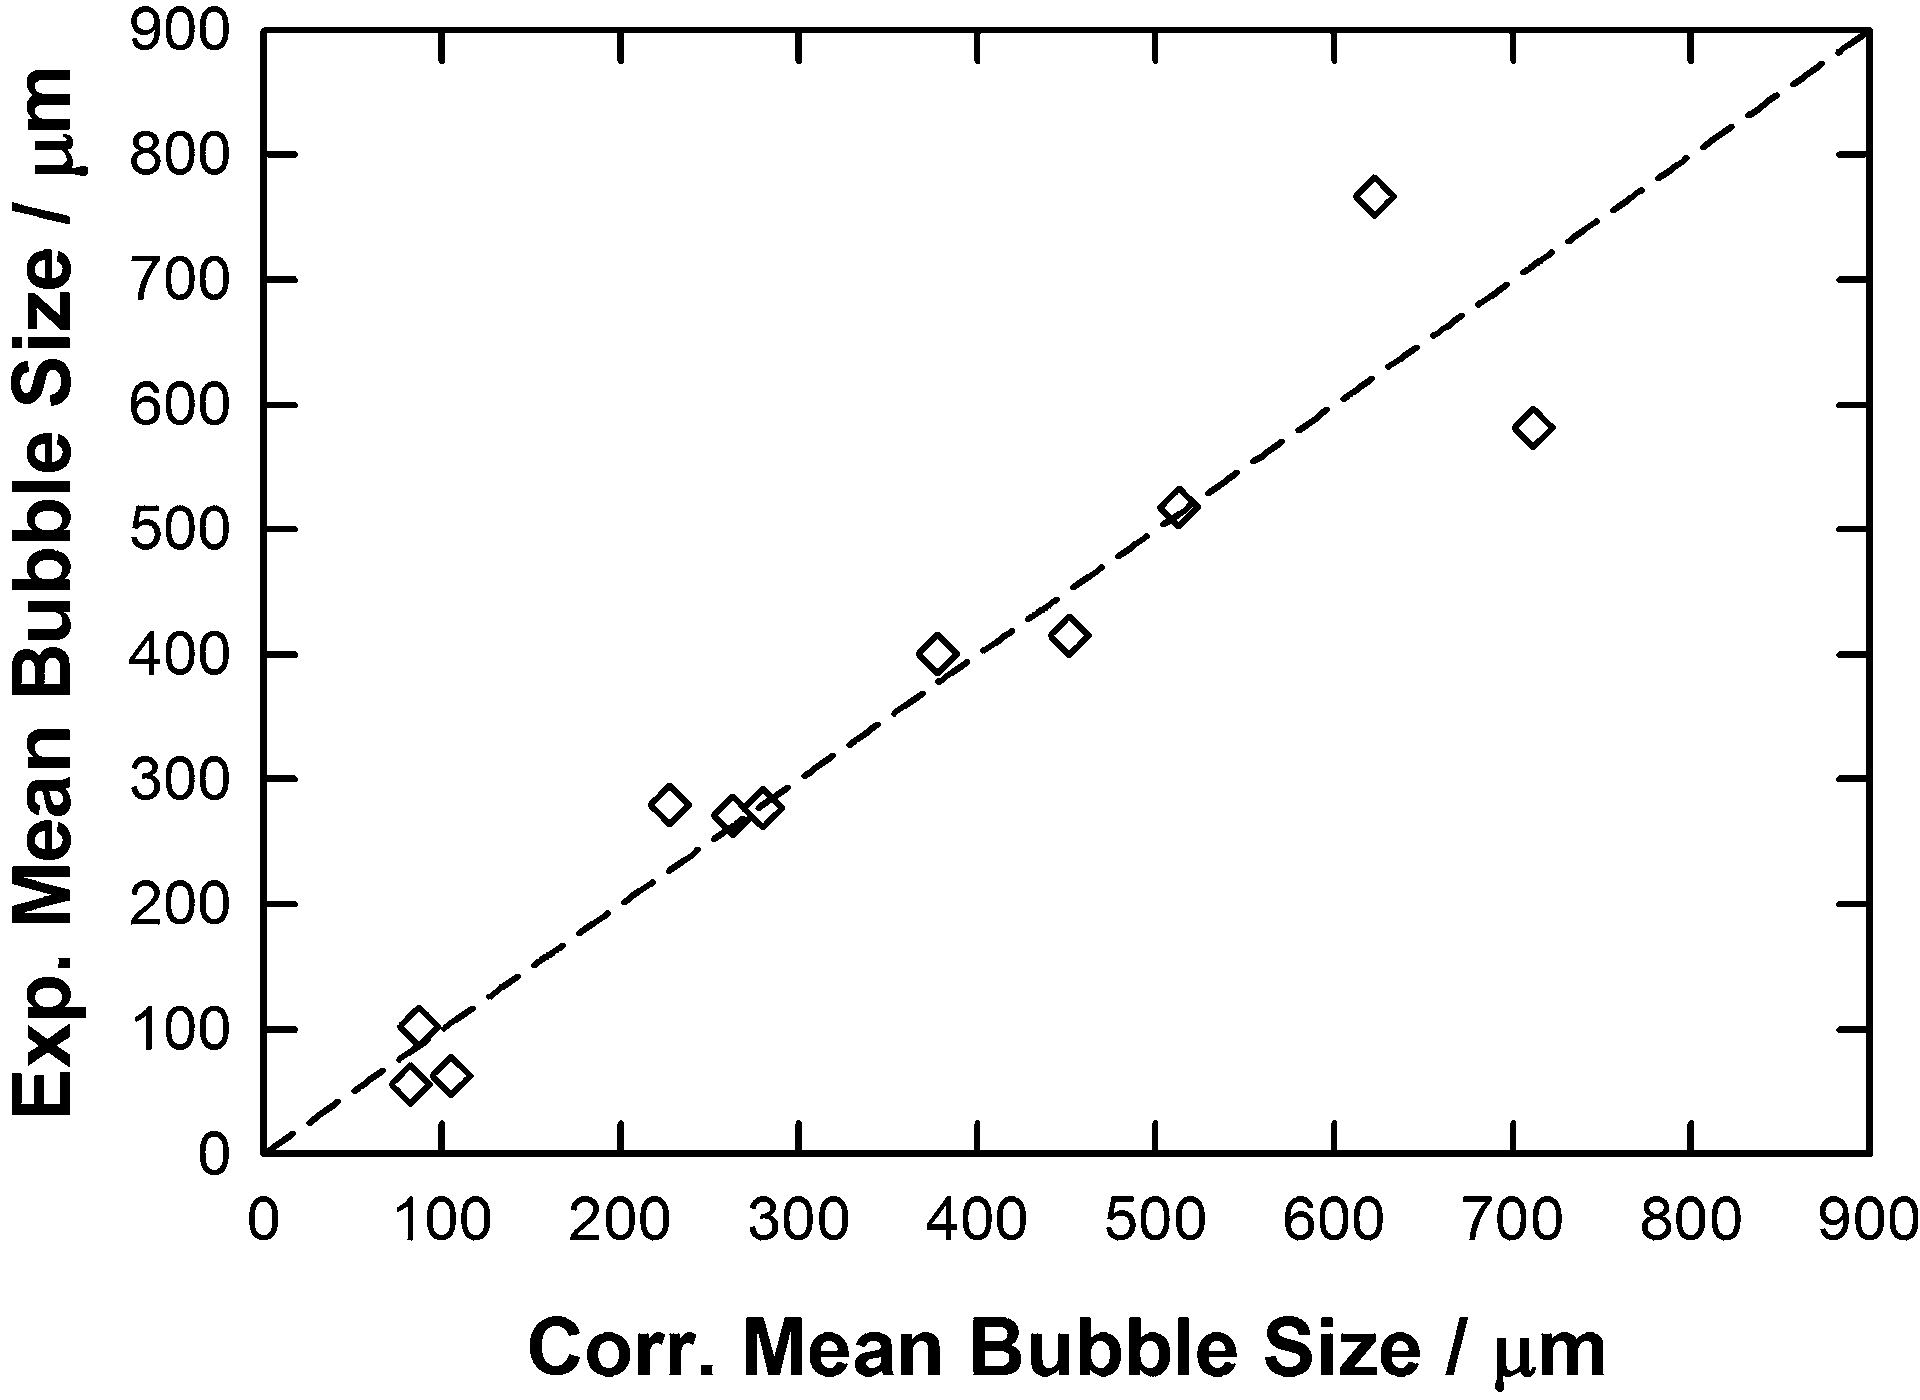
As reported in the eqn (8) the QSPR constant was set as equal to zero as it was assumed that no bubble could be formed in the absence of the IL. By following this methodology, a reasonably good QSPR correlation (equation y = x with a R2 = 0.85, RAAD = 26%) was found between these properties and the experimental mean bubble size data as shown in Fig. 10. This further demonstrates the impact of highlighted properties on the mean bubble size in selected ILs. As shown in Table 2 and as expected from Fig. 5 and 7, the molecular weight and the viscosity positively contribute to the size of the bubble in IL a contrario of the contact angle (expected from Fig. 6) and, more surprisingly, the free volume (unexpected from Fig. 9) as both properties have a negative QSPR fitting parameter (parameters b and d).
 | ||
| Fig. 10 Parity plot between the experimental and correlated mean bubble size using eqn (8) along with parameters reported in Table 2. | ||
A further analysis of the number of properties and fitting parameters was then conducted to verify the impact of each property on the QSPR performance. In this case, each of the parameters a, b, c and d was set to zero and the significance of its effect evaluated. As exemplified in Fig. S12 along with parameters and calculated data reported in Table S1 – ESI,† by neglecting the IL free volume (parameter d = 0 in eqn (8)) a poor QSPR correlation was found (y = 1.767x with a R2 = 0.53, RAAD = 53%), demonstrating the importance of this property on the QSPR correlation performance. This could be attributed to two main factors: (i) the free volume is a key property describing the mean bubble size in ILs; and/or (ii) the increase of the fitting parameters in eqn (8) enhances the QSPR correlation. However, differences observed from parity plots between experimental vs. calculated mean bubble size by excluding (Fig. S12, ESI,† slope = 1.767) or including (Fig. 10, slope = 1) the free volume into the QSPR correlation clearly show its impact on the slope of the straight line, and in fact on the quality of the QSPR correlation. However, even if a good correlation was observed by using all highlighted physical properties, by analysing data reported in Table 2, it appears that this QSPR is unable to provide the correct mean bubble size trend as the function of the IL structure as experimentally it was found that mean bubble size increases in the following order: [C2mim][DCA] < [C4mim][TFA] < [C2mim][EtSO4] < [P66614][DCA] ∼ [C4mim][NTf2] ∼ [C2mim][NTf2] < [C4mpyr][NTf2] ≤ [P66614][NTf2] < [P66614][Dec] < [P66614]Br < [P66614]Cl whereas the QSPR gives the following trend: [C2mim][DCA] < [C2mim][EtSO4] < [C4mim][TFA] < [C2mim][NTf2] < [C4mim][NTf2] < [C4mpyr][NTf2] < [P66614][DCA] < [P66614][Dec] < [P66614][NTf2] < [P66614]Cl < [P66614]Br together with a Relative Absolute Average Deviation (RAAD) close to 26%. Therefore, the ability for the bubbles to form in the IL was evaluated by examining the strength of the cation and anion interaction, as well as correlating the trends with respect to the shape of the distribution (Fig. S1–S11 – ESI†).
In order to provide some quantification of the interactions present, sigma profiles were calculated for each of the IL cations and anions and are summarised in Tables 3 and 4. Fig. S1–S3 (ESI†) show the bubble size distributions observed for [C2mim][DCA], [C2mim][EtSO4] and [C2mim][NTf2] respectively, in this data set the cation remains constant which shows the effect changing the anion. The mean bubble sizes observed for these three ILs are 56.1, 102.0 and 279.4 μm for [C2mim][DCA], [C2mim][EtSO4] and [C2mim][NTf2], respectively. This trend is also found for the width of the bubble size distribution with the ILs based on [DCA]− < [EtSO4]− < [NTf2]− as described by the standard deviation measuring 29.3, 52.3 and 69.7 μm, respectively. This quantitatively shows that as the standard deviation decreases the distributions become narrower. A similar trend is also found for the kurtosis values for [C2mim][DCA], [C2mim][EtSO4] and [C2mim][NTf2] with values of 5.03, 3.72 and 1.51, respectively, again confirming the order of the size of the distribution widths. These trends may reflect the strengthening of the anion–cation binding. [DCA]− is the smallest anion of the set (82.5478 Å3), its sigma surface shows the charge is mainly located on the three nitrogens within the molecule separated by the two carbons. The sigma profile shows two peaks one representing the polarization charge on the surface of the carbon between 0 and 0.01 e Å−2 and a larger second peak at 0.01–0.02 e Å−2 for the charge on the nitrogens. As expected, the sigma profile shows that all of the polarization charge is positive which results in a good interaction with the cation. The charge is localised at uniform places within the molecule and, therefore, has strong Coulombic and hydrogen bonding interactions, the latter with the ring hydrogens of the cation. A weaker interaction is found for [EtSO4]− due to its increased size (125.2487 Å3), its sigma surface shows that the charge is mainly located on the –OSO3− group and its sigma profile shows two peaks, one for the alkyl chain of the anion −0.005 to 0.01 e Å−2 and one for the OSO3− section at 0.01–0.02 e Å−2. The presence of the ethyl group suggests the contribution of the van der Waals interactions to the cohesive energy inducing weaker interaction between the [EtSO4]− and the [C2mim]+ than those expected with the [DCA]− anion, for example. The weakest interaction is observed for the [NTf2]− due to its larger volume (219.6735 Å3), its sigma surface shows that the charge is less concentrated and spread over a large area of the anion. The sigma profile shows a large region of the charge densities around zero which represents van der Waals type interactions (−0.01 and +0.01 e Å−2), therefore, there is a reduction in the interaction of the anion and cation due to the charge delocalisation and increased sterics. This trend shows that a stronger interaction between the ions leads to a more structured IL and results in a narrower bubble size distribution. Bubble size distributions for [C4mim][NTf2] and [C4mim][TFA] (Fig. S4 and S5, ESI†) are also consistent with this trend. On changing the anion from [NTf2]− to [TFA]− while maintaining [C4mim]+ as the cation, a decrease in the mean bubble size from 276.9 to 62.9 μm is observed which is in line with the stronger cation–anion interaction expected for ILs based on the smaller [TFA]− anion (95.7199 Å3) compared with the larger [NTf2]− anion (219.6735 Å3). The sigma profile for [TFA]− also shows two regions of charge for –CF3 (0 to 0.01 e Å−2) and –COO− (0.01 to 0.02 e Å−2). The small size of the molecule and the positive polarisation charge will result in good packing and strong interactions of cation and anion. [C4mim][TFA] and [C2mim][DCA] also have the smallest mean bubble sizes for all the ILs studied with the narrowest bubble size distribution and most uniform bubbles as illustrated by the two largest kurtosis values (8.56 and 5.03). Fig. S3, S4, S10 and S11 (ESI†) show the bubble size distributions observed for [C2mim][NTf2], [C4mim][NTf2], [P66614][NTf2] and [C4mpyr][NTf2], respectively, which shows the effect of changing the cation. The mean bubble sizes observed for [C2mim][NTf2], [C4mim][NTf2], [P66614][NTf2] and [C4mpyr][NTf2] are 279.4, 276.9, 400.6 and 415.4 μm respectively. Therefore, the mean bubble size trend is in the order [C2mim]+ ∼ [C4mim]+ < [C4mpyr]+ ≤ [P66614]+. The standard deviations values of [C2mim][NTf2], [C4mim][NTf2], [C4mpyr][NTf2] and [P66614][NTf2] are 69.7, 109.5, 205.6 and 168.7 μm, respectively. Comparable values are observed for [C2mim][NTf2] and [C4mim][NTf2] as the two cation structures are very similar. Table 3 shows similar COSMO volumes of 154.1699 Å3 and 155.7999 Å3 for [C2mim][NTf2] and [C4mim][NTf2], respectively. Furthermore, from their sigma surface it is seen that, in both cases, the positive charge is located on the carbon between the two nitrogens but also delocalised around the aromatic ring. Table 4 shows almost identical sigma profiles for the two imidazolium cations this is expected as previous reports have shown that non-polar domains are only observed for alkyl chain lengths above C4.39 Therefore, the cation–anion interaction will also be similar resulting in a similar average bubble size value and distributions. The increase in mean bubble size and standard deviation when [C4mim]+ is compared to [C4mpyr]+ is due to the increased size of [C4mpyr]+ (215.1805 Å3), a loss of the π–π interaction and a shift in the polarisation of the charge to indicate the presence of van der Waals interactions which results in a weaker interaction of the [NTf2]− with [C4mpyr]+ compared with [C4mim]+.
 |
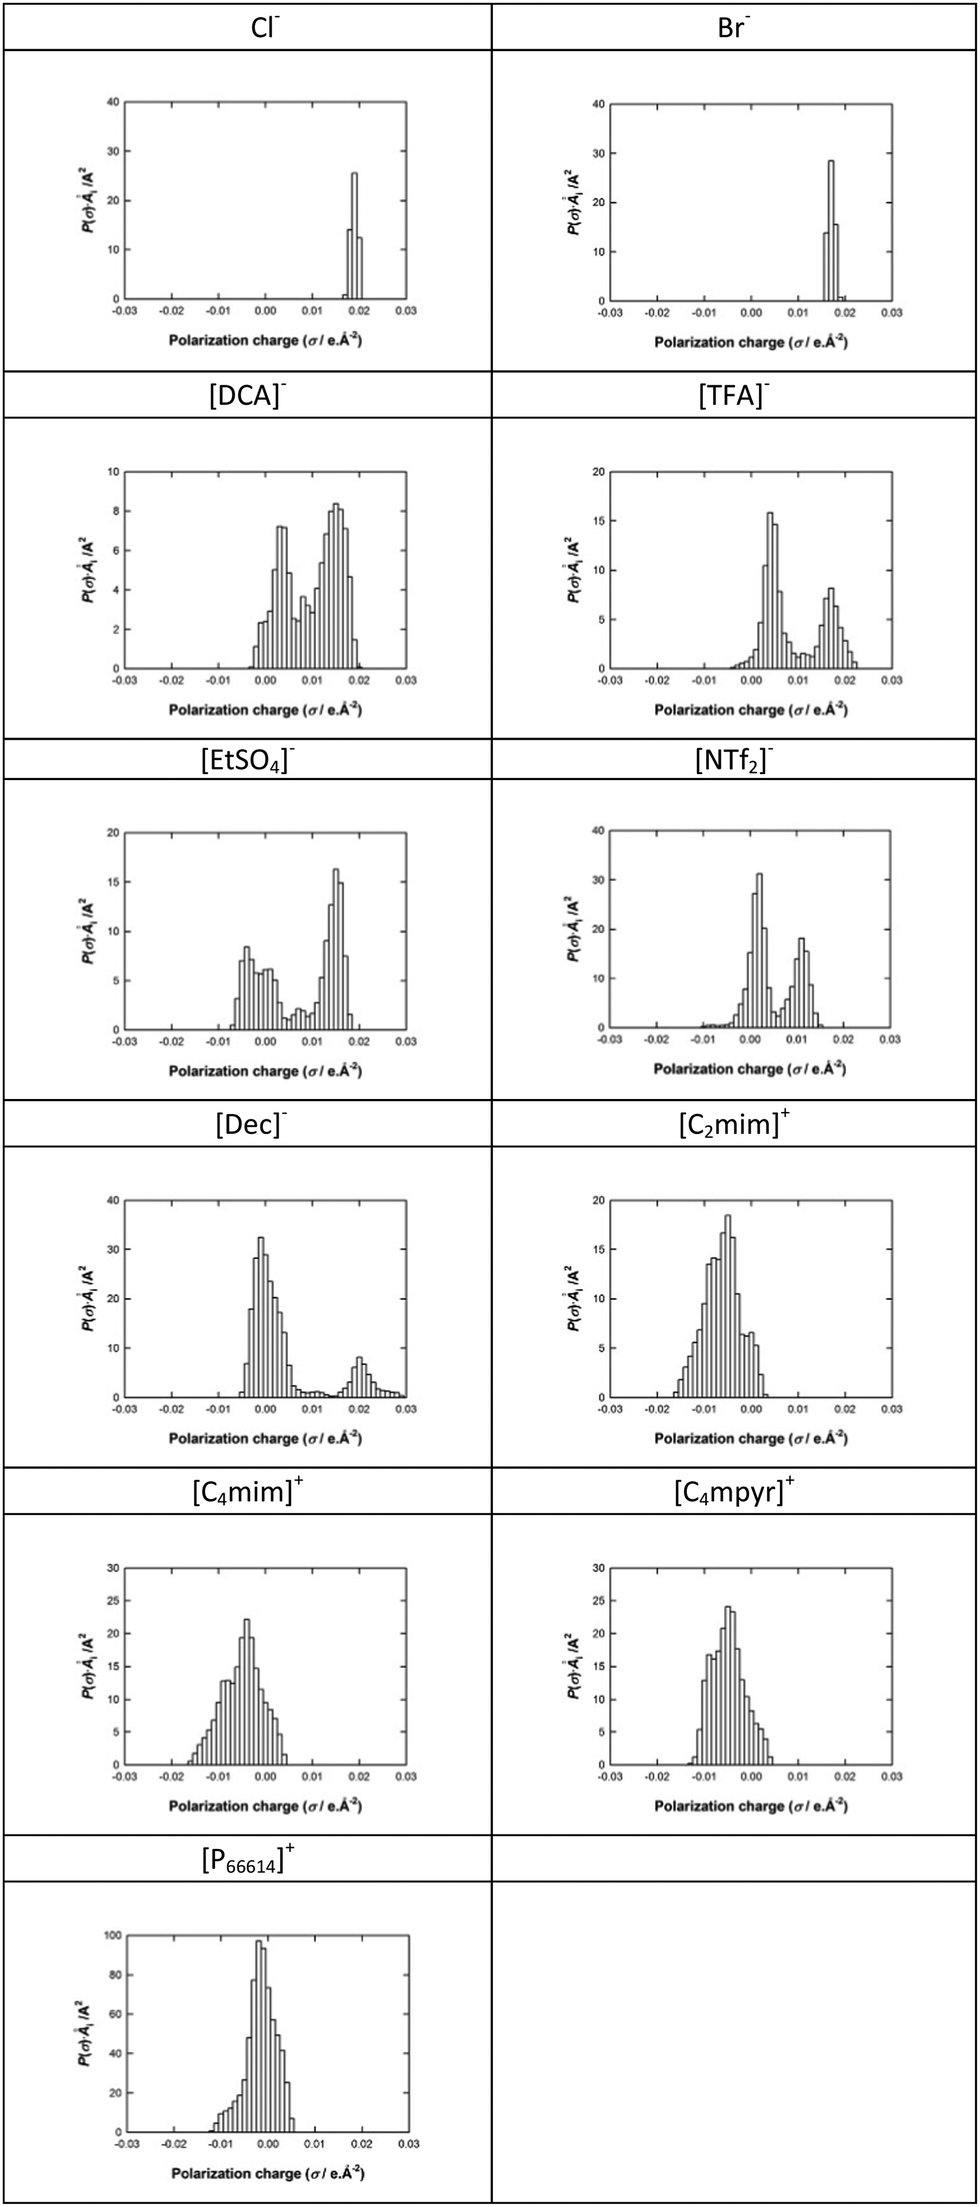 |
In the case of [P66614]+, a further increase in COSMO volume is observed (749.6190 Å3). The sigma surface (Table 3) shows localisation of the positive charge around the phosphorous and the sigma profile (Table 4) shows a larger proportion of the charge density is shifted to positive charge polarisation which is representative of the bulky alkyl groups and resulting van der Waals forces. The weak interaction of the bulky alkyl groups and the large size of the cation results in the larger mean bubble size and wide bubble size distribution. The kurtosis values measured for [C2mim][NTf2] and [P66614][NTf2], are 1.51, and 0.44, respectively, further outlining the reduction in the interaction of the ions when the cation is changed from [C2mim]+ to [P66614]+. It should be noted that the kurtosis values calculated for [C4mim][NTf2] and [C4mpyr][NTf2] do not represent the data correctly due to the presence of a bimodal distribution.
Fig. S6–S10 (ESI†) show the bubble size distributions observed for [P66614]Br, [P66614]Cl, [P66614][DCA], [P66614][Dec] and [P66614][NTf2], respectively. The mean bubble sizes measured for [P66614]Br, [P66614]Cl, [P66614][DCA], [P66614][Dec] and [P66614][NTf2] are 582.1, 766.9, 270.9, 517.7 and 415.4 μm, respectively. It is clear that the bubbles created in the [P66614]+, paired with the various anions, are much larger than found for all the others ILs tested. Considering these five [P66614]+-based ILs, the effect of changing the anion paired with [P66614]+ on the bubble size and distribution is shown. The mean bubble size trend is in the order [DCA]− < [NTf2]− < [Dec]− < Br− < Cl−. The standard deviation of [P66614]Br, [P66614]Cl, [P66614][DCA], [P66614][Dec] and [P66614][NTf2] bubble size distributions are 334.6, 349.7, 109.6, 150.3, and 168.7 μm, respectively. The corresponding kurtosis values for [P66614]Br, [P66614]Cl, [P66614][DCA], [P66614][Dec] and [P66614][NTf2] are −0.64, −0.014, 0.1, 1.79 and 0.44, respectively. These values highlight that significantly narrower distributions are found for [P66614][Dec], [P66614][NTf2] and [P66614][DCA] whereas a flat distribution is found for [P66614]Cl and [P66614]Br. In this case the increase in bubble size distribution for [P66614][DCA], and [P66614][NTf2] and [P66614][Dec] follows the trend shown previously for [DCA]− and [NTf2]− based ILs. [Dec]− is the anion with the largest volume (247.3144 Å3) within the study, its sigma surface (Table 3) shows localisation of the charge on the acetate group with a long chain alkyl group attached. The [Dec]− sigma profile (Table 4) has two maxima of the charge density for the –COO− at 0.02 e Å−2 reflecting the highly localised negative charge of this anion, and a region around 0 e Å−2 which is representative of the van der Waals interactions due to the alkyl chain. The larger size of the [Dec]− anion and the reduced interaction with the [P66614]+ cation results in the large mean bubble size observed. In the case of [P66614]Br and [P66614]Cl, the anion will be very strongly bonded to the cation, due to the spherical charge on the halide anion and, therefore, it may have been expected that these ILs would result in a narrow distribution due to a very strong interaction between the cation and anion. The higher hypothetical mean bubble size observed in the case of the Cl−-based sample may be attributed to its higher hydrogen bonding ability compared to Br− anion. However, the standard deviation values for [P66614]Br and [P66614]Cl are much larger than the other three ILs in this data set. These results would suggest these two anions are having little effect on the bubble size distribution as they are so strongly bonded to the cation. Their sigma profiles (Table 4) support this observation with only one region of charge density around 0.02 e Å−2 for both halide anions. The large mean bubble sizes and wide distribution observed can be explained by cation–cation interaction that is dominated by van der Waals forces from the alkyl chains on the tetraalkyl phosphonium cation and not by the Coulombic interactions. For the strongly bound halide, the anion does not influence the structure significantly whereas for the bulkier, weaker Coulombic interactions some interaction/influence on the alkyl chain structure is present which changes the bubble size. It is, however, important to note that these ILs are still dominated by the van de Waals interactions and all have large bubble sizes, in general.
These interactions influence the physico-chemical properties. For example, the movement of the anion and cations relative to each other determines the stress required to translate the liquid and this determines the viscosity measured. This also affects the bubble size by changing the resistance to bubble growth. With more structured liquids the energetics of increasing the bubble size and lowering the surface potential of the bubble cannot overcome the energy required to disrupt the structure, therefore, limiting the size observed. As the structure becomes less ordered and the interactions are weaker, the bubbles can grow leading to the larger bubble sizes. The lack of a correlation with the density and free volume as shown in Fig. 8 and 9 indicates that the bubbles are not strongly dependent on the void space within the IL which is at molecular level but rather the structural changes/strain which occur over longer distances. This is as expected given the relative size of the bubbles formed and the void space within the IL. To assess the ability of sigma profiles to describe the mean bubble size distribution of the selected ILs, a second QSPR approach was developed by splitting the polarization charge into 6 regions (region 1: from −0.030 to −0.021 e Å−2; region 2: from −0.020 to −0.011 e Å−2; region 3: from −0.010 to 0 e Å−2; region 4: from 0 to 0.010 e Å−2; region 5: from 0.011 to 0.020 e Å−2 and region 6: from 0.021 to 0.030 e Å−2) by calculating the overall populations of charge present on the surface of each ion for each of them. For each region, the overall population of charge of the selected ILs was then determined as the sum of the charges found for its anion and cation as reported in Table S2 – ESI.† Then, the following equation was used to set the QSPR model:
| Mean bubble size = e·region 2 + f·region 3 + g·region 4 + h·region 5 + i·region 6 | (10) |
| Mean bubble radius (μm) | RADa | ||
|---|---|---|---|
| Experimental | Correlated | (%) | |
| [C2mim][DCA] | 56.1 | 136.6 | 143 |
| [C4mim][TFA] | 62.9 | 124.8 | 98 |
| [C2mim][EtSO4] | 102.0 | 194.4 | 91 |
| [P66614][DCA] | 270.9 | 523.2 | 93 |
| [C4mim][NTf2] | 276.9 | 186.0 | 33 |
| [C2mim][NTf2] | 279.4 | 164.4 | 41 |
| [C4mpyr][NTf2] | 400.6 | 272.4 | 32 |
| [P66614][NTf2] | 415.4 | 551.1 | 33 |
| [P66614][Dec] | 517.7 | 510.7 | 1.4 |
| [P66614]Br | 582.1 | 513.5 | 12 |
| [P66614]Cl | 766.9 | 498.1 | 35 |
From the sigma profiles reported in Table 4, it appears that, for all investigated ions no population of charge was found in region 1, explaining why this descriptor was neglected in eqn (10). By regressing the experimental mean bubble size distribution using eqn (10) qualitative correlation (y = x, R2 = 0.58, RAAD = 56%) was found as shown in Fig. 11 and Table 5 which reflects the importance of hydrogen bonding acceptor (region 2) and donor sites (region 6) to form smaller bubbles in the ILs.
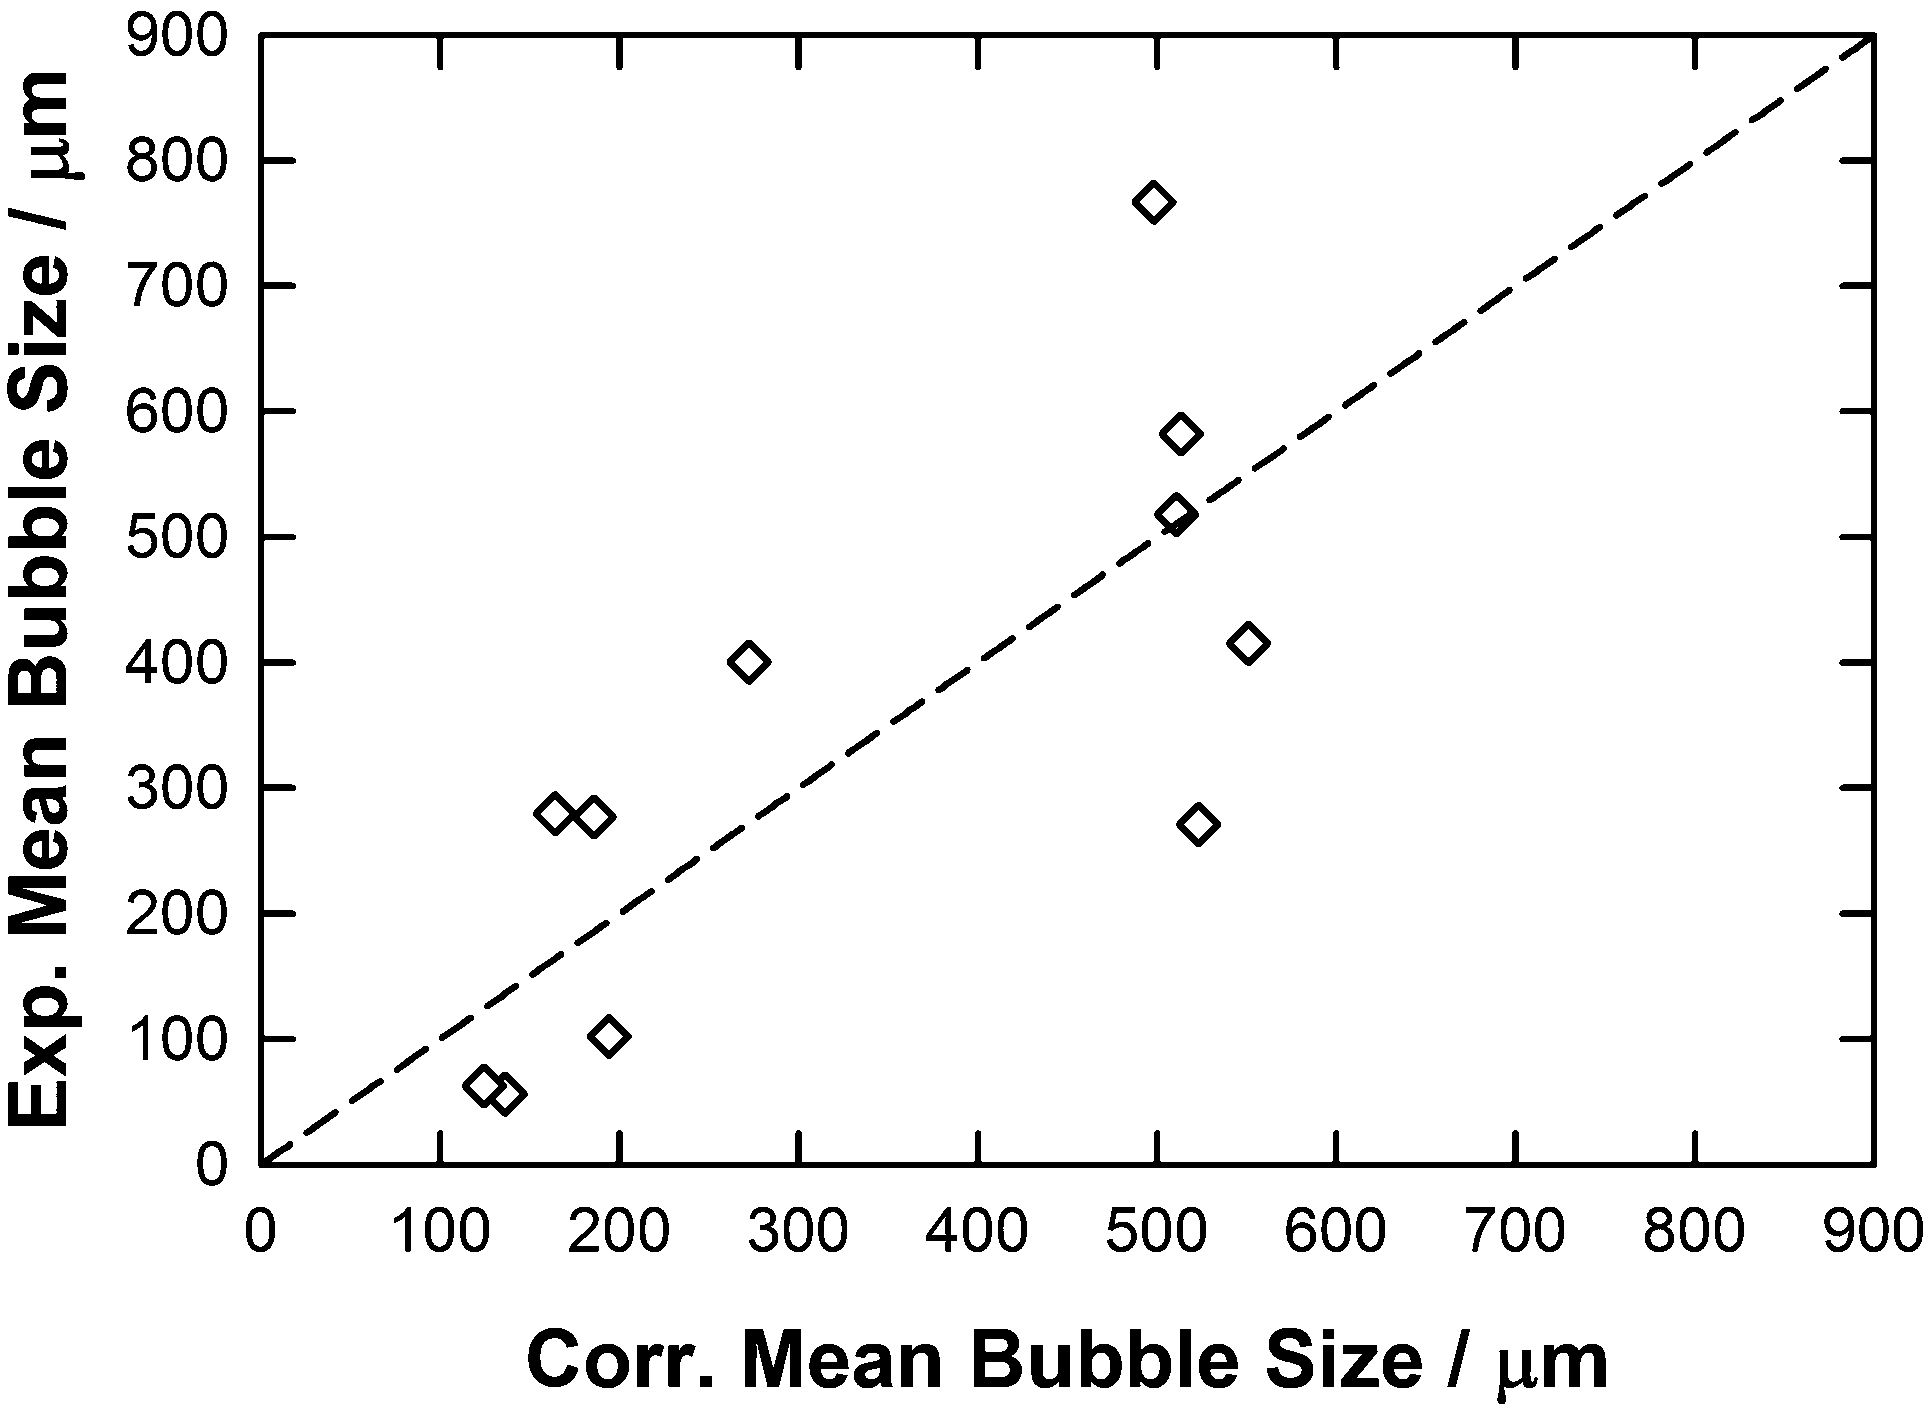 | ||
| Fig. 11 Parity plot between the experimental and correlated mean bubble size using eqn (10) together with the parameters reported in Table 5. | ||
However, even if the number of fitting parameters increases by using this second QSPR method rather than initial one (eqn (8)), a lower RAAD was in fact observed (56% compared with 26%). Furthermore, as also observed using the eqn (8) the wrong variation of the mean bubble size with the respect to ILs structure was observed using this second approach as the correlation reveals that the mean bubble size increases in the following order: [C4mim][TFA] < [C2mim][DCA] < [C2mim][NTf2] < [C4mim][NTf2] < [C2mim][EtSO4] < [C4mpyr][NTf2] < [P66614]Cl < [P66614][Dec] < [P66614]Br < [P66614][DCA] < [P66614][NTf2].
In the light of this analysis, a third approach was then examined by combining eqn (8) and (10) and assessing the impact of each descriptor on the QSPR performance. This analysis is shown in Fig. 12 and Fig. S13, S14 (ESI†) along with the comparison of experimental vs. correlated data in each case as reported in Table 6 and Tables S3, S4 (ESI†). Using this approach, a good correlation was achieved by using all descriptors reported in eqn (8) and (10) (see Fig. S13 and Table S3, ESI,†y = x, R2 = 0.91, RAAD = 21%) although the mean bubble sizes in the [C2mim][DCA] and in [P66614]Cl were overestimated affecting the overall mean bubble size order with the respect to ILs structure. As shown in Fig. S14 and depicted in Table S4 (ESI†), a similar result and conclusion were observed by neglecting the free volume in this QSPR approach (y = x, R2 = 0.91, RAAD = 22%) showing that this property could be neglected without affecting the correlation performance. Surprisingly, by neglecting both free volume and molecular weight descriptors in the combined QSPR using both eqn (8) and (10), a better correlation was found (y = x, R2 = 0.91, RAAD = 19%) as shown in Fig. 12 and Table 6. More interestingly, in contrast to what has been observed for the two first reported QSPR approaches, the variation of the mean bubble size with the respect to ILs structure is more correctly evaluated by using this third approach as the mean bubble size follows this order: [C2mim][DCA] < [C2mim][EtSO4] < [C4mim][TFA] < [C2mim][NTf2] < [P66614][DCA] < [C4mim][NTf2] < [C4mpyr][NTf2] < [P66614][NTf2] < [P66614][Dec] < [P66614]Cl < [P66614]Br. Even if this approach is unable to evaluate correctly the lower bubble size in the [P66614][DCA] than in [C4mim][NTf2] nor the correct trend for investigated halide-based ILs, the combination of ILs sigma profiles, viscosity and contact angle provides a more quantitative correlation than the approaches reported previously.
 | ||
| Fig. 12 Parity plot between the experimental and correlated mean bubble size by combining eqn (8) and (10) along with parameters reported in Table 6. | ||
| e | f | g | h | i |
|---|---|---|---|---|
| −10.26 | −2.956 | +3.865 | +11.33 | +27.75 |
| Mean bubble radius (μm) | RADa | ||
|---|---|---|---|
| Experimental | Correlated | (%) | |
| [C2mim][DCA] | 56.1 | 82.6 | 47 |
| [C4mim][TFA] | 62.9 | 105.0 | 67 |
| [C2mim][EtSO4] | 102.0 | 87.4 | 14 |
| [P66614][DCA] | 270.9 | 263.1 | 2.9 |
| [C4mim][NTf2] | 276.9 | 279.8 | 1.1 |
| [C2mim][NTf2] | 279.4 | 227.5 | 19 |
| [C4mpyr][NTf2] | 400.6 | 377.9 | 5.7 |
| [P66614][NTf2] | 415.4 | 451.6 | 8.7 |
| [P66614][Dec] | 517.7 | 512.9 | 0.9 |
| [P66614]Br | 582.1 | 711.6 | 22 |
| [P66614]Cl | 766.9 | 622.9 | 19 |
As claimed by Klamt et al.23,40,41 and demonstrated by several authors,42,43 QSPR models could be developed by using solely sigma moments, which are directly determined by the COSMOthermX software. In this case, a given property (P) could be correlated by multilinear regression of the sigma moments as follows:
| P = C0·AX + C1·MX1 + C2·MX2 + C3·MX3 + C4·MX4 + C5·MX5 + C6·MX6 + C7·MXHBacc1 + C8·MXHBacc2 + C9·MXHBacc3 + C10·MXHBacc4 + C11·MXHBdon1 + C12·MXHBdon2 + C13·XHBdon3 + C14·MXHBdon4 + C15 | (11) |
According to Klamt et al.,23 the molecular surface area AX, the second and third sigma moments MX2 (i.e. electrostatic interaction energy) and MX3 (i.e. the kind of skewness of the sigma profile), as well as, the third hydrogen bonding acceptor and donor moments MXHBacc3 (i.e. representing the hydrogen bond acidity) and MXHBdon3 (i.e. representing the hydrogen bond basicity) are the five most significant descriptors to be used for sigma moment QSPR applications. These five parameters were in fact used by default during our parametrisation by keeping the constant as equal to zero for the same reason as stated above. Eqn (11) was then set to minimise the number of descriptors to provide the best correlation performance.
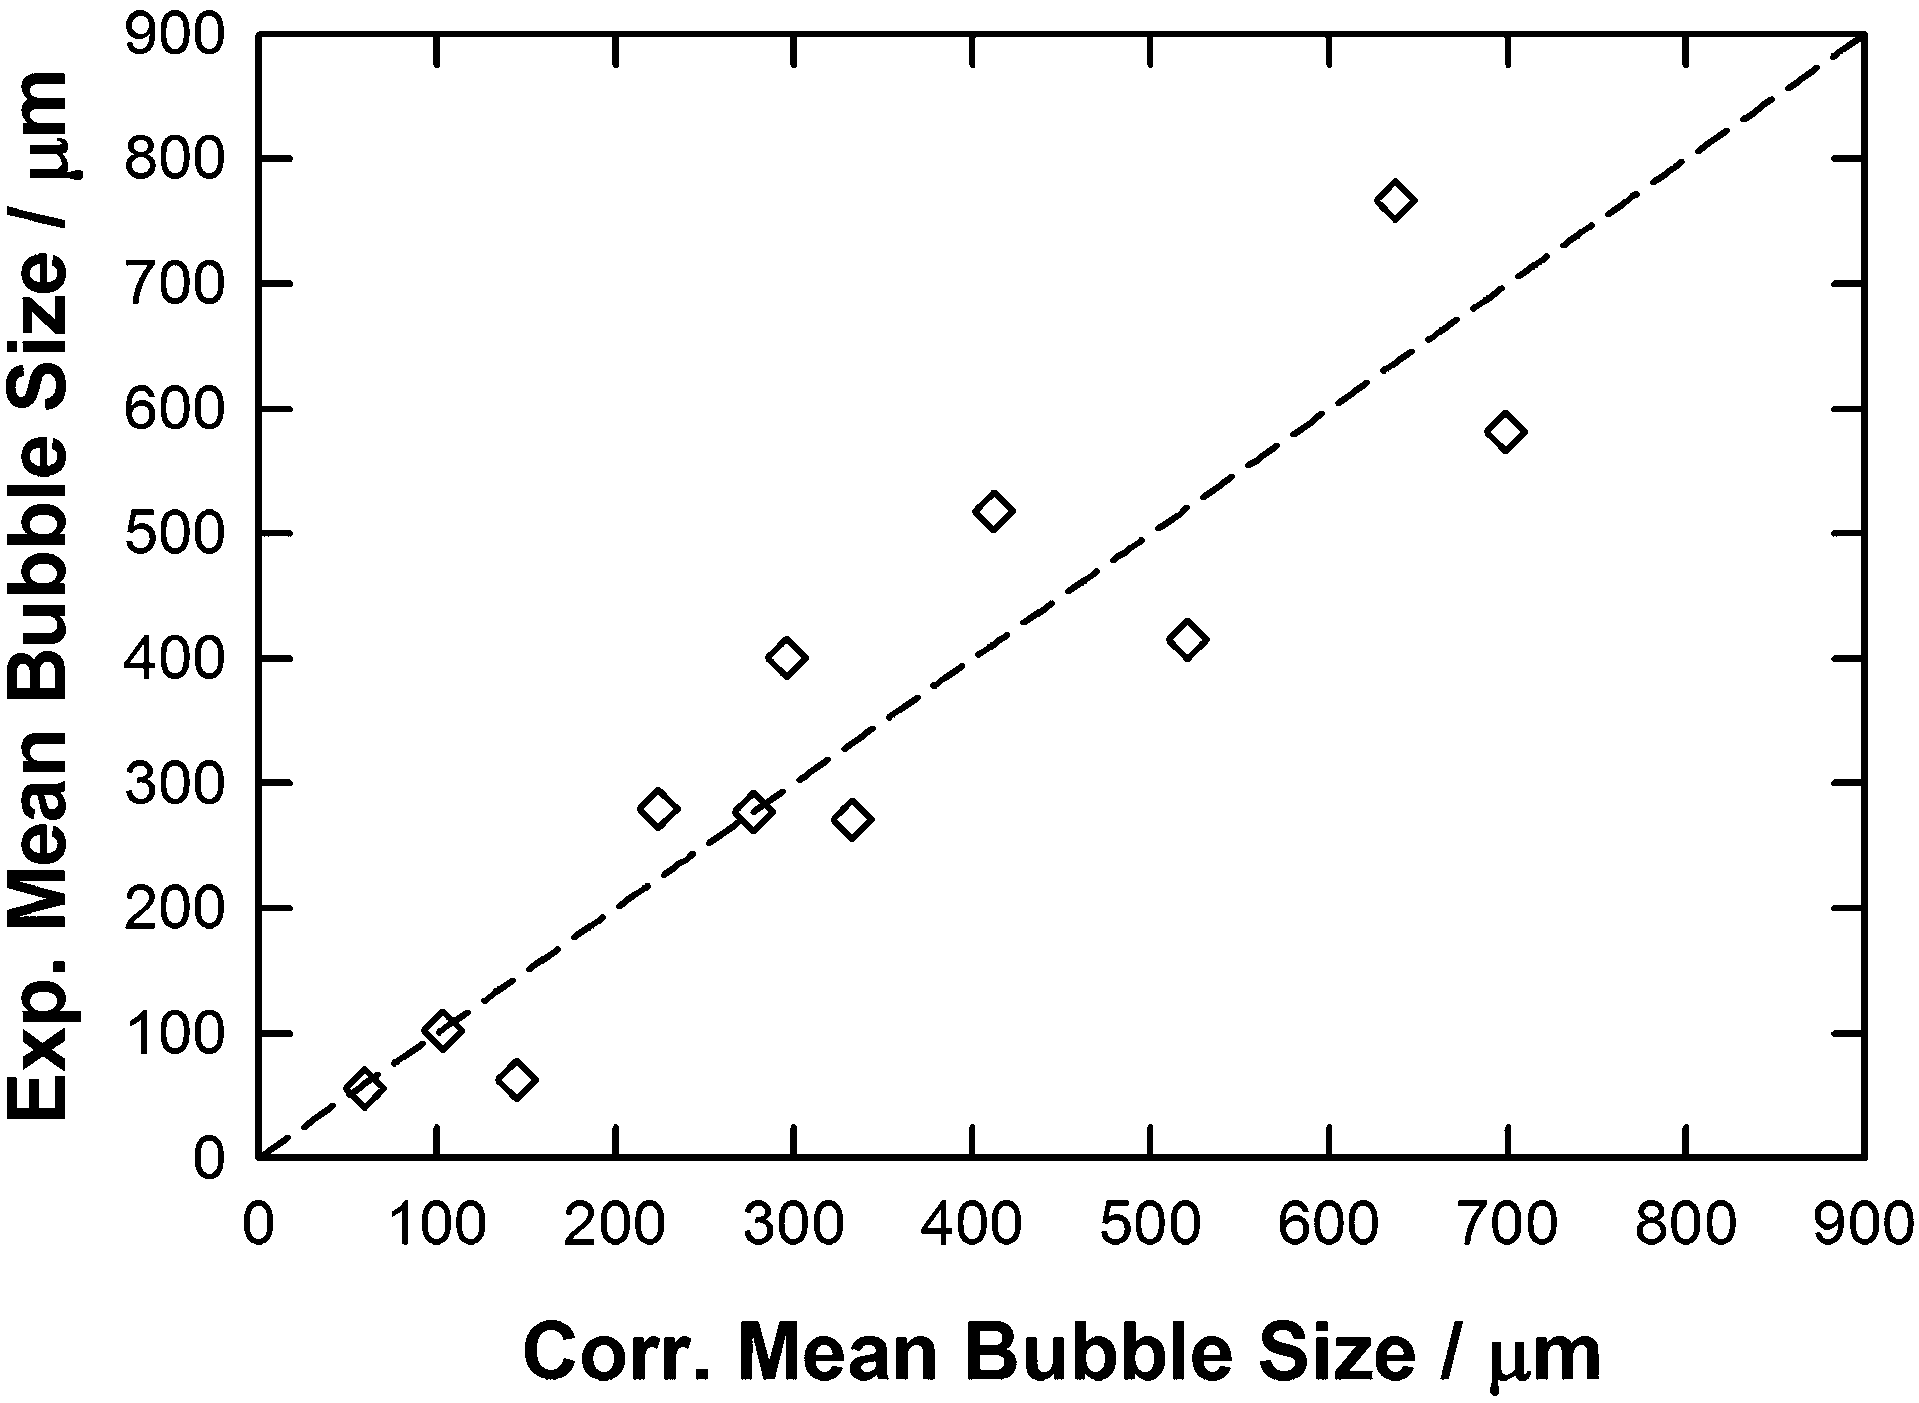
In the light of this multilinear regression analysis of our experimental data, this COSMO moment approach, using only the number of parameters representative of the structure of the IL, provides the best correlation, as shown in Fig. 13 and Table 7, with y = x, R2 = 0.98 and RAAD = 13%:
| Mean bubble size = C0·AX + C2·MX2 + C3·MX3 + C4·MX4 + C7·MXHBacc1 + C9·MXHBacc3 + C11·MXHBdon1 + C14·MXHBdon4 | (12) |
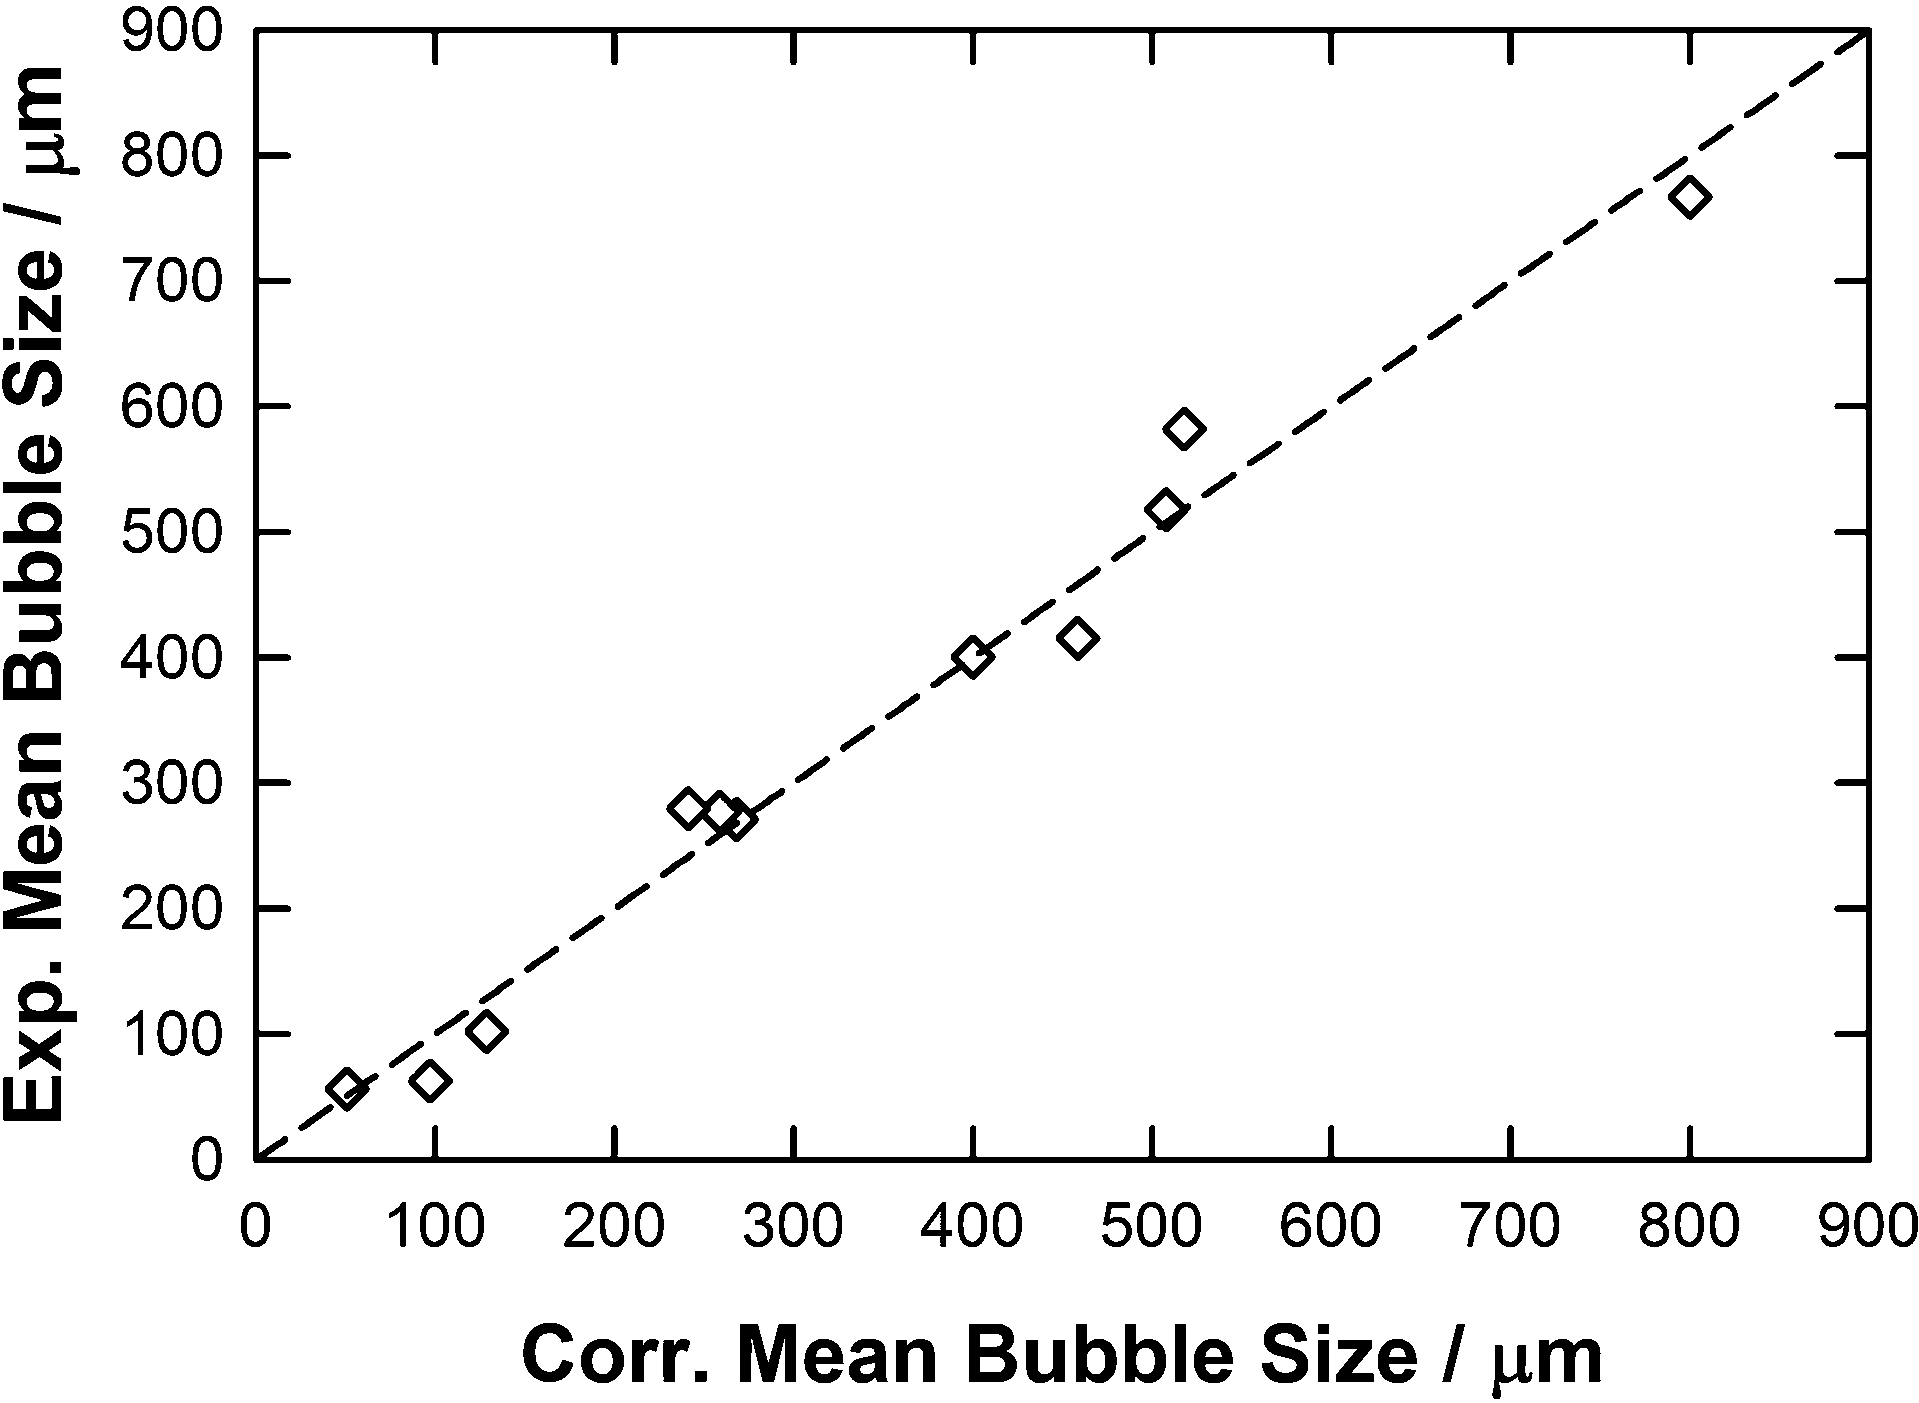 | ||
| Fig. 13 Parity plot between the experimental and correlated mean bubble size by using eqn (12) along with parameters reported in Table 7. | ||
| C 7 | C 9 | C 11 | C 14 |
|---|---|---|---|
| −22542 | +136.27 | +75645 | +2307.8 |
| Mean bubble radius (μm) | RADa | ||
|---|---|---|---|
| Experimental | Correlated | (%) | |
| [C2mim][DCA] | 56.1 | 50.9 | 9.2 |
| [C4mim][TFA] | 62.9 | 97.3 | 55 |
| [C2mim][EtSO4] | 102.0 | 128.7 | 26 |
| [P66614][DCA] | 270.9 | 268.1 | 1.0 |
| [C4mim][NTf2] | 276.9 | 258.9 | 6.5 |
| [C2mim][NTf2] | 279.4 | 241.6 | 14 |
| [C4mpyr][NTf2] | 400.6 | 400.1 | 0.1 |
| [P66614][NTf2] | 415.4 | 458.8 | 10 |
| [P66614][Dec] | 517.7 | 507.8 | 1.9 |
| [P66614]Br | 582.1 | 518.1 | 11 |
| [P66614]Cl | 766.9 | 800.0 | 4.3 |
Conclusions
Average bubble size and bubble size distributions have been reported for 11 ILs with various cation ([P66614]+, [C2mim]+, [C4mim]+ and [C4mpyr]+) and anion (Br−, Cl−, [DCA]−, [TFA]−, [EtSO4]−, [Dec]− and [NTf2]−) combinations. Correlation of the bubble size data to the physico-chemical properties of each IL showed only general, qualitative trends with poor correlations. It was, therefore, concluded that no individual physical property was the determining factor. However, it was noted that the strongest correlations were observed with contact angle and viscosity. A QSPR-based model approach was also used to investigate these key properties but was unable to provide a strong correlation or reproduce the experimental trend observed. Therefore, QSPR models were used to relate the strength of the anion and cation interaction (as described by COSMOthermX generated sigma profiles and sigma surfaces) with the bubble size observed and this approach showed an increased degree of correlation. However, the strongest relationship was observed (R2 = 0.98 and RAAD = 13%) when the physicochemical parameters for each IL was neglected and only the sigma moments were used to describe the ILs. This final approach was the most successful at reproducing the experimental trend for all ILs and bubble size ranges investigated. The use of this model to accurately reproduce the experimental results shows the potential for selection or design of an IL with a specific average bubble size and could be very useful in the implementation of such materials in gas capture applications. This study has demonstrated that it is possible to generate microbubbles in ionic liquids which has the potential to lead to increased kinetics for gas separation processes. Importantly, the predictive model which has been developed provides a path for process design based on bubble size as well as the thermodynamics of gas absorption in ionic liquids which has been reported previously.44Acknowledgements
This work was carried out as part of the EPSRC funded “4CU” programme grant, aimed at sustainable conversion of carbon dioxide into fuels, led by The University of Sheffield and carried out in collaboration with The University of Manchester, Queen's University Belfast and University College London (EP/K001329/1). The authors also acknowledge funding from the EPSRC under the grant no. EP/N009533/1.Notes and references
- Z. Lei, C. Dai and B. Chen, Chem. Rev., 2014, 114, 1289–1326 CrossRef CAS PubMed.
- R. D. Rogers and K. R. Seddon, Science, 2003, 302, 792–793 CrossRef PubMed.
- K. E. Gutowski and E. J. Maginn, J. Am. Chem. Soc., 2008, 130, 14690–14704 CrossRef CAS PubMed.
- W. B. Zimmerman, V. Tesař and H. C. H. Bandulasena, Curr. Opin. Colloid Interface Sci., 2011, 16, 350–356 CrossRef CAS.
- W. B. Zimmerman, V. Tesar, S. Butler and H. C. H. Bandulasena, Recent Pat. Eng., 2008, 2, 1–8 CrossRef.
- M. K. H. Al-Mashhadani, H. C. H. Bandulasena and W. B. Zimmerman, Ind. Eng. Chem. Res., 2012, 51, 1864–1877 CrossRef CAS.
- J. Hanotu, H. C. H. Bandulasena and W. B. Zimmerman, Biotechnol. Bioeng., 2012, 109, 1663–1673 CrossRef CAS PubMed.
- J. Hanotu, H. C. H. Bandulasena, T. Y. Chiu and W. B. Zimmerman, Int. J. Multiphase Flow, 2013, 56, 119–125 CrossRef CAS.
- K. Ying, M. K. H. Al-Mashhadani, J. O. Hanotu, D. J. Gilmour and W. B. Zimmerman, Engineering, 2013, 5, 735–743 CrossRef.
- (a) S. Marcelja, Curr. Opin. Colloid Interface Sci., 2004, 9, 165–167 CrossRef CAS; (b) S. Marcelja, J. Phys. Chem. B, 2006, 110, 13062–13067 CrossRef CAS PubMed.
- M. Kowacz, J. N. Canongia Lopes, J. M. S. S. Esperança and L. P. N. Rebelo, CrystEngComm, 2012, 14, 5723–5726 RSC.
- X. Zhang, H. Dong, D. Bao, Y. Huang, X. Zhang and S. Zhang, Ind. Eng. Chem. Res., 2014, 53, 428–439 CrossRef CAS.
- H. Dong, X. Wang, L. Lui, X. Zhang and S. Zhang, Chem. Eng. Sci., 2010, 65, 3240–3248 CrossRef CAS.
- D. Bao, X. Zhang, H. Dong, Z. Ouyang, X. Zhang and S. Zhang, Chem. Eng. Sci., 2015, 135, 76–88 CrossRef CAS.
- X. Zhang, H. Dong, Y. Huang, C. Li and X. Zhang, Chem. Eng. J., 2012, 209, 607–615 CrossRef CAS.
- X. Wang, H. Dong, X. Zhang, L. Yu, S. Zhang and Y. Xu, Chem. Eng. Sci., 2010, 65, 6036–6047 CrossRef CAS.
- G. Law, P. R. Watson, A. J. Carmichael and K. R. Seddon, Phys. Chem. Chem. Phys., 2001, 3, 2879–2885 RSC.
- X. Wang, H. Dong, X. Zhang, Y. Xu and S. Zhang, Chem. Eng. Technol., 2010, 33, 1615–1624 CrossRef CAS.
- J. D. Holbrey, W. M. Reichert, R. P. Swatloski, K. R. Seddon and R. D. Rogers, Green Chem., 2002, 4, 407–413 RSC.
- W. Lu, J. Ma, J. Hu, J. Song, Z. Zhang and B. Han, Green Chem., 2014, 16, 221–225 RSC.
- D. Quéré, Phys. A, 2002, 313, 32–46 CrossRef.
- D. J. Wesley, D. T. W. Toolan, S. A. Brittle, J. R. Howse and W. B. Zimmerman, Appl. Opt., 2016, 55, 6102–6107 CrossRef PubMed.
- F. Eckert and A. Klamt, COSMOtherm User's Manual: Version 30_1602, COSMOlogic GmbH & Co. KG, Leverkusen, Germany, 2016 Search PubMed.
- R. Ahlrichs, M. Bär, M. Häser, H. Horn and C. Kölmel, Chem. Phys. Lett., 1989, 162, 165–169 CrossRef CAS.
- (a) F. Weigend and M. Häser, Theor. Chem. Acc., 1997, 1–4, 331–340 CrossRef; (b) F. Weigend, M. Häser, H. Patzelt and R. Ahlrichs, Chem. Phys. Lett., 1998, 1–3, 143–152 CrossRef.
- (a) A. D. Becke, Phys. Rev. A: At., Mol., Opt. Phys., 1988, 38, 3098–3100 CrossRef CAS; (b) C. Lee, W. Yang and R. G. Parr, Phys. Rev. B: Condens. Matter Mater. Phys., 1988, 37, 785–789 CrossRef CAS; (c) S. Grimme, J. Comput. Chem., 2006, 27, 1787–1799 CrossRef CAS PubMed.
- A. Neale, P. Li, J. Jacquemin, P. Goodrich, S. Ball, R. G. Compton and C. Hardacre, Phys. Chem. Chem. Phys., 2016, 18, 11251–11262 RSC.
- A. Kazakov, J. W. Magee, R. D. Chirico, E. Paulechka, V. Diky, C. D. Muzny, K. Kroenlein and M. Frenkel, “NIST Standard Reference Database 147: NIST Ionic Liquids Database – (ILThermo)”, Version 2.0, National Institute of Standards and Technology, Gaithersburg MD, 20899, http://ilthermo.boulder.nist.gov.
- Q. Dong, C. D. Muzny, A. Kazakov, V. Diky, J. W. Magee, J. A. Widegren, R. D. Chirico, K. N. Marsh and M. Frenkel, J. Chem. Eng. Data, 2007, 52, 1151–1159 CrossRef CAS.
- M. G. Freire, A. R. R. Teles, M. A. A. Rocha, B. Schroder, C. M. S. S. Neves, P. Carvalho, D. V. Evtuguin, L. M. N. B. F. Santos and J. A. P. Coutinho, J. Chem. Eng. Data, 2011, 56, 4813–4822 CrossRef CAS.
- H. Tokuda, S. Tsuzuki, M. A. B. H. Susan, K. Hayamizu and M. Watanabe, J. Phys. Chem. B, 2006, 110, 19593–19600 CrossRef CAS PubMed.
- A. Arce, E. Rodil and A. Soto, J. Chem. Eng. Data, 2006, 51, 1453–1457 CrossRef CAS.
- M. S. Calado, A. S. H. Branco, J. C. F. Diogo, J. M. N. A. Fareleira and Z. P. Visak, J. Chem. Thermodyn., 2015, 80, 79–91 CrossRef CAS.
- A. E. Andreatta, M. Francisco, E. Rodil, A. Soto and A. Arce, Fluid Phase Equilib., 2010, 300, 162–171 CrossRef.
- R. G. Seoane, S. Corderi, E. Gomez, N. Calvar, E. J. Gonzalez, E. A. Macedo and A. Dominguez, Ind. Eng. Chem. Res., 2012, 51, 2492–2504 CrossRef CAS.
- F. M. Gacino, T. Regueira, L. Lugo, M. J. P. Comunas and J. Fernandez, J. Chem. Eng. Data, 2011, 56, 4984–4999 CrossRef CAS.
- C. M. S. S. Neves, P. J. Carvalho, M. G. Freire and J. A. P. Coutinho, J. Chem. Thermodyn., 2011, 43, 948–957 CrossRef CAS.
- D. J. Wesley, R. M. Smith, W. B. Zimmerman and J. R. Howse, Langmuir, 2016, 32, 1269–1278 CrossRef CAS PubMed.
- J. N. A. Canongia Lopes and A. Padua, J. Phys. Chem. B, 2006, 110, 3330–3335 CrossRef CAS PubMed.
- K. Wichmann, M. Diedenhofen and A. Klamt, J. Chem. Inf. Model., 2007, 47, 228–233 CrossRef CAS PubMed.
- A. Klamt, F. Eckert and M. Hornig, J. Comput.-Aided Mol. Des., 2001, 15, 355–365 CrossRef CAS PubMed.
- A. Kondor, G. Járvás, J. Kontos and A. Dallos, Chem. Eng. Res. Des., 2014, 92, 2867–2872 CrossRef CAS.
- K. Masuch, A. Fatemi, H. Murrenhoff and K. Leonhard, Lubr. Sci., 2011, 23, 249–262 CrossRef CAS.
- P. Garcia-Gutierrez, J. Jacquemin, C. McCrellis, I. Dimitriou, S. F. R. Taylor, C. Hardacre and R. W. K. Allen, Energy Fuels, 2016, 30, 5052–5064 CrossRef CAS.
Footnote |
| † Electronic supplementary information (ESI) available. See DOI: 10.1039/c7cp01725a |
| This journal is © the Owner Societies 2017 |