
 Open Access Article
 This Open Access Article is licensed under a
 Creative Commons Attribution 3.0 Unported Licence
The effect of K+ cations on the phase transitions, and structural, dielectric and luminescence properties of [cat][K0.5Cr0.5(HCOO)3], where cat is protonated dimethylamine or ethylamine†
Maciej
Ptak
 *a,
Anna
Gągor
a,
Adam
Sieradzki
b,
Bartosz
Bondzior
a,
Przemysław
Dereń
a,
Aneta
Ciupa
a,
M.
Trzebiatowska
a and
Mirosław
Mączka
a
*a,
Anna
Gągor
a,
Adam
Sieradzki
b,
Bartosz
Bondzior
a,
Przemysław
Dereń
a,
Aneta
Ciupa
a,
M.
Trzebiatowska
a and
Mirosław
Mączka
a
aInstitute of Low Temperature and Structure Research, Polish Academy of Sciences, Box 1410, 50-950 Wrocław 2, Poland. E-mail: m.ptak@int.pan.wroc.pl
bFaculty of Fundamental Problems of Technology, Wrocław University of Technology, Wybrzeże Wyspiańskiego 27, 50-370, Wrocław, Poland
First published on 19th April 2017
Abstract
We report the synthesis, crystal structure, and dielectric, vibrational and emission spectra of two novel heterometallic perovskite-type metal–organic frameworks (MOFs) of the following formula: [(CH3)2NH2][K0.5Cr0.5(HCOO)3] (DMAKCr) and [C2H5NH3][K0.5Cr0.5(HCOO)3] (EtAKCr). DMAKCr crystallizes in a trigonal structure (R![[3 with combining macron]](https://www.rsc.org/images/entities/char_0033_0304.gif) space group) and undergoes an order–disorder phase transition to the monoclinic system (P
space group) and undergoes an order–disorder phase transition to the monoclinic system (P![[1 with combining macron]](https://www.rsc.org/images/entities/char_0031_0304.gif) space group) at about 190 K. The dielectric studies confirm the presence of first-order relaxor-like structural transformation. In the high-temperature phase, the dimethylammonium cations are dynamically disordered over three equal positions and upon cooling the dynamical disorder evolves into a two-fold one. This partial ordering is accompanied by a small distortion of the metal–formate framework. EtAKCr crystallizes in a monoclinic structure (P21/n space group) with ordered EtA+ cations and does not experience any phase transition. The differences in the thermal behavior caused by the substitution of Na+ ions by larger K+ ions in the [cat]MIMIII (cat = DMA+, EtA+, MI = Na+, K+ and MIII = Cr3+ and Fe3+) heterometallic MOF family are discussed taking into account the impact of the hydrogen bond (HB) pattern and other factors affecting the stability of metal–formate frameworks. The optical studies show that DMANaCr and EtAKCr exhibit Cr3+-based emission characteristics for intermediate ligand field strength.
space group) at about 190 K. The dielectric studies confirm the presence of first-order relaxor-like structural transformation. In the high-temperature phase, the dimethylammonium cations are dynamically disordered over three equal positions and upon cooling the dynamical disorder evolves into a two-fold one. This partial ordering is accompanied by a small distortion of the metal–formate framework. EtAKCr crystallizes in a monoclinic structure (P21/n space group) with ordered EtA+ cations and does not experience any phase transition. The differences in the thermal behavior caused by the substitution of Na+ ions by larger K+ ions in the [cat]MIMIII (cat = DMA+, EtA+, MI = Na+, K+ and MIII = Cr3+ and Fe3+) heterometallic MOF family are discussed taking into account the impact of the hydrogen bond (HB) pattern and other factors affecting the stability of metal–formate frameworks. The optical studies show that DMANaCr and EtAKCr exhibit Cr3+-based emission characteristics for intermediate ligand field strength.
Introduction
The metal organic frameworks (MOF) constitute a very interesting group of compounds that have received broad interest in recent years due to their multifunctionality and easy methods of synthesis. In general, MOF-type compounds consist of metal–anionic frameworks with cavities large enough to accommodate guest molecules. Among the huge number of MOFs, compounds with a perovskite-type structure are particularly noteworthy. It is well known that inorganic oxide perovskites exhibit plenty of interesting physical phenomena, like colossal magnetoresistance or ferroelectric properties.1,2 The hybrid organic–inorganic perovskites containing protonated amines have been recognized as very attractive materials for ferroelectric photovoltaic devices.3,4 Another group of interesting perovskite-type compounds constitute metal–formate frameworks that can accommodate alkylammonium ions in their cavities. These compounds have been very extensively studied in recent years due to their magnetic, ferroelectric, gas sorption, luminescence and multiferroic properties.5–16 The most widely studied formates are those comprising divalent metal cations of general formula [cat][MII(HCOO)3], where cat+ = protonated amine and MII = Mg, Zn, Mn, Fe, Co, Ni, Cu.5–14 Recently, it has also been reported that the properties of these materials can be tuned by the modification of the framework with mono- and trivalent metal ions. As a result of this approach sodium heterometallic MOFs with dimethylammonium (DMA+) and ethylammonium (EtA+) cations have been synthesized.15–19 [EtA][Na0.5Cr0.5(HCOO)3] (EtANaCr), [EtA][Na0.5Fe0.5(HCOO)3] (EtANaFe) and [EtA][Na0.5Al0.5(HCOO)3] (EtANaAl) have been shown to exhibit order–disorder phase transitions at 373, 360 and 369 K, respectively.17,19 These compounds are isostructural and crystallize in a polar monoclinic structure (space group Pn) at room temperature. Upon heating they transform into a centrosymmetric space group P21/n. In the high-temperature (HT) phase, the EtA+ cations are dynamically disordered over two symmetrically independent positions, each being occupied with ∼50% probability.17,19 It is worth noting that due to the polar character of the structures these compounds are, in principle, ferroelectrics at room temperature. Indeed, ab initio calculations have estimated the electric polarization of EtANaFe equal to 0.8 μC cm−2.17 The substitution of EtA+ by DMA+ cations possessing very similar effective ionic size significantly changes the structural properties. That is, DMANaFe exhibits an order–disorder phase transition at a much lower temperature (Tc = 167 K) and the crystal transforms from R at room-temperature (RT) to a P space group at low-temperature (LT), i.e., the LT phase is ferroelastic but not ferroelectric.15 In contrast to EtANaCr, the DMA-analogue does not undergo any temperature-induced structural phase transition.16 Another interesting feature of heterometallic MOFs containing chromium ions is their efficient luminescence,16,19 which makes them multifunctional and promising materials for potential optoelectronic applications.
In order to understand better the origin of the ferroelectric order in the heterometallic perovskites and structure–property relationship, it is important to study compounds with different chemical compositions. We have decided, therefore, to employ K+ ions in the construction of heterometallic formate frameworks. Potassium ions have not been used in the synthesis of metal–formate frameworks before and we have succeeded in the synthesis of two novel compounds, [(CH3)2NH2][K0.5Cr0.5(HCOO)3] (DMAKCr) and [C2H5NH3][K0.5Cr0.5(HCOO)3] (EtAKCr). We have shown that the replacement of Na+ ions by much larger K+ ions has a significant effect on the structural, phonon, dielectric and luminescence properties as well as the mechanism of the structural phase transition observed in DMAKCr.
Experimental
Materials and instrumentation
All reagents (analytically grade) used for the synthesis were commercially available and were used without further purification. Elemental analysis (C, H, N) was performed on an Elementar Vario EL CHNS analyzer. Powder XRD (X-Ray Diffraction) patterns were obtained on an X'Pert PRO X-ray diffraction system equipped with a PIXcel ultrafast line detector, focusing mirror, and Soller slits for CuKα radiation (λ = 1.54056 Å). The DSC (Differential Scanning Calorimetry) measurements of the obtained samples were performed in the temperature range 130–330 K for DMAKCr (130–390 for EtAKCr) on a DSC-7 instrument (Perkin-Elmer) at a rate of 5 °C min−1 under a nitrogen atmosphere. Fresh crystalline powdered samples of 11.20 and 27.80 mg of DMAKCr and EtAKCr, respectively, were used. The room-temperature Raman spectra were collected using a Bruker FT 110/S spectrometer with 2 cm−1 resolution. The temperature-dependent Raman spectra were measured using a Renishaw InVia Raman spectrometer equipped with a confocal DM 2500 Leica optical microscope, a thermoelectrically cooled CCD (Charge Coupled Device) as a detector and an argon laser operating at 488 nm (50–3500 cm−1 range) and a diode laser operating at 830 nm (10–1000 cm−1 range). The spectral resolution was set to 2 cm−1. The sample for temperature-dependent Raman measurements was placed in a Linkam cryostat cell THMS600 with a temperature stability better than 0.1 K. The room-temperature IR (Infrared) spectra in the mid-IR (4000–400 cm−1) range were measured in KBr pellets and in the far-IR (400–50 cm−1) range in nujol suspension on a polyethylene plate using a BioRad 575C FT-IR (Fourier Transform Infrared) spectrometer with 2 cm−1 resolution. The temperature-dependent IR spectra were measured in the 4000–675 cm−1 range using a Nicolet iN10 FT-IR microscope equipped with a LN2-cooled MCT (Mercury Cadmium Telluride) detector, a permanently aligned 15× objective, 0.7 NA (Numerical Aperture), with a working distance of 16 mm and Linkam cryostat cell THMS600 equipped with ZnSe windows. The spectral resolution of the RT and temperature-dependent IR spectra was 2 cm−1. The sample for temperature-dependent IR measurements was placed in a Linkam cryostat cell THMS600 equipped with ZnSe windows. The complex dielectric permittivity was measured using the experimental set-up made by Novo-Control Alpha GmbH. This system was equipped with a Novocontrol Alpha dielectric spectrometer, having a frequency range of 70 mHz to 1 MHz. Since the obtained single crystals were not big enough to perform single crystal dielectric measurements, pellets made of well-dried samples were measured instead. The pellets were placed between two copper, flat electrodes (diameter 6 mm) of the capacitor with a gap of 0.3 mm. The measurements were taken every 1 deg over the temperature range from 135 to 240 K and the temperature was controlled by the Novo-Control Quattro system, using the nitrogen gas cryostat, with the stability higher than 0.1 K. A set of Dongwoo Optron DM152I monochromators and a Hamamatsu R928 photomultiplier along with an Oxford Model CF 1204 continuous flow liquid helium cryostat equipped with a temperature controller was used for spectroscopic measurements of EtAKCr. A Jobin-Yvon measurement system along with a cryostat was used for the measurement of DMAKCr at 10 K. The emission spectra at 300 K and 77 K were recorded with a PMA-12 Hamamatsu photonic multichannel analyzer equipped with a BT-CCD (Back-Thinned Charge Coupled Device) linear image sensor. The samples were excited with a 405 nm RN-N Blue laser diode. A Xe lamp and a McPherson optical measurement system with a Hamamatsu R928 photomultiplier as a detector were used for spectroscopic measurements of the excitation spectrum. Low temperature (77 K) was obtained using liquid nitrogen and a Dewar flask. The samples were excited with a Ti-sapphire laser pumped with Nd:YAG (Neodymium-doped Yttrium Aluminium Garnet) to measure the decay profiles. The decay profiles at 300 K and 77 K were recorded with a Tektronix MDO3052 digital oscilloscope, at 10 K with a Lecroy digital oscilloscope.Synthesis of the samples
In order to obtain DMAKCr crystals, a mixture of 12 mmol (1.0094 g) HCOOK, 4 mmol (1.6006 g) of Cr(NO3)3·9H2O, 4 mmol (0.3262 g) of dimethylamine hydrochloride (DMA·HCl), 35 ml of N,N-dimethylformamide (DMF) and 25 ml of deionized water was heated at 140 °C in a Teflon-lined microwave autoclave for 48 h. After the solvothermal process, the dark solution was left to slowly evaporate at room temperature. After one week, small dark green crystals were separated from the mother liquid, washed with methanol and dried at 50 °C in air. The yield was about 59% (1.0700 g) based on the starting chromium salt. EtAKCr was prepared analogously, but the applied procedure was different. A mixture containing 25 ml of N-ethylformamide, 15 ml of deionized water, 4 mmol (1.6006 g) Cr(NO3)3·9H2O and 4 mmol (0.3262 g) of ethylamine hydrochloride (EtA·HCl) was added to a mixture of 7 mmol (0.5888 g) of HCOOK dissolved in 10 ml of water with 0.5 ml of concentrated HCOOH and then the solution was heated in a Teflon-lined microwave autoclave at 140 °C for 24 h. After the solvothermal process, the solution was left to evaporate slowly at room temperature. After one week, the dark green crystals were harvested from the mother liquid, washed with methanol and dried at 50 °C in air. The yield was about 63% (1.1425 g) based on the starting chromium salt. Anal. calcd for DMAKCr and EtAKCr: C, 26.49; N, 6.18; H, 4.89%; found for DMAKCr: C, 26.47; N, 6.21; H, 4.93%, and found for EtAKCr: C, 26.46; N, 6.14; H, 4.94%. The phase purity of both bulk samples was confirmed by good matching of their powder XRD patterns with a simulation from the single-crystal structural data (Fig. S1, ESI†).Crystallographic structure determination
The single-crystal X-ray diffraction data were collected on an Xcalibur diffractometer operating in κ-geometry and equipped with a two-dimensional CCD detector and a MoKα radiation (0.71073 Å) source. CrysAlis PRO was used for data collection and processing. The structures were solved by direct methods and refined using full-matrix least-squares methods with SHELX-2014.20 The multiscan absorption collection was applied on all data. The hydrogen atoms were placed in calculated positions and refined as riding atoms. The thermal parameters of the hydrogen atoms were set to be equal to 1.2 times the thermal parameters of the corresponding parent atoms. The displacement parameters from disordered DMA+ atoms were refined isotopically. The structure of the LT phase of DMAKCr was solved based on diffraction from the dominating domain and well-resolved reflections. The data collection and refinement results are given in Table S1 (ESI†); selected distances and angles are listed in Table S2 (ESI†).Results and discussion
Thermal studies
The DSC measurements of DMAKCr and EtAKCr are shown in Fig. S2 (ESI†). The trace recorded for EtAKCr does not show any anomalies that could indicate the presence of a phase transition, while the trace of DMAKCr shows a very small anomaly located at 193 K upon warming and 184 K upon cooling. Fig. 1 shows the temperature dependencies of heat capacity (Cp) and the changes of heat capacity (ΔCp) and entropy (ΔS) related to the phase transition. The character of the observed anomalies points to a first-order phase transition. The associated changes in enthalpy (ΔH) and entropy (ΔS) were estimated to be ∼0.057 kJ mol−1 and ∼0.3 J mol−1 K−1, respectively. These values are about three times smaller than those reported for isostructural DMANaFe (ΔH ≈ 0.17 kJ mol−1 and ΔS ≈ 0.9 J mol−1 K−1)15 suggesting different mechanisms of the phase transitions in DMAKCr and DMANaFe. | ||
| Fig. 1 The heat capacity (Cp) of DMAKCr measured in heating mode. The insets show changes in heat capacity (ΔCp) and entropy (ΔS) related to the phase transition. | ||
It is well known that for an order–disorder transition, ΔS = R![[thin space (1/6-em)]](https://www.rsc.org/images/entities/char_2009.gif) ln(N), where N is the ratio of the number of configurations in the disordered and ordered system while R is the gas constant. For DMANaFe, N = 3 and ΔS was expected to be 9.1 J mol−1 K−1.15 Our X-ray diffraction studies display a trigonal disorder of DMA+ in the HT phase of DMAKCr and two-fold disorder in the LT phase (see discussion in the next paragraphs). Therefore, N = 1.5 and the expected change in entropy should be equal to ca. 3.4 J mol−1 K−1. As one can notice, ΔS should be about three times smaller for DMAKCr compared to DMANaFe, according to the experiment. However, the experimental values of ΔS are about ten times smaller than the expected ones. Since these materials show pronounced dielectric relaxation phenomena (see next paragraph and ref. 15), the values of ΔS much smaller than expected indicate that much residual entropy is left over in the LT phases.
ln(N), where N is the ratio of the number of configurations in the disordered and ordered system while R is the gas constant. For DMANaFe, N = 3 and ΔS was expected to be 9.1 J mol−1 K−1.15 Our X-ray diffraction studies display a trigonal disorder of DMA+ in the HT phase of DMAKCr and two-fold disorder in the LT phase (see discussion in the next paragraphs). Therefore, N = 1.5 and the expected change in entropy should be equal to ca. 3.4 J mol−1 K−1. As one can notice, ΔS should be about three times smaller for DMAKCr compared to DMANaFe, according to the experiment. However, the experimental values of ΔS are about ten times smaller than the expected ones. Since these materials show pronounced dielectric relaxation phenomena (see next paragraph and ref. 15), the values of ΔS much smaller than expected indicate that much residual entropy is left over in the LT phases.
Dielectric studies
Fig. 2 shows the temperature dependence of dielectric permittivity for DMAKCr at several frequencies. The first general remark refers to the real part (ε′) of dielectric permittivity of this compound reaching a relatively low strongly frequency-dependent value similar to those observed for DMANaCr and DMANaFe.15,16 Interestingly, no anomaly associated with the phase transition is observed. The values of dielectric permittivity, strongly frequency-dependent, are small in the LT phase and increase monotonically with increasing temperature. This behavior implies the relaxor character of the DMAKCr sample. It is clear that ε′′(T) exhibits a single relaxation peak, shifted towards higher frequencies with increasing temperature (Fig. 3). The observed dielectric response seems to exhibit close classic Debye behavior. However, the loss peak is slightly asymmetric and deviates from a pure Debye peak, confirming the more complex nature of the observed relaxation process. | ||
| Fig. 2 The variation of the real (ε′) and imaginary (ε′′) part of the complex dielectric permittivity in the frequency range from 70 mHz to 1 MHz in the 135–240 K temperature range. The data were collected during the heating process. The dashed vertical line indicates the phase transition temperature. | ||
 | ||
| Fig. 3 The frequency dependence of the real ε′ (a) and imaginary ε′′ (b) part of the complex dielectric permittivity. | ||
We have constructed the relaxation diagram of DMAKCr by plotting the relaxation time τ as a function of 103/T. It reflects the dynamic properties of the system. The relaxation curve (Fig. 4) clearly indicates that the thermal activation of the observed dipolar relaxation for the 100 K temperature range spans four decades of frequency. The relaxation time τ vs. 103/T dependence exhibits a classical linear tendency. Despite the curvature, it can be modelled in the first approximation using the Arrhenius relation. It is evident that the experimental data fit to the Arrhenius law is fulfilled with Ea = 0.14 eV and the characteristic time τ0 = 10−12 s. This behavior has been described in several MOFs as the expression of the reorientational motions of DMA+ cations in the structure.15,16,21 It is worth mentioning that the Ea = 0.14 eV value for DMAKCr is much smaller than that reported for isostructural DMANaFe and DMANaCr (Ea = 0.28 eV).15,16 This result demonstrates that the DMA+ ions are confined with smaller strength by the DMAKCr framework than the DMANaFe and DMANaCr ones. It should also be marked that there is no sign of phase transition at 193 K in the temperature dependence of the relaxation times. The lack of any noticeable change in the Ea on going from the HT to LT phase of DMAKCr indicates very similar confinement of the DMA+ cations in both phases. Similar behavior has also been reported for niccolite-type DMAFeIIFeIII.21
 | ||
| Fig. 4 The Arrhenius plot of the relaxation times for fast dipolar relaxation processes observed for DMAKCr. The vertical dashed line indicates the phase transition temperature. | ||
Structural studies
Both EtAKCr and DMAKCr adopt the perovskite-like metal–formate framework of 412·36 topology. The metal centers are octahedrally coordinated by the formate oxygen atoms with Cr–O/K–O distances equal to ∼1.97/∼2.74 Å in EtAKCr, and ∼1.97/∼2.71 Å in DMAKCr (see Table S2, ESI†). Each Cr3+ (K+) node is connected to its six K+ (Cr3+) nearest neighbors through six formate bridges being in the anti–anti connection mode. The large crystal cavities are templated by protonated amines.EtAKCr crystallizes in the monoclinic system in the centrosymmetric P21/n space group that corresponds to the HT phase of EtANaFe and EtANaCr.17,19 The structures differ, however, with the distribution of EtA+ cations in the perovskite-like cavities. In both EtANaFe and EtANaCr, the EtA+ are dynamically disordered over two inequivalent positions in the P21/n phase. In EtAKCr the cations are ordered and anchored via N–H⋯O hydrogen bonds to the framework. Fig. 5a illustrates the arrangement of EtA+ in the crystal cavity at room temperature. The strongest HBs are formed between the amines and formate oxygen atom KO6 octahedra. All N⋯O distances (ranging from 2.83–2.87 Å) are shorter than the corresponding distances in EtANaFe (2.85–3.01 Å) and EtANaCr (2.87–2.99 Å) at room temperature, suggesting slightly stronger HBs in EtAKCr. The details concerning the HB geometry are given in Table 1.
 | ||
| Fig. 5 EtA+ and DMA+ templates in the perovskite-like cavity, anchored via N–H⋯O HBs: (a) EtA+ are ordered at room temperature; (b) three equivalent positions of DMA+ in the HT phase, each occupied with 1/3 probability; and (c) partially ordered DMA+ in the LT phase, two inequivalent positions are occupied with 0.55/0.45 ratio. | ||
| D–H⋯A | D–H (Å) | H⋯A (Å) | D⋯A (Å) | D–H⋯A (°) |
|---|---|---|---|---|
| Symmetry code(s): (i) −x, −y + 1, −z; (ii) −x + 1/2, y + 1/2, −z − 1/2; (iii) x, y + 1, z; (iv) −y + 1, x − y, z; (v) x + 1, y, z. | ||||
| EtAKCr | ||||
| N1–H1A⋯O5i | 0.89 | 2.00 | 2.859 (3) | 162.1 |
| N1–H1B⋯O4ii | 0.89 | 1.95 | 2.828 (3) | 167.2 |
| N1–H1C⋯O3iii | 0.89 | 2.53 | 3.255 (3) | 139.1 |
| N1–H1C⋯O6 | 0.89 | 2.01 | 2.874 (3) | 164.4 |
| DMAKCr (298 K) | ||||
| N1–H1A⋯O2 | 0.89 | 2.02 | 2.856 (7) | 155.3 |
| N1–H1B⋯O1iv | 0.89 | 2.46 | 3.243 (6) | 146.8 |
| N1–H1B⋯O2iv | 0.89 | 2.55 | 3.008 (7) | 112.6 |
| DMAKCr (80 K) | ||||
| N1–H1A⋯O4 | 0.89 | 2.13 | 3.02 (2) | 170.5 |
| N1–H1B⋯O5iii | 0.89 | 2.04 | 2.84 (2) | 148.3 |
| N2–H2A⋯O6v | 0.89 | 2.14 | 2.89 (3) | 142.1 |
DMAKCr adopts the room temperature structure of DMANaFe.15 Both compounds crystallize in the rhombohedral R space group and display thermally activated rotations of DMA+ ions along the trigonal 0.3 axis. Fig. 5b shows the positions of three equivalent DMA+ ions in the cavity, each being occupied with 1/3 probability. The two shortest N–H⋯O distances in DMAKCr at RT are slightly shorter (2.856 and 3.008 Å) than those in DMANaCr (2.877 and 3.065 Å) but the third distance is significantly longer in DMAKCr (3.243 Å) than that in DMANaCr (3.099 Å).16 This behavior suggests a weak change of the HB strength when Na+ ions are replaced by K+ ones. The phase transition at about T = 190 K leads to the lowering of the crystal symmetry to P and is accompanied by sample twinning. The triclinic unit cell is a distorted primitive rhombohedral cell with a volume three times smaller than the R centered cell. The radical symmetry decrease goes together with the reduction of the volume of the perovskite-like cavities from 98 Å3 at room temperature to 93 Å3 at 80 K. In the LT phase, the DMA+ are partially ordered. They statistically occupy two inequivalent positions with 0.55(2)/0.45(2) probability. They are anchored by HBs formed both between NH2 groups and formate oxygen atoms from KO6 octahedra. Fig. 5c presents two independent DMA+ ions in the LT phase.
Vibrational properties at room temperature
The Raman and IR spectra of DMAKCr and EtAKCr are presented in Fig. 6, Fig. S3 and S4 (ESI†). The IR and Raman frequencies, observed at 300 and 80 K, are listed in Tables S3 and S4 (ESI†) together with the suggested assignments. We will not discuss the assignments of internal modes since this could be easily done based on the literature data for other formates as well as the data reported for DMANaFe, DMANaCr, EtANaFe, EtANaAl and EtANaCr.15–17,19,22–24 The assignment of lattice modes is more complicated due to their strong mutual coupling. Furthermore, the translational modes are expected to shift towards lower wavenumbers with increasing atomic mass and size of an ion, as observed for other series of MOFs containing divalent metal ions, NH4+ and DMA+.23,24 In the present case, we propose an assignment of lattice modes based on the comparison of the DMAKCr and EtAKCr spectra with the spectra reported for DMANaCr and EtANaCr.16,19 Since the atomic mass and ionic radius of Na+ (22.99 u and 1.02 Å,25) are smaller than for K+ (39.10 u and 1.38 Å,25), the substitution of Na+ by K+ ions should lead to a significant shift of T′(MI) modes towards lower wavenumbers. In our previous studies we have assigned Raman bands at 342 cm−1 (for DMANaCr) and 337 cm−1 (for DMANaFe) to T′(Na+) + T′(MIII) modes.15,16 The Raman spectrum of DMAKCr shows a similar band at 344 cm−1 (Fig. S3 and S4, Tables S3 and S4, ESI†). Comparable bands are also observed for EtAKCr at 341 cm−1, EtANaCr at 339 cm−1, EtANaAlCr at 335 cm−1 and EtANaFe at 329 cm−1.17,19 These bands do not exhibit any significant shifts when Na+ ions are replaced by K+ ones. Therefore, the previous assignment should be revised, i.e., these bands ought to be assigned to T′(MIII) modes. Far-IR and Raman data also show that the translations of MI cations contribute significantly to the modes located in the 170–280 and 130–280 cm−1 ranges for DMAKCr and EtAKCr, respectively. Additionally, we have assigned the strongest Raman (IR) bands above 100 cm−1 to the modes experiencing a strong contribution from librational (translational) motions of the HCOO− ions. The remaining bands located below 100 cm−1 originate from the librations and translations of DMA+ or EtA+ cations.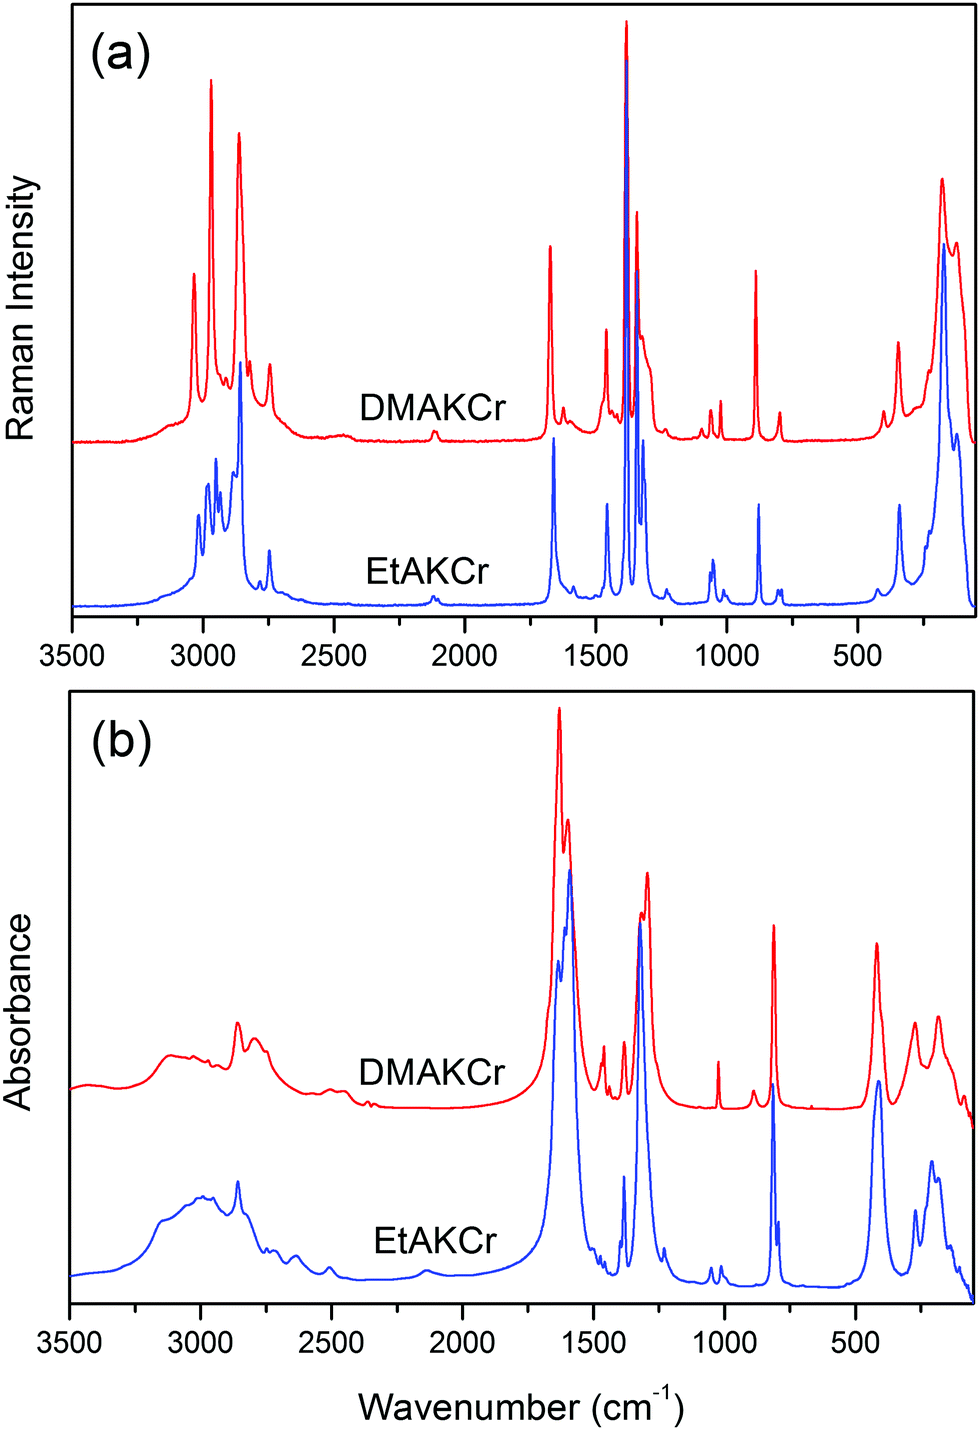 | ||
| Fig. 6 The Raman (a) and IR (b) spectra of DMAKCr and EtAKCr measured at room temperature. | ||
The comparison of RT Raman and IR spectra of DMAKCr, DMANaCr15 and DMANaFe14 demonstrates that the νs(CNC), νas(CNC), δas(CH3) and ρ(CH3) bands corresponding to DMA+ are observed at similar wavenumbers. The ν(NH2), δ(NH2) and ρ(NH2) modes of DMAKCr shift towards lower wavenumbers compared to DMANaCr by less than 8 cm−1, indicating weak change in the HB strength when going from DMANaCr to DMAKCr. A more significant downshift (12 cm−1) is, however, observed for the ν1 (the CH stretching) mode of DMAKCr. This effect can be attributed to the increased length of the C–H bond when K+ replaces Na+.
The analysis of EtAKCr and EtaNaCr becomes more sophisticated since they adopt different monoclinic structures at room temperature. Some IR and Raman bands observed for EtANaCr (Pn symmetry) are merged for EtAKCr (P21/n symmetry). Nevertheless, the spectra show that the bands corresponding to the CCN skeleton of the EtA+ cations slightly shift towards higher wavenumbers for EtAKCr, whereas bands originating from the vibrations of the NH3 group move slightly to lower wavenumbers. This behavior can be attributed to the fact that the EtA+ cations in EtAKCr are accommodated in larger voids (78 Å3) when compared to the EtANaCr framework (73 Å3).19 It is worth adding that the majority of IR and Raman bands of EtAKCr associated with formate ions are broader at RT when compared to EtANaCr. The largest broadening is observed for ν3 (the symmetric OCO bending) and ν2 (the antisymmetric CO stretching) modes. This observation is consistent with the X-ray data showing that the EtA+ cations in EtAKCr are dynamically disordered at RT over two inequivalent positions in the P21/n phase whereas they stay ordered in EtANaCr.
Temperature-dependent vibrational properties of DMAKCr
The temperature-dependent Raman and IR spectra of DMAKCr are presented in Fig. S5 and S6 (ESI†). The decrease in temperature leads to some pronounced changes in intensity, full width at half maximum (FWHM) and wavenumber of the modes corresponding to the motions of the NH2 groups. Firstly, the ν(NH2) and ρ(NH2) modes exhibit softening and hardening, respectively (Table S3 and Fig. S5–S8, ESI†). This behavior reflects the strengthening of HBs and the shift of the proton towards the parent donor atom upon cooling of the DMAKCr sample. Secondly, many bands corresponding to vibrations of the HCOO− group exhibit a pronounced increase in intensity with lowering of the temperature. This behavior is particularly apparent for the ν2 modes. Thirdly, the bands at 1439 and 1482 cm−1, assigned to the τ(NH2) and ω(NH2) modes, are barely observable at room temperature but become more intense below 180 K (Fig. S5 and S6, ESI†). This process indicates the highly dynamic nature of HBs in DMAKCr. The previous lattice dynamic calculations of [DMA][Ni(HCOO)3] have shown that the ρ(NH2) mode is very sensitive to the changes of the HB network.11 Indeed, the temperature evolution of this band for DMAKCr is unique, see Fig. S6 and S7 (ESI†). That is, at RT in the IR spectrum, a band is observed at 888 cm−1 that is a very weak band and overlaps with the νs(CNC) band. The decrease of temperature causes its fast hardening up to 912 cm−1 and the change of FWHM from 25 cm−1 at RT to 17 cm−1 at 80 K. By contrast to other bands observed at the lowest temperature, this mode remains relatively broad. This behavior is consistent with two-fold disorder of these cations in the LT phase as revealed by X-ray diffraction studies.The changes related to the structural transformation are clearly distinguished in the temperature dependence of the wavenumbers and FWHM values, presented for the selected modes in Fig. S7 and S8 (ESI†). In particular the νas(CNC), νs(CNC), νas(CH3) and δas(CH3) modes exhibit an evident change in the slopes of the frequency vs. temperature plots near Tc. Additionally, the FWHM of δas(CH3) vibration exposes a pronounced decrease below Tc. This behavior provides further evidence that the phase transition in DMAKCr has an order–disorder character and is primarily governed by the dynamics of DMA+ cations. It is also worth emphasizing that many bands related to the HCOO− ions split below Tc into a few components (see Fig. S7 and S8, ESI†). These changes are abrupt, confirming the first-order nature of the phase transition. The strongest splitting, up to 28 cm−1 observed for the ν2 IR mode at 1293 cm−1, proves that the phase transition is associated with the symmetry decrease and the significant distortion of the metal–formate framework. The symmetry lowering is also evidenced by a pronounced splitting of many lattice modes in the LT phase (Fig. S5 and S7, ESI†).
Temperature-dependent vibrational properties of EtAKCr
The temperature-dependent Raman spectra of EtAKCr are presented in Fig. S9 and S10 (ESI†), whereas Fig. S11 and S12 (ESI†) show the temperature-dependent behavior of the modes' wavenumbers and FWHM for a few selected bands. The figures demonstrate no sign of a structural phase transition which is in agreement with the X-ray diffraction studies. However, some interesting features can be noticed. Firstly, the intensity of the bands corresponding to the methyl and amine groups of EtA+ increases upon cooling. This behavior results from a continuous freezing of the EtA+ motions upon cooling. Secondly, a significant narrowing is observed for many Raman and IR bands that can be attributed to the decrease of the phonon–phonon anharmonic interactions. As a result, some additional bands, not resolved at room temperature, become clearly distinguishable at low temperatures, especially below 180 K.Effect of MI, MIII and alkylammonium cations on the framework's flexibility, structural distortion and phase transition mechanism
In order to understand the causes of the occurrence or lack of the phase transitions in heterometallic DMA+- and EtA+-based perovskites, it is necessary to compare their geometrical data and strength of HBs. There are two major contributions to the phase transition mechanism in perovskite-like MOFs, i.e., the cooperative freezing of the reorientational motions of the alkylammonium cations located in the cavities of the framework and the distortion of the framework. It has usually been assumed that the second contribution is weak in formates due to a small flexibility of formate ions.5,11,15,17 However, Sánchez-Andújar et al. have suggested recently that this contribution might also be significant in formate frameworks since the MO6 octahedra in metal–formate frameworks are capable of tilting distortion.26 The distortion of the framework is also recognized as a very important contribution when formate ions are replaced by more flexible azide (N3−) ions.26–29All three compounds, DMAKCr, DMANaCr and DMANaFe, adopt trigonal R symmetry at RT with dynamically disordered DMA+ cations occupying three equivalent positions around trigonal axes. However, the lowering of temperature leads to a different behavior of these analogues, that is, DMANaFe transforms at about 170 K to triclinic symmetry with ordered DMA+ cations,15 DMAKCr also transforms to a triclinic structure but with two-fold disorder of DMA+ cations whereas freezing of the molecular rotation of DMA+ in DMANaCr does not result in any structural phase transition, i.e., DMA+ cations statistically occupy three equivalent positions around the threefold axis in the LT phase.16 It has been assumed that the substitution of Fe3+ ions by Cr3+ causes lower flexibility of the framework and this effect leads to suppression of the phase transition in DMANaCr.16 It is worth adding that the available literature data for DMANaCr16 and DMANaFe,15 and the results presented here for DMAKCr let us estimate the size of the cavities as equal to 77, 84 and 98 Å3, respectively. In spite of this difference, X-ray diffraction and vibrational data suggest that the HB strength is comparable in these compounds. We think, however, that the symmetric arrangement of HBs in DMA analogues is also an important factor stabilizing the structure. Fig. S13 (ESI†) shows the geometrical parameters of MIIIO6 and MIO6 octahedra in the HT and LT phases reported for DMA analogues. As evidenced by the data the strongest distortion of the framework is observed for DMANaFe and is related to strong deformation of both NaO6 and FeO6 octahedra in the LT phase.15 It includes a strong decrease of all trans O–M–O angles in both types of octahedra, suggesting substantial tilting. In contrast to DMANaFe, the phase transition in DMAKCr involves a weak distortion of the framework, which suggests that the KO6 octahedra are much less deformable than the NaO6 ones. Therefore, we may conclude that the phase transition in DMAKCr is almost exclusively driven by the reorientational motions of the DMA+ cations.
Our studies have also shown that in contrast to EtANaCr, EtANaAl and EtANaFe, the EtAKCr compound does not undergo a phase transition, i.e., the substitution of Na+ by K+ cations causes its suppression. The sizes of the cavities are equal to 71, 72, 73 and 78 Å3 for EtANaAl, EtANaFe, EtANaCr19 and EtAKCr, respectively. We suppose that the smaller influence of substitution on the size of the cavities can be explained by the asymmetric HB pattern. In the case of EtA+ analogues there is only one HB with MIIIO6 octahedra and three HBs with MIO6 octahedral units. Due to the more ionic character of MI–O bonds, the three HBs with MIO6 nodes are more polarized and require higher energy to overcome the reorientational motions of ethylammonium cations.19 Fig. S14 (ESI†) shows the geometrical parameters of the octahedra in EtAKCr in comparison to other members of this family. It may be assumed that the deformation level of NaO6 octahedra is strongly affected below Tc while the shape of the MIIIO6 building blocks remains similar in the LT phase. It implies that the mechanism of the phase transition observed for the EtA analogues involves the reorientational motions of EtA+ cations and strong distortion of the NaO6 subnetwork. The distortion involves significant tilting and flattening of the NaO6 octahedra below Tc and the decrease of trans O–M–O angles. The KO6 octahedra in EtAKCr are more distorted in the P21/n phase, however three trans O–M–O angles are equal to 180°. This result confirms that KO6 is less deformable than NaO6.
The disability of KO6 to bending deformations (decrease of three trans O–M–O angles) is observed for DMAKCr and EtAKCr materials. In EtAKCr this feature suppresses the phase transition completely. In the case of DMAKCr the phase transition may still occur due to the large cavities, however, its mechanism differs from that observed for isostructural DMANaFe and involves almost exclusively the ordering of DMA+ cations.
Optical studies
Fig. 7 presents diffuse reflectance absorption spectra of DMAKCr and EtAKCr. While the former is symmetric and nicely shaped, the latter is deformed showing strong splitting of both bands. According to Oh notation the bands centered at about 17570 cm−1 correspond to the 4A2g → 4T2g transition while the second broad band centered at about 24330 cm−1 can be attributed to the 4A2g → 4T1g transition. The crystal field Dq and Racah parameters B and C have been calculated for both matrices (see Table 2) by the application of methodology which has already been described by us previously.16,19 The values of Dq point to the so-called intermediate ligand field. It is worth noting that the Dq value of DMAKCr is smaller than that reported for DMANaCr (2.29),16 indicating the weakening of the crystal field when Na+ is replaced by K+. This effect is not observed for the EtA analogues since the Dq value of EtANaCr (2.18)19 is close to the 2.21 value found for EtAKCr.
 | ||
| Fig. 7 The diffuse reflectance absorption spectra of EtAKCr and DMAKCr measured at 300 K. | ||
| Compound | Dq (cm−1) | B (cm−1) | Dq/B | C (cm−1) |
|---|---|---|---|---|
| DMAKCr | 1787 | 810 | 2.21 | 2519 |
| EtAKCr | 1770 | 800 | 2.21 | 2545 |
The spin forbidden levels observed in the absorption spectra as small humps around 14860 and 14550 cm−1 originate from the transition from the ground level to the 2T1g and 2Eg levels, respectively. The exact position of the latter has been found from the LT emission spectra (see Fig. 8). The bands at 14574 and 14552 cm−1 for EtAKCr and DMAKCr, respectively, are assigned to the strong vibronic R1 component of the 2Eg → 4A2g transition. The R2 component is located 54 and 45 cm−1 above the R1 one, respectively. Their intensities are much stronger in the DMAKCr sample as seen in Fig. 8. The spectrum of the latter compound is rich in vibronic transitions. Their FWHMs are three times larger compared to the EtAKCr matrix, being equal to 13.4 and 4.4 cm−1, respectively. The energies of the R lines and vibronic bands are collected in Table S5 (ESI†). Some vibrations do not appear in the emission spectrum of the EtAKCr sample. A more detailed discussion on the phonon properties of these matrices is accessible in the Vibrational studies section of this publication.
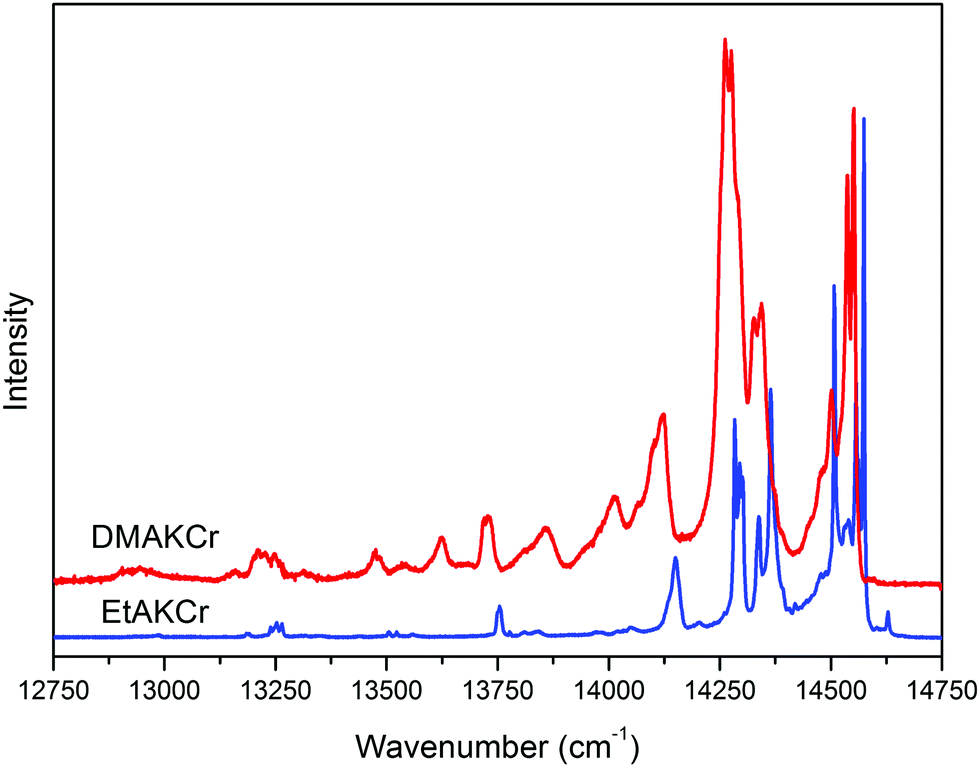 | ||
| Fig. 8 The emission spectra of EtAKCr and DMAKCr measured at 10 K, λexc = 405 nm. | ||
Our results also show that not all narrow bands have the same dynamics with decreasing temperature. The only band not observed at temperatures above 20 K and very intense at 5 K is located at 14508 cm−1 (see Fig. 9). Similarly to the EtANaCr sample19 it can be assigned to the so-called N line. The sample is fully concentrated, therefore Cr–Cr pair lines are expected but its intensity is lower than for EtANaCr.19 A weaker presence of the Cr–Cr pairs in EtAKCr can be attributed to the larger ionic size of K+ (139 pm) than Na+ (102 pm).25 It is interesting that for the DMAKCr sample, the N lines are basically invisible. In Table S5 (ESI†), the transition at 14477 cm−1 is tentatively assigned to a Cr–Cr pair, however, it is difficult to confirm since it is too weak to measure its lifetime. Probably this is connected with an even greater distance between the chromium ions in the DMAKCr matrix.
 | ||
| Fig. 9 The emission spectra of EtAKCr as a function of temperature, λexc = 405 nm. | ||
At room temperature only EtAKCr exhibits emission. The emission of the DMAKCr sample is quenched by much stronger so-called effective phonons30,31 in this matrix. A large broad band observed in Fig. S15 (ESI†) with a maximum at 13194 cm−1 is due to the spin allowed 4T2g → 4A2g luminescence, and the small bands around 14577 cm−1 originate from the 2Eg → 4A2g phosphorescence.
The 300 K emission decay time of the EtAKCr sample is virtually single exponential (see Fig. 10a). The first component is irrelevant as shown by fitting with I(t) = A1exp(−t/τ1) + A2exp(−t/τ2), namely, A1 = 0.0069 and τ1 = 8.5 ns, A2 = 0.64, τ2 = 0.39 μs. It is a typical value of the spin allowed 4T2g → 4A2g transition measured at 300 K.
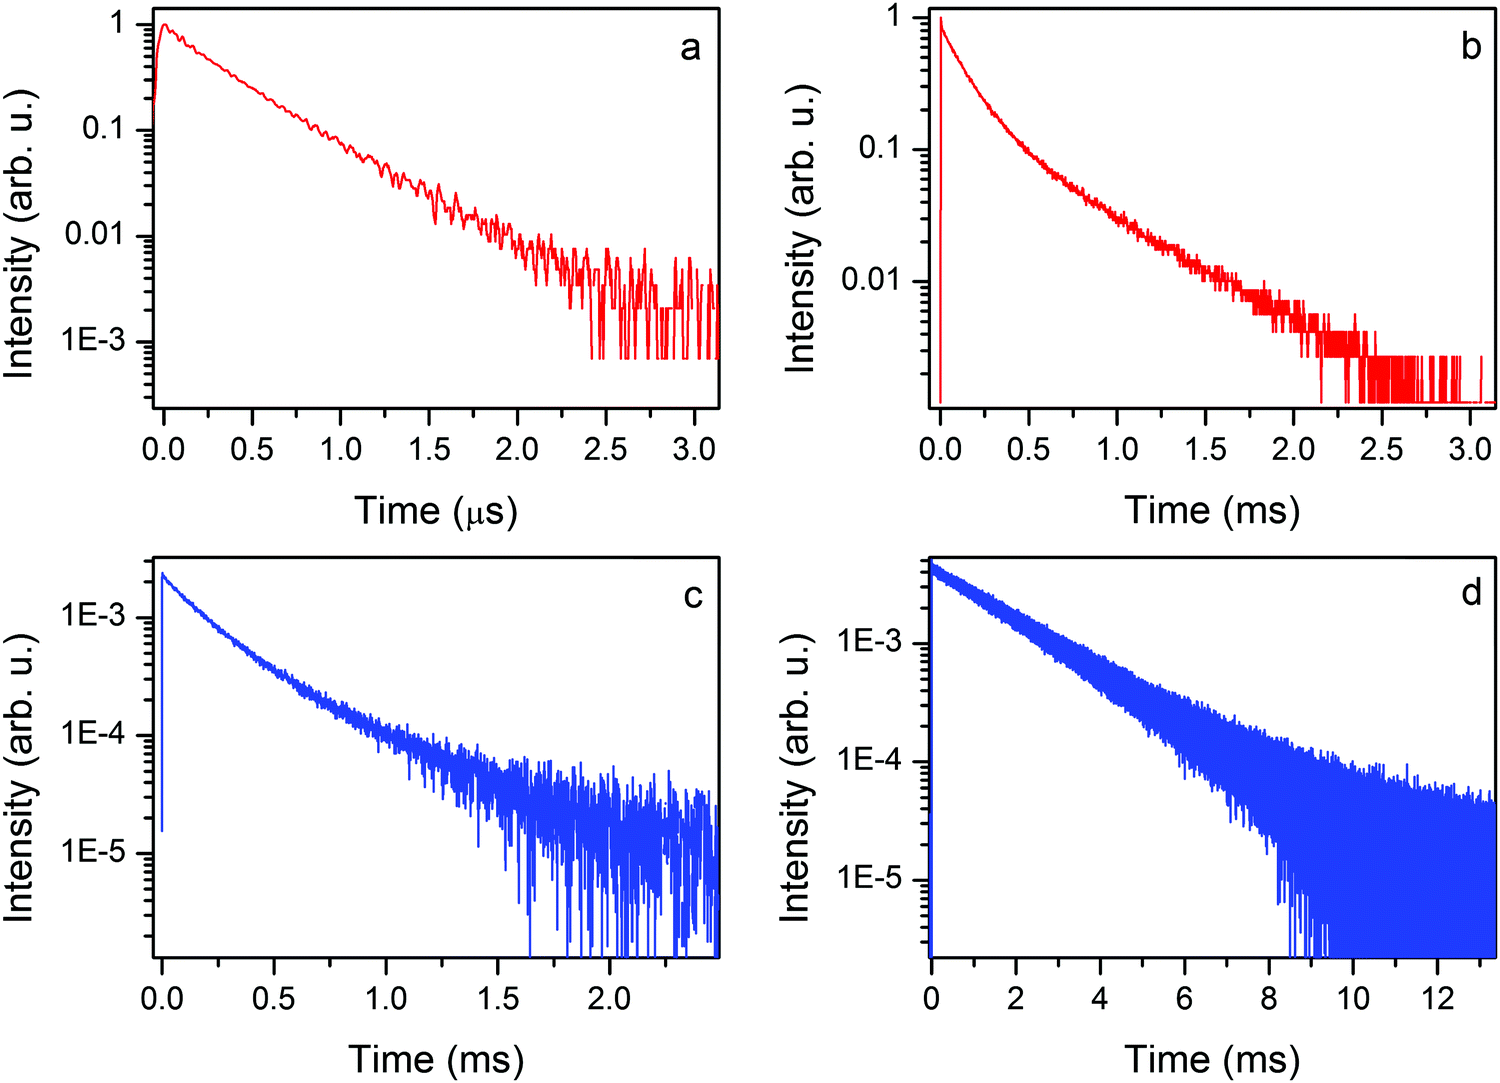 | ||
| Fig. 10 The 300 K (a) and 77 K (b) decay profile of the 2Eg → 4A2g phosphorescence of the EtAKCr sample, λexc = 405 nm and the 77 K (c) and 10 K (d) decay profile of the 2Eg → 4A2g phosphorescence of the DMAKCr sample, λexc = 405 nm. | ||
The decay profiles of the 2Eg → 4A2g spin forbidden transition at liquid nitrogen temperature are nearly the same (see Fig. 10b and c). Two relevant components are derived from the equation given above: the short (137 and 183 μs) and the long one (501 and 525 μs) for EtAKCr and DMAKCr, respectively.
The emission decay profile at 10 K is again virtually single exponential with a decay constant of 1.99 ms. The obtained data allow us to conclude that nonradiative transitions play an important role in the investigated matrices since the decay time of phosphorescence is only a quarter of the decay time registered at 10 K.
Conclusions
We have synthesized two novel heterometallic metal–organic frameworks crystallizing in a perovskite-like architecture, DMAKCr and EtAKCr. The DSC studies have shown that only DMAKCr undergoes first order structural phase transitions at about 190 K. The X-ray diffraction data have revealed that DMAKCr adopts a trigonal R space group at RT with dynamically disordered DMA+ along the trigonal axis, each being occupied with 1/3 probability. The DMA+ cations begin to order upon cooling and the structure transforms to monoclinic P symmetry with partially ordered DMA+ cations occupying statistically two inequivalent positions. This process gives rise to a relaxor-like dielectric response. The temperature-dependent Raman and IR studies confirm the presence of the first-order phase transition and its highly dynamic nature. Our studies have shown that substitution of Na+ by larger K+ ions in DMAMIMIII leads to a change of the framework's stability due to smaller deformability of KO6 octahedra and that the phase transition in DMAKCr is mainly driven by the reorientational motions of DMA+ cations.
EtAKCr crystallizes in the monoclinic system in a centrosymmetric P21/n space group with ordered EtA+ cations that correspond to the HT phase of its sodium analogue. In this case the substitution of monovalent ions suppresses completely the presence of phase transition due to the asymmetric pattern of HBs, larger ionic radius of K+ ions and smaller deformability of KO6 structural units causing the disability of KO6 to bending deformations.
We also show that the emission of Cr3+ ions in both compounds is characteristic for an intermediate ligand field. Furthermore, the optical studies have manifested that in spite of the lack of concentration quenching, the nonradiative processes involving Cr–Cr energy transfer and Cr–Cr pair energy transfer occur in both samples and the emission spectra at RT can be registered only for EtAKCr. The obtained emission decay times allow us to conclude that nonradiative transitions play an important role in the investigated samples.
Acknowledgements
This research was supported by the National Science Centre (NCN) in Poland under project no. DEC-2015/17/D/ST5/01339.References
- A. P. Ramirez, J. Phys.: Condens. Matter, 1997, 9, 8171–8199 CrossRef CAS.
- K. M. Rabe, C. H. Ahn and J.-M. Triscone, Physics of Ferroelectrics: A Modern Perspective, Springer-Verlag, Berlin, Heidelberg, 2007 Search PubMed.
- (a) F. Hao, C. C. Stoumpos, D. H. Cao, R. P. H. Chang and M. G. Kanatzidis, Nat. Photonics, 2014, 8, 489 CrossRef CAS; (b) P. V. Kamat, J. Am. Chem. Soc., 2014, 136, 3713 CrossRef CAS PubMed.
- (a) A. Stroppa, C. Quarti, F. De Angelis and S. Picozzi, J. Phys. Chem. Lett., 2015, 6, 2223 CrossRef CAS PubMed; (b) A. Stroppa, D. Di Sante, P. Barone, M. Bokdam, G. Kresse, C. Franchini, M.-H. Whangbo and S. Picozzi, Nat. Commun., 2014, 5, 5900 CrossRef CAS PubMed.
- (a) P. Jain, N. S. Dalal, B. H. Toby, H. Kroto and A. K. Cheetham, J. Am. Chem. Soc., 2008, 130, 10450 CrossRef CAS PubMed; (b) P. Jain, V. Ramachandran, R. J. Clark, H. D. Zhou, B. H. Toby, N. S. Dalal, H. W. Kroto and A. K. J. Cheetham, J. Am. Chem. Soc., 2009, 131, 13625 CrossRef CAS PubMed; (c) M. Guo, H. L. Cai and R. G. Xiong, Inorg. Chem. Commun., 2010, 13, 1590–1598 CrossRef CAS.
- B. Pato Doldán, M. Sánchez-Andújar, L. C. Gómez-Aguirre, S. Yáñez-Vilar, J. Lopez-Beceiro, C. Gracia-Fernandez, A. A. Haghighirad, F. Ritter, S. Castro-Garcia and M. A. Señaris-Rodriguez, Phys. Chem. Chem. Phys., 2012, 14, 8498 RSC.
- (a) D. W. Fu, W. Zhang, H. L. Cai, Y. Zhang, J. Z. Ge, R. G. Xiong, S. D. Huang and T. Nakamura, Angew. Chem., Int. Ed., 2011, 50, 11947 CrossRef CAS PubMed; (b) Y. Tian, A. Stroppa, Y. Chai, L. Yan, S. Wang, P. Barone, S. Picozzi and Y. Sun, Sci. Rep., 2014, 4, 6062 CrossRef CAS PubMed.
- (a) B. Pato Doldán, L. C. Gómez-Aguirre, J. M. Bermúdes-García, M. Sánchez-Andújar, A. Fondado, J. Mira, S. Castro-Garcia and M. A. Señaris-Rodriguez, RSC Adv., 2013, 3, 22404 RSC; (b) A. Stroppa, P. Jain, P. Barone, M. Marsman, J. M. Perez Mato, A. K. Cheetham, H. W. Kroto and S. Picozzi, Angew. Chem., Int. Ed., 2011, 50, 5847 CrossRef CAS PubMed.
- D. Di Sante, A. Stroppa, P. Jain and S. Picozzi, J. Am. Chem. Soc., 2013, 135, 18126 CrossRef CAS PubMed.
- R. Shang, G. C. Xu, Z. M. Wang and S. Gao, Chem. – Eur. J., 2014, 20, 1146 CrossRef CAS PubMed.
- (a) M. Mączka, A. Gągor, B. Macalik, A. Pikul, M. Ptak and J. Hanuza, Inorg. Chem., 2014, 53, 457 CrossRef PubMed; (b) M. Mączka, A. Sieradzki, B. Bondzior, P. Dereń, J. Hanuza and K. Hermanowicz, J. Mater. Chem. C, 2015, 3, 9337 RSC; (c) M. Mączka, M. Ptak and L. Macalik, Vib. Spectrosc., 2014, 71, 98 CrossRef; (d) M. Mączka, W. Zierkiewicz, D. Michalska and J. Hanuza, Spectrochim. Acta, Part A, 2014, 128, 674 CrossRef PubMed.
- (a) M. Mączka, A. Ciupa, A. Gągor, A. Sieradzki, A. Pikul, B. Macalik and M. Drozd, Inorg. Chem., 2014, 53, 5260 CrossRef PubMed; (b) A. Ciupa, M. Mączka, A. Gągor, A. Pikul, E. Kucharska, J. Hanuza and A. Sieradzki, Polyhedron, 2015, 85, 137 CrossRef CAS.
- A. Rossin, M. R. Chierotti, G. Giambiastiani, R. Gobetto and M. Peruzzini, CrystEngComm, 2012, 14, 4454 RSC.
- (a) M. Mączka, K. Pasińska, M. Ptak, W. Paraguassu, T. A. da Silva, A. Sieradzki and A. Pikul, Phys. Chem. Chem. Phys., 2016, 18, 31653 RSC; (b) M. Mączka, A. Gągor, M. Ptak, W. Paraguassu, T. A. da Silva, A. Sieradzki and A. Pikul, Chem. Mater., 2017, 29, 2264 CrossRef.
- M. Mączka, A. Pietraszko, L. Macalik, A. Sieradzki, J. Trzmiel and A. Pikul, Dalton Trans., 2014, 43, 17075 RSC.
- M. Mączka, B. Bondzior, P. Dereń, A. Sieradzki, J. Trzmiel, A. Pietraszko and J. Hanuza, Dalton Trans., 2015, 44, 6871 RSC.
- M. Ptak, M. Mączka, A. Gągor, A. Sieradzki, A. Stroppa, D. Di Sante, J. M. Perez-Mato and L. Macalik, Dalton Trans., 2016, 45, 2574 RSC.
- A. Sieradzki, J. Trzmiel, M. Ptak and M. Mączka, Electron. Mater. Lett., 2015, 6, 1033 CrossRef.
- M. Ptak, M. Mączka, A. Gągor, A. Sieradzki, B. Bondzior, P. Dereń and S. Pawlus, Phys. Chem. Chem. Phys., 2016, 18, 29629 RSC.
- G. M. Sheldrick, Acta Crystallogr., 2008, A64, 112 CrossRef PubMed.
- A. Sieradzki, S. Pawlus, S. N. Tripathy, A. Gągor, A. Ciupa, M. Mączka and M. Paluch, Phys. Chem. Chem. Phys., 2016, 18, 8462 RSC.
- M. Ptak, M. Mączka, A. Gągor, P. Głuchowski and L. Macalik, J. Mater. Chem. C, 2016, 4, 1019 RSC.
- (a) M. Mączka, A. Pietraszko, B. Macalik and K. Hermanowicz, Inorg. Chem., 2014, 53, 787 CrossRef PubMed; (b) M. Mączka, P. Kadłubański, P. T. C. Freire, B. Macalik, W. Paraguassu, K. Hermanowicz and J. Hanuza, Inorg. Chem., 2014, 53, 9615 CrossRef PubMed; (c) M. Mączka, K. Szymborska-Małek, A. Ciupa and J. Hanuza, Vib. Spectrosc., 2015, 77, 17 CrossRef; (d) M. Mączka, T. A. Da Silva, W. Paraguassu, M. Ptak and K. Hermanowicz, Inorg. Chem., 2014, 53, 12650 CrossRef PubMed.
- (a) A. Ciupa and M. Ptak, Vib. Spectrosc., 2016, 86, 67 CrossRef CAS; (b) K. Szymborska-Małek, M. Trzebiatowska-Gusowska, M. Mączka and A. Gągor, Spectrochim. Acta, Part A, 2016, 159, 35 CrossRef PubMed.
- R. D. Shannon, Acta Crystallogr., Sect. A: Cryst. Phys., Diffr., Theor. Gen. Crystallogr., 1976, 32, 751 CrossRef.
- M. Sánchez-Andújar, L. C. Gómez-Aguirre, P. Pato-Doldán, S. Yáñez-Vilar, R. Artiaga, A. L. Llamaz-Saiz, R. S. Manna, F. Schnelle, M. Lang, F. Ritter, A. A. Haghighirad and M. A. Señaris-Rodriguez, CrystEngComm, 2014, 16, 3558 RSC.
- Z. Y. Du, T. T. Xu, B. Huang, Y. J. Su, W. Xue, C. T. He, W. X. Zhang and X. M. Chen, Angew. Chem., Int. Ed., 2015, 54, 914 CrossRef CAS PubMed.
- X. H. Zhao, X. C. Huang, S. L. Zhang, D. Shao, H. Y. Wei and X. Y. Wang, J. Am. Chem. Soc., 2013, 135, 16006 CrossRef CAS PubMed.
- Z. Y. Du, Y. Z. Sun, S. L. Chen, B. Huang, Y. J. Su, T. T. Xu, W. X. Zhang and X. M. Chen, Chem. Commun., 2015, 51, 15641 RSC.
- F. Auzel and Y. H. Chen, J. Lumin., 1995, 66–67, 224 CrossRef.
- F. Pellé and F. Auzel, J. Lumin., 1998, 76–77, 623 CrossRef.
Footnote |
| † Electronic supplementary information (ESI) available: Fig. S1–S15: powder X-ray diffraction, DSC curves, detailed Raman and IR spectra at room temperature, temperature-dependent IR and Raman spectra, temperature dependencies of wavenumbers and FWHMs of selected Raman and IR bands, geometrical parameters of MIO6 and MIIIO6 octahedra, and emission spectrum of EtAKCr at 300 K. Tables S1–S5: crystal data and refinement results, selected geometric parameters for structure refinement, Raman and IR wavenumbers at 300 and 80 K together with assignment, and lines observed in emission spectra at 10 K. CCDC 1520954–1520956. For ESI and crystallographic data in CIF or other electronic format see DOI: 10.1039/c7cp01336a |
| This journal is © the Owner Societies 2017 |