 Open Access Article
Creative Commons Attribution 3.0 Unported Licence
Pair natural orbital and canonical coupled cluster reaction enthalpies involving light to heavy alkali and alkaline earth metals: the importance of sub-valence correlation†
Yury
Minenkov
*a,
Giovanni
Bistoni
b,
Christoph
Riplinger
b,
Alexander A.
Auer
b,
Frank
Neese
*b and
Luigi
Cavallo
 *a
*a
aPhysical Sciences and Engineering Division, King Abdullah University of Science and Technology, KAUST Catalysis Center, Thuwal 23955-6900, Saudi Arabia. E-mail: Yury.Minenkov@kaust.edu.sa; Luigi.Cavallo@kaust.edu.sa
bDepartment of Molecular Theory and Spectroscopy, Max Planck Institute for Chemical Energy Conversion, Stiftstr. 34-36, D-45470 Mülheim an der Ruhr, Germany. E-mail: Frank.Neese@cec.mpg.de
First published on 7th March 2017
Abstract
In this work, we tested canonical and domain based pair natural orbital coupled cluster methods (CCSD(T) and DLPNO-CCSD(T), respectively) for a set of 32 ligand exchange and association/dissociation reaction enthalpies involving ionic complexes of Li, Be, Na, Mg, Ca, Sr, Ba and Pb(II). Two strategies were investigated: in the former, only valence electrons were included in the correlation treatment, giving rise to the computationally very efficient FC (frozen core) approach; in the latter, all non-ECP electrons were included in the correlation treatment, giving rise to the AE (all electron) approach. Apart from reactions involving Li and Be, the FC approach resulted in non-homogeneous performance. The FC approach leads to very small errors (<2 kcal mol−1) for some reactions of Na, Mg, Ca, Sr, Ba and Pb, while for a few reactions of Ca and Ba deviations up to 40 kcal mol−1 have been obtained. Large errors are both due to artificial mixing of the core (sub-valence) orbitals of metals and the valence orbitals of oxygen and halogens in the molecular orbitals treated as core, and due to neglecting core–core and core–valence correlation effects. These large errors are reduced to a few kcal mol−1 if the AE approach is used or the sub-valence orbitals of metals are included in the correlation treatment. On the technical side, the CCSD(T) and DLPNO-CCSD(T) results differ by a fraction of kcal mol−1, indicating the latter method as the perfect choice when the CPU efficiency is essential. For completely black-box applications, as requested in catalysis or thermochemical calculations, we recommend the DLPNO-CCSD(T) method with all electrons that are not covered by effective core potentials included in the correlation treatment and correlation-consistent polarized core valence basis sets of cc-pwCVQZ(-PP) quality.
1 Introduction
The CCSD(T) method1 is recognized as the gold standard of contemporary electronic structure theory.2,3 In its canonical form and with all electrons included in the correlation treatment, CCSD(T) allows one to achieve chemical accuracy in relative electronic energies without any calibration against experimental data as long as the effects of static correlation in the system are sufficiently small. The main shortcoming of this protocol is that it can only be applied to relatively small systems, since it scales as N7 with N being a measure of system size.There are two main approximations to reduce the prohibitive computational cost and make routine CCSD(T) calculations feasible for systems of practical interest. The first approximation takes advantage of resolution of identity (RI) techniques and new algorithms for the two-electron integral transformation4–7 together with the careful exploitation of localized molecular orbitals8–11 to optimize the selection of the most relevant excitations.12–15 In particular, the so-called domain based pair natural orbitals DLPNO-CCSD(T) method9–10,16 is especially promising for large-scale computational chemistry applications given its accuracy, efficiency, robustness and ready availability.17 The second approximation is the so called “frozen core” (FC) approach, when only valence orbitals are included in the correlation treatment, thus reducing the computational cost dramatically. Usually, this approach is physically sound since dynamic correlation in the core electrons does not affect relative energies significantly. Taken together, the DLPNO-CCSD(T) in conjunction with the FC approach enables coupled cluster calculations on molecules containing hundreds of heavy atoms.
The accuracy of the first approximation has been tested in several studies,7,15,18–20 and the main conclusion is that with tight pair natural orbital (PNO) settings as part of the DLPNO-CCSD(T) algorithm, the accuracy of the canonical CCSD(T) approximation can be approached to within a fraction of a kcal mol−1. By contrast, systematic calculations21–27 of the heats of formation via CCSD(T)-based composite schemes have revealed that in several cases the FC approach results in deviations up to 30–40 kcal mol−1 with respect to the experimental data. Thus, Radom and co-workers22,23 have found that G228,29 QCISD(T) and CCSD(T) methods fail to reproduce the experimental heats of formation of several highly polar oxides and hydrides of alkali (Li–K) and alkaline earth (Be–Ca) metals, with errors greater than 25 kcal mol−1. The authors found that expanding the correlation space on the metals from the default “frozen core” approach, which includes only valence electrons, to a “reduced frozen core” approach, thus including also sub-valence electrons, drastically improves the situation. For K and Ca compounds, inclusion of the sub-valence 3s and 3p orbitals turned out to be essential. The most accurate results have been obtained with the correlation consistent core–valence basis sets (cc-pwCVnZ) of Peterson and co-workers.30,31 Moreover, the poor performance of the standard frozen core approach for complexes involving alkaline and alkaline-earth metals has been documented earlier by Martin et al.32 Similarly, Bauschlicher and co-workers have demonstrated that the standard frozen core approximation leads to large errors in G2 atomization energies of Ga oxides and fluorides.21 Such errors appear due to inversion of the Ga 3d core orbital and the 2s valence orbitals of O or F. Adding the Ga 3d orbital to the correlation treatment significantly improved the situation. Finally, Dixon and co-workers have shown that the Hf 4f core orbitals can mix with the valence orbitals of oxygen and fluorine, leading to errors in the heat of formation of the corresponding binary compounds.33 This is especially disappointing as the Hf 4f orbitals have been included in the widely used fully relativistic Stuttgart–Dresden effective core potential (ECP),34 which is used with the corresponding core–valence cc-pwCVnZ-PP basis set of Peterson and co-workers.34 The only way to include 4f Hf electrons in the correlation is through the application of the scalar-relativistic all electron basis set developed by Peterson and co-workers,34 which results in very large computational time even with the cc-pwCVTZ-DK basis set. To overcome these issues, an automatic procedure has been proposed by Austin et al.25 In this approach, an overlap criterion is introduced that connects the detection of core orbitals in the molecule, which might be difficult sometimes, to that in the isolated atoms, which is well defined. The procedure has been shown to remove errors arising from the inconsistent treatment of the core orbitals in gallium fluorides.21 In addition, the scheme was shown to be able to identify strong mixing between core and valence orbitals, which also might result in large errors, and can only be ameliorated by extension of the correlation space. Thus, there is evidence to suspect that in a significant number of cases, the frozen core approach can deteriorate the results. That is why practically all contemporary composite schemes,35–38 in particular the correlation consistent composite approach (ccCA) of Wilson and co-workers,39 the Feller–Peterson–Dixon (FPD) approach27,35–37 and the Weizmann-n theories,40 involve a step in which all sub-valence electrons are included in the correlation treatment, although sometimes with only triple-ζ quality basis sets due to reasons of affordability.
It has to be noted that despite documented failures, the standard FC approach is still default in many quantum chemistry computer codes such as ORCA,17 Priroda41 and Gaussian.42 Truhlar and co-workers have shown that the frozen core approach is not responsible for the failures of CCSD(T) in reproducing the experimental bond dissociation energies of small molecules of 1st row transition metals.43 Subsequent studies indicated that the documented failure can be related to insufficiently large basis sets.44,45 Indeed, we have recently shown that many reaction enthalpies involving transition metals were not affected by the frozen core approach18,46 We do not exclude that in many cases the surprisingly good performance of the FC approach might result from the lucky cancellation of errors from neglecting core and core–valence correlation in both reactants and products. However, few reactions turned out to be very sensitive to the frozen core settings, leading to errors of 30–40 kcal mol−1 when the default FC settings were used, for example reactions of ZrF4 with Cl2, Br2 or I2.
One way to address these issues and to preserve the performance of the CCSD(T) method is to carefully examine the molecular orbitals in the system and manually set up the orbitals included in the correlation treatment. While this strategy can lead to reliable results at only somewhat higher computational costs, the application of CCSD(T) as a black-box method is lost. If the scope of the work is examining and comparing several systems, for example when building reaction pathways, the calculations become impractical again.
An alternative to manual orbital selection is inclusion of all the electrons involved in the SCF procedure also in the post-SCF correlation treatment. Despite the increased computational costs compared to manual orbital selection, it preserves black-box application of the CCSD(T) method to routine calculations.
In this work we have carefully selected reaction enthalpies for which the effects from core correlation could be large for various reasons, including (a) only a few valence electrons on the metal, (b) high-lying ‘core’ orbitals or (c) high ionicity of the bonds (e.g. see the ligand exchange reactions of ZrF4 studied previously46). These are 32 inorganic ligand exchange and association reactions involving halides, hydrides and oxides of non-transition metals (Li, Be, Na, Mg, Ca, Sr, Ba and Pb) for which accurate experimental gas phase enthalpies are available. The effect of the FC approximation has been inspected for all the reactions by comparisons with all electron results and experimental values. Alongside with canonical CCSD(T), the quality of the DLPNO-CCSD(T) approximation has been investigated for its ability to recover the effects of core correlation.
2 Computational details
2.1 Geometry optimization
All geometry optimizations were performed with the GGA PBE47,48 functional and the all electron triple-ζ-quality basis sets λ249 as implemented in the Priroda 13 suite of programs.41 Scalar relativistic effects were taken into account via the Dyall Hamiltonian.50 The default adaptively generated Priroda grid, corresponding to an accuracy of the exchange–correlation energy per atom (1 × 10⁻⁸ Hartree), was decreased by a factor of 100 for more accurate evaluation of the exchange–correlation energy. Default values were used for the self-consistent-field (SCF) convergence and the maximum gradient for geometry optimization criterion (1 × 10⁻⁴ au), whereas the maximum displacement geometry convergence criterion was decreased to 0.0018 au. Geometries were characterized as true energy minima by the eigenvalues of the analytically calculated Hessian matrix. Translational, rotational, and vibrational partition functions for thermal corrections to arrive at total enthalpies were computed within the ideal-gas, rigid-rotor, and harmonic oscillator approximations. The temperature used in the calculations of thermochemical corrections was set to 298.15 K in all the cases.2.2 Single-point energy evaluations
All single-point energy evaluations were performed with canonical CCSD(T) as well as DLPNO-CCSD(T) methods as implemented in the ORCA suite of programs.17 The tight PNO settings (TCutPairs = 10−5, TCutPNO = 1 × 10⁻⁷, TCutMKN = 10−3) were used to reduce any numerical noise in the calculations. The default SCF convergence criterion NormalSCF (energy change 1 × 10⁻⁶ au) was replaced with tighter VeryTightSCF (energy change 1 × 10⁻⁹ au) to achieve better converged wave-functions. In some cases, this led to fewer subsequent CCSD iterations.For all-electron calculations, some special precautions need to be taken in order to achieve high accuracy in DLPNO-CCSD(T) calculations relative to calculations involving only valence electrons. These led to some minor modifications in the procedure that will be detailed elsewhere51 and will be included in the upcoming ORCA 4.0 release. In practice, for the electron pairs containing core electrons, a lower TCutPNO threshold must be used in order to include a sufficient number of virtual orbitals in the correlation treatment. In the present work, a TCutPNO value of 10−9 has been used for the electron pairs containing at least one core electron.
To explore the impact of tighter PNO settings on the computational efficiency of the DLPNO-CCSD(T) approximation compared to canonical CCSD(T), the wall execution times for the CCSD(T)(AE), CCSD(T)(FC), DLPNO-CCSD(T)(AE) and DLPNO-CCSD(T)(FC) protocols, using the PbI2 molecule (ECPs on Pb and I with cc-pwCVQZ-PP basis sets) as the test case, were measured. These calculations were carried out using a single computer node under Linux OS with the following hardware details: HP DL585 G7 Quad sockets AMD Opteron 6376, 16 cores/socket 2.3GHz, 1.5 Terabyte of random access memory (RAM). In all calculations we used 32 physical cores with 20 Gb of RAM per core, resulting in total used RAM of 640 Gb. The rest of RAM was used to emulate the hard drive (/dev/shm/) to speed up all I/O operations. All the calculations started exactly from the same HF wave function and no SCF iteration was performed (noiter keyword). As expected, the DLPNO-CCSD(T)(FC) calculation turned out to be the fastest and took 2825 s. We set this as the reference time. The CCSD(T)(FC) calculation took exactly two times longer, which results in a ratio in the wall execution times of 2.0. The DLPNO-CCSD(T)(AE) calculation is 3.8 times slower, indicating that inclusion of all the electrons in the correlation comes at a certain price. Finally, the CCSD(T)(AE) calculation is 8.4 times slower. Summing up these results indicates that the DLPNO scheme with tight PNO settings is two times faster compared to the canonical CCSD(T) protocol. It should be pointed out that for small systems with only three atoms the DLPNO approximation is not expected to significantly speed up the CCSD(T) calculations. Due to the linear scaling of DLPNO-CCSD(T) and the N7 scaling of canonical CCSD(T), however, the speedup of the DLPNO approximation is becoming significant for systems with more than five to ten heavy atoms. Already for medium sized systems with more than 30 to 40 atoms, canonical CCSD(T) calculations are not feasible at all, whereas DLPNO-CCSD(T) calculations are carried out in a routine fashion on large systems with several hundreds of atoms.10,16
| EXHF = E∞HF + αe−1.63X | (1) |
| EXcorl = E∞corl + βX−3 | (2) |
The total enthalpy at the CBS limit for each reaction (A + B → C + D) was evaluated via the following equation:
| ΔH0CCSD(T) = E∞HF(C) + E∞corl(C) + HPBEcorr(C) + E∞HF(D) + E∞corl(D) + HPBEcorr(D) − (E∞HF(A) + E∞corl(A) + HPBEcorr(A) + E∞HF(B) + E∞corl(B) + HPBEcorr(B)). | (3) |
2.3 The benchmark set
To accurately benchmark electronic structure theory methods, high quality gas phase experimental data are requested. Gas phase formation enthalpies of many compounds, among which are 1 and 2 group metal complexes as well as Pb(II), are measured and tabulated,67,68 and are used as benchmarks.69–75 In this work, however, we do not try to reproduce the absolute formation enthalpies for a few reasons. First, direct calculation of heats of formation via atomization schemes cannot be done via the DLPNO-CCSD(T) method, which is only available for singlet ground states so far, while many atoms have open-shell ground states. Second, direct calculation of formation enthalpies via atomization schemes often leads to larger errors compared to the reaction-based schemes since electron correlation energies in atoms and molecules are very different and no error-compensation can be expected.2 To overcome these difficulties, we created reaction datasets from experimentally obtained individual formation enthalpies and validated the electronic structure methods against these datasets (Table 1).| Entry | Expt ΔHf (298.15) | Av. expt ΔHf (298.15) (kcal mol−1) | Lit. CCSD(T) ΔHf (298.15)a (kcal mol−1) |
|---|---|---|---|
| a Calculated via the atomization scheme. | |||
| Group 1 | |||
| LiH | 33.61 ± 0.01;68 33.4 ± 0.4;81 33.7677 | 33.6 (−0.6; +0.2) | (33.2; 33.3 ± 0.1)82 |
| LiF | −81.45 ± 2.0;68 −81.5 ± 0.8;81 −80.977 | −81.3 (−2.2; 1.8) | (−81.4; −81.3 ± 0.3)82 |
| LiCl | −46.78 ± 3.011;68 −46.3 ± 1.0;81 −46.877 | −46.6 (−3.2; 2.8) | (−46.1; −45.7 ± 0.4)82 |
| LiBr | −36.81 ± 3.11;68 −36.1 ± 1.0;81 −36.377 | −36.4 (−3.5; 2.7) | |
| LiI | −21.8 ± 2.0;68 −20.4 ± 2.0;81 −20.777 | −21.0 (−2.8; 2.6) | |
| NaF | −69.42 ± 0.5;68 −70.54 ± 1.0;81 −70.177 | −70.0 (−1.5; 1.1) | −69.782 |
| NaCl | −43.36 ± 0.50;68 −43.4 ± 0.72;81 −43.5877 | −43.4 (−0.7; 0.7) | −43.182 |
| NaBr | −34.4 ± 0.50;68 −34.9 ± 0.72;81 −36.177 | −35.1 (−1.0; 1.2) | |
| NaI | −21.7 ± 0.72;81 −18.177 | −19.9 (−2.5; 1.8) | |
| Group 2 | |||
| Be | 77.44 ± 1.20;68,83 78.077 | 77.7 (−1.5; +0.9) | |
| BeF2 | −190.25 ± 1.0;68 −189.7;76,77 −190.34 ± 1.083 | −190.1 (−1.2; 0.8) | −190.184 |
| BeCl2 | −86.09 ± 2.51;68 −85.7;76,77 −86.36 ± 0.883 | −86.1 (−2.5; +2.5) | −86.584 |
| BeO | 32.6 ± 3.11;68 32.01 ± 2.63;83 30.677 | 31.7 (−2.3; +4.0) | 30.184 |
| Mg | 35.16 ± 0.19;68,83 35.0 ± 0.377 | 35.1 (−0.4; +0.2) | |
| MgF2 | −173.70 ± 0.79;68 −176.03 ± 1.2;83 −173.2 ± 1.577 | −174.3 (−2.9; 2.6) | −174.484 |
| MgCl2 | −93.8 ± 0.50;68 −95.2 ± 1.2;83 −95.777 | −94.9 (−1.5; 1.6) | −95.184 |
| MgBr2 | −72.39 ± 2.51;68 −72.1 ± 3.6;83 −74.6 ± 377 | −73.0 (−4.6; 4.5) | |
| MgI2 | −38.3 ± 2.51;68 −39.2 ± 3.6;83 −41.0; −40.777 | −39.8 (−3.0; 4.2) | |
| Ca | 42.50 ± 0.20;68,83 42.6 ± 0.477 | 42.6 (−0.4; 0.4) | |
| CaF2 | −187.5 ± 1.91;68 −186.3 ± 3.0;76,77 −189.0 ± 1.6;83 −186.877 | −187.4 (−3.2; 4.1) | −189.184 |
| CaBr2 | −92 ± 2.0;68 −93.5 ± 3;76,77 −92.83 ± 2.2;83 −94.6;77 −92.577 | −93.1 (−3.4; +3.1) | |
| Sr | 39.20 ± 0.41;68 38.36 ± 0.48;83 39.177 | 38.9 (−1.0; 0.7) | |
| SrF2 | −184.4 (−4.8; 2.3) | ||
| SrCl2 | −183.1 ± 1.00;68 −187.57 ± 1.60;83 −182.7; −186.077 | −114.6 (−3.4; 3.0) | |
| SrBr2 | −113.09 ± 1.51;68 −112.6;76,77 −116.4 ± 1.60;83 −114.9; −116.177 | −98.1 (−2.9; 4.3) | |
| SrI2 | −97.30 ± 3.01;68 −96.01 ± 2.63;83 −98;77 −101.076,77 | −65.1 (−2.9; 2.9) | |
| Ba | −65.70 ± 1.51;68 −65.1 ± 2.87;83 −65;77 −64.777 | 43.1 (−1.5; +0.9) | |
| BaF2 | 42.81 ± 1.20;68 42.78 ± 1.0;83 43.877 | −192.2 (−1.8; +3.6) | |
| BaCl2 | −192.10 ± 1.51;68 −191.21 ± 2.7;83 −192.577 | −118.4 (−3.1; +4) | |
| BaO | −119.20 ± 1.6;68 −116.7 ± 2.3;83 −119.5 ± 1; −118.377 | −30.4 (−2.0; +2.9) | |
| Pb(II) | |||
| PbCl2 | −41.6 ± 0.3;68 −41.5 ± 1.0;76,77 −42.0 ± 1.278 | −41.7 (−1.5; 1.2) | −44.980 |
| PbBr2 | −24.95 ± 1.5;68 −25.276,77 | −25.1 (−1.4; 1.6) | |
| PbI2 | −0.76 ± 1.0;68 −2.08 ± 1.276,77 | −1.4 (−1.9; 1.6) | |
| Complexes to equilibrate reactions | |||
| H2 | 0 | ||
| F2 | 0 | ||
| Cl2 | 0 | ||
| Br2 | 7.388 ± 0.02668 | ||
| I2 | 14.92 ± 0.01968 | ||
| H2O | −57.799 ± 0.0168 | ||
| HF | −65.14 ± 0.1968 | ||
| HCl | −22.06 ± 0.0568 | ||
| HBr | −8.71 ± 0.0468 | ||
| HI | 6.30 ± 0.0568 | ||
The enthalpies used to build the reaction datasets have to be accurate, since the overall uncertainty for the reaction enthalpy will be the algebraic sum of the uncertainties of reactants and products. Due to these circumstances, in this work we only used the experimental formation enthalpies of 1 and 2 group metal complexes for which few experimental measurements exist and agree with each other. Then, the resulting formation enthalpies were taken as average of all available experimental measurements. Only the enthalpies with an error bar smaller than 4.6 kcal mol−1 were taken. Moreover, the experimental enthalpies for which a large (>5 kcal mol−1) disagreement with CCSD(T) calculations in the literature were detected have been excluded from analysis. For example, the experimental formation enthalpy for PbF2 is ca. −104.2 (−104.0 ± 2.0;68 −104.5 ± 2.0;76,77 −102.4 ± 2.2;78 −106.079) while theoretical CCSD(T) calculations of Dixon et al.80 predicted this enthalpy to be −110.7 kcal mol−1. We combined these enthalpies to obtain the overall uncertainties in reaction enthalpies (±5 kcal mol−1). In order to evaluate the error bars for reaction enthalpies we proceeded as follows. For every reaction A + B → C + D, first the formation enthalpies of C and D were taken at their overestimated values, while for A and B the formation enthalpies were taken at their underestimated values. For example, if the formation enthalpy of C is 5.0 ± 2.0 kcal mol−1, we took it as 7.0 kcal mol−1 and if the formation enthalpy of A is 3.0 ± 2.0 we took it as 1.0 kcal mol−1. Then, we did the inverse, namely the formation enthalpies of C and D were taken at their underestimated values, while for A and B the formation enthalpies were taken at their overestimated values. The reaction enthalpies were taken at the average of these estimates, and uncertainties corresponded to the lowest and highest reaction enthalpies. This methodology allows us to consider in all reactions the most pessimistic error bars for both highest and lowest uncertainties. The reaction enthalpies are tabulated in the ESI,† and are also available at the url: http://https://sites.google.com/site/theochemdatasets/reaction-enthalpies.
2.4 Calculation of errors
To gauge the deviation of the theoretical reaction enthalpies from their experimental counterparts, we used the two common protocols based on the mean unsigned error (MUE = |ΔH(exp.) − ΔH(theo.)|) and the mean signed error (MSE = ΔH(exp.) − ΔH(theo.)). Simultaneous analysis of both MUE and MSE is necessary to make a conclusion on the ability of the method to provide the absolute reaction enthalpies and on its predictive ability. Clearly, if both MUE and MSE approach zero, then the method can be recommended for absolute values and thus predictions. This is the best scenario. If MUE is large and MSE is equally large (either positive or negative), then the method cannot be recommended for estimation of absolute reaction enthalpies. However, it still can be used for predictions, since in some instances trends are more important than absolute values. Finally, the worst scenario is large MUE and vanishing MSE, when the method cannot be recommended either for accurate absolute enthalpies or for the relative values.2.5 Core correlation options
In the current work the influence of the core correlation settings on the reaction enthalpies was investigated. With the cc-pwCVnZ(-PP) correlation consistent basis sets the two frozen-core options were tested. In the first option, FC (frozen core), all non-ECP electrons were included in the SCF part and only non-noble gas electrons were included in the post-HF procedure. For example, for calcium, 20 electrons were included in the SCF treatment and only 2 electrons were included in the post-HF treatment ([Ar] configuration is frozen). For Pb the 6s26p2 electrons were treated as valence, i.e. included in the correlation treatment, while 5s25p65d10 electrons were frozen. In the second option, AE (all electron), all non-ECP electrons (e.g. 20 for calcium) were included in both the SCF and correlation treatment. The summary of these two methods can be found in Table 3.Obviously, the AE protocol is computationally more demanding while the FC protocol is the most computationally effective. Which protocol provides the best accuracy/CPU cost ratio will be investigated in the current work.
2.6 Selection of core orbitals
By default, molecular orbitals (MOs) are ordered with respect to their orbital energies. The N lowest energy MOs, where N is the sum of core orbitals over all atoms, define the core region. All MOs with higher orbital energy define the valence region. If frozen core settings are not chosen carefully, the default ordering can lead to inversion of (physical) core and valence orbitals. A routine was implemented that detects and repairs inversion of core and valence orbitals and detects mixing of core orbitals with core or valence orbitals. The routine is described in the following.First, for each atom type, the sum of core orbitals is calculated, based on the number of frozen core electrons per atom type. Next, for each MO, the Mulliken population per atom and angular momentum is computed. Each MO is then assigned to the atom type that has maximum Mulliken population. All MOs are then investigated in the order of their orbital energy, starting with the lowest energy MO. A MO is considered a core MO if the sum of core orbitals for its parent atom type has not yet been reached. All other MOs are considered valence MOs. After this assignment it is checked whether MOs that are found in the core region are considered valence MOs and whether MOs that are found in the valence region are considered core MOs. If such a case is found, it is corrected by inverting the ordering of the respective MOs. If a MO is considered a core MO and if only less than 90% of its Mulliken population is assigned to one combination of atom type and angular momentum, then a warning is printed that significant mixing is present. If such warning on orbital mixing is detected, the calculation might optionally be stopped just after initial (HF) wave function analysis to prevent subsequent computationally expensive post-HF part.
3 Results and discussion
3.1 Benchmark of the basis sets/auxiliary basis sets
A wide range of basis sets have been optimized and extensively tested in conjunction with highly correlated methods and the FC approach. On the other hand, in this context, basis sets for AE calculations are by far not that common and are much less tested. The same problem occurs for the auxiliary basis set to be used in the DLPNO calculations.In this section, a preliminary study on the performance of Ahlrichs, Sapporo and correlation consistent basis set families for all-electron CCSD calculations has been carried out. For each family, the performance of triple- and quadruple-ζ basis sets in describing the different components of the correlation energy has been tested (see Table 4 for a summary of the basis sets used and of the corresponding labels). The effect of the auxiliary basis set to be used in the DLPNO-CCSD case has also been investigated.
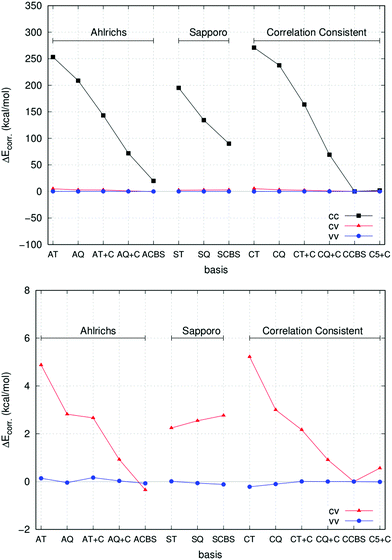
A prerequisite for a suitable description of core-correlation effects in a chemical process is the accurate treatment of the core–core (cc), core–valence (cv) and valence–valence (vv) components of the correlation energy for the atoms involved in the reaction. Therefore, as a first prototype study case, we report in the following the basis set convergence behaviour of the different contributions of the CCSD correlation energy for the Ca atom. The results are summarized in Fig. 1.
In all cases, extrapolated values from correlation consistent basis sets (CCBS, see Table 4) have been used as reference (see Section 2.2.3 for details about the extrapolation technique). In this study, core and valence electrons have been defined in accordance with the so-called “chemical-core” used in ORCA 3.0 in the frozen-core approach,87 and the correlation energy has been divided accordingly. Therefore, all electrons are labelled as “core” but the ones in the outermost 4s orbital.
As expected, the largest deviation is in the core–core correlation energy for all basis sets (upper panel of Fig. 1), while the remaining contributions are comparatively much closer to the CCBS reference. The Ahlrichs’ and correlation consistent basis sets provide very similar performance and the inclusion of Peterson's weighted core–valence functions significantly improves the results in both cases. Remarkably enough, the very large cc-pwCV5Z basis set gives values that are very close to the CCBS reference. This is true also for the core–valence and valence–valence components of the correlation energy, as shown in the lower panel of Fig. 1. Interestingly, the Sapporo basis sets provide much smaller correlation contributions and will not be used for routine calculations in this work.
These preliminary results suggest to test the performance of correlation consistent basis sets, in conjunction with the extrapolation scheme described in Section 2.2.2, on a wider range of situations (see Section 3.2). We recall here that, for most of the atoms studied in this work, these basis sets are used in conjunction with small-core pseudopotentials (the cc-pwCVNZ-PP set, see Section 2.2.1 for details). It is worth mentioning that in cc-pwCVnZ basis sets for Na, Mg, Cl and Ca, the deep core electrons, namely 1s for Na, Mg and Cl and 1s2s2p for Ca, are described with single contracted Gaussian functions not directly optimized to be used in calculations including electron correlation. Therefore, the use of this family of basis sets in AE calculations is, in principle, not absolutely rigorous. However, we expect that the error introduced by using cc-pwCVnZ basis sets in AE calculations is small as deep core electrons are inert and do not participate in chemical bonding. Indeed, additional calculations performed with the “reduced” frozen core approximation, in which in addition to all valence electrons only the sub-valence (not deep core) electrons on the metal were correlated, resulted in reaction enthalpies very close to those from the AE calculations in which all the electrons were correlated (vide infra).
As already mentioned, the DLPNO-CCSD method relies on the RI approximation, and the quality of the auxiliary basis set used in the calculation strongly affects the overall accuracy. In general, the auxiliary basis sets def2-tzvpp/C and def2-qzvpp/C, available for most elements, perform well and can be used in conjunction with the corresponding triple- and quadruple-ζ basis sets. However, the accuracy of these auxiliary sets in conjunction with Peterson's basis sets in all-electron calculations needs to be tested.
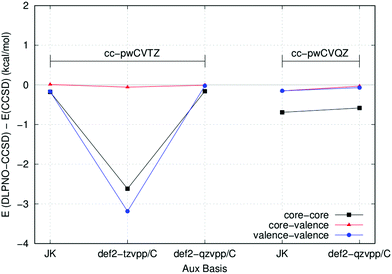
As a first example, we initially computed cc, cv and vv correlation energy contributions for the Ca atom at the all electron DLPNO-CCSD level using different auxiliary basis sets and TCutPNO = 0. With this TCutPNO threshold, DLPNO-CCSD and canonical CCSD are expected to give similar absolute energies, provided that the auxiliary basis set is good enough. Fig. 2 shows the error in the DLPNO-CCSD correlation energy terms with respect to canonical CCSD for different auxiliary basis sets.
For this atom, the error in the absolute energy between DLPNO-CCSD and canonical CCSD is very small with all auxiliary basis sets (note that relative energies are typically two orders of magnitude more accurate than absolute energies due to error cancellation). However, the error associated with the def2-tzvpp/C basis set in conjunction with cc-pwCVTZ is comparatively much larger. For this reason, the def2-qzvpp/C basis set will be used in the following in conjunction with both the cc-pwCVTZ and cc-pwCVQZ basis sets.
3.2 Statistical study
This section is organized as follows. First, the performance of the CCSD(T) method in its frozen core and all electron approaches in reproducing 9 reaction enthalpies involving 2nd period elements (Li, Be) is discussed. Second, we proceed to 11 reaction enthalpies of complexes of 3rd period elements (Na, Mg). After that we concentrate on 6 reaction enthalpies involving Ca and Sr complexes (2 group, 4th and 5th periods). Next, we comment on the performance obtained for 6th period heavy elements, Ba and Pb(II). Then, we discuss the overall performance obtained for the combined dataset involving all the 8 non-transition metals. Practical recommendations on the frozen core approach for chemistry of non-transition metals will be given.| No. | Reaction | Expt avg. ΔH° (298.15) (kcal mol−1) |
|---|---|---|
| 1 | LiH + F2 = LiF + HF | −180.0 (−2.6; 2.6) |
| 2 | LiH + Cl2 = LiCl + HCl | −102.3 (−3.4; 3.4) |
| 3 | LiH + Br2 = LiBr + HBr | −86.1 (−3.8; 3.4) |
| 4 | LiH + I2 = LiI2 + HI | −63.2 (−3.1; 3.3) |
| 5 | Be + F2 = BeF2 | −267.8 (−2.1; 2.3) |
| 6 | Be + Cl2 = BeCl2 | −163.8 (−3.4; 4.0) |
| 7 | Be + H2O = BeO + H2 | 11.8 (−3.2; 5.5) |
| 8 | BeF2 + Cl2 = BeCl2 + F2 | 104.0 (−3.3; 3.7) |
| 9 | BeF2 + H2O = BeO + F2 + H2 | 279.6 (−3.1; 5.2) |
| 10 | NaF + HCl = NaCl + HF | −16.5 (−2.0; 2.4) |
| 11 | NaF + HBr = NaBr + HF | −21.5 (−2.3; 2.9) |
| 12 | NaF + HI = NaI + HF | −21.3 (−3.9; 3.5) |
| 13 | NaCl + HBr = NaBr + HCl | −5.1 (−1.8; 2.0) |
| 14 | NaCl + HI = NaI + HCl | −4.9 (−3.3; 2.6) |
| 15 | NaBr + HI = NaI + HBr | 0.2 (−3.8; 2.9) |
| 16 | Mg + F2 = MgF2 | −209.4 (−3.1; 3.0) |
| 17 | Mg + Cl2 = MgCl2 | −130.0 (−1.7; 2.0) |
| 18 | Mg + Br2 = MgBr2 | −115.5 (−4.8; 4.9) |
| 19 | Mg + I2 = MgI2 | −89.8 (−3.2; 4.6) |
| 20 | MgF2 + Cl2 = MgCl2 + F2 | 79.4 (−4.1; 4.5) |
| 21 | Ca + F2 = CaF2 | −230.0 (−3.6; 4.5) |
| 22 | Ca + Br2 = CaBr2 | −143.1 (−3.8; 3.5) |
| 23 | Sr + F2 = SrF2 | −223.3 (−5.5; 3.3) |
| 24 | Sr + Cl2 = SrCl2 | −153.5 (−4.1; 4.0) |
| 25 | Sr + Br2 = SrBr2 | −144.4 (−3.6; 5.3) |
| 26 | Sr + I2 = SrI2 | −118.9 (−3.6; 3.9) |
| 27 | Ba + F2 = BaF2 | −235.2 (−2.7; 5.2) |
| 28 | Ba + Cl2 = BaCl2 | −161.5 (−4.0; 5.5) |
| 29 | Ba + H2O = BaO + H2 | −15.9 (−2.9; 4.4) |
| 30 | PbCl2 + Br2 = PbBr2 + Cl2 | 9.2 (−2.6; 3.2) |
| 31 | PbCl2 + I2 = PbI2 + Cl2 | 25.4 (−3.1; 3.1) |
| 32 | PbBr2 + I2 = PbI2 + Br2 | 16.2 (−3.6; 3.0) |
| Method | Orbitals in SCF | Orbitals in post-HF |
|---|---|---|
| a The noble gas core configuration is frozen and the corresponding orbitals are not included in the post-HF part. For example, for Ca, the [Ar] configuration is frozen. For Pb, the 6s26p2 electrons are treated as valence, i.e. included in the correlation treatment. | ||
| FC | All non-ECP | Noble gasa |
| AE | All non-ECP | All non-ECP |
| Label | Common name |
|---|---|
| a Peterson's core–valence functions54 have been used. | |
| Ahlrichs basis sets85 | |
| AT | def2-TZVP |
| AQ | def2-QZVP |
| AT + C | def2-TZVP + core-polarization functionsa |
| AQ + C | def2-QZVP + core-polarization functionsa |
| ACBS | Two-point def2-NZVP extrapolation (N = 3, 4), as detailed in Section 2.2.3. Core-polarization functions have been included |
| Sapporo basis sets86 | |
| ST | Nonrelativistic TZP (2012) + augmented functions |
| SQ | Nonrelativistic QZP (2012) + augmented functions |
| SCBS | Two-point SN extrapolation (N = 3, 4), as detailed in Section 2.2.3 |
| Correlation consistent basis set54 | |
| CT | cc-pVTZ |
| CQ | cc-pVQZ |
| CT + C | cc-pwCVTZ (cc-pVTZ + core-polarization functionsa) |
| CQ + C | cc-pwCVQZ (cc-pVQZ + core-polarization functionsa) |
| CCBS | Two-point cc-pwCVNZ extrapolation (N = 3, 4), as detailed in Section 2.23 |
| C5 + C | cc-pwCV5Z (cc-pV5Z + core-polarization functionsa) |
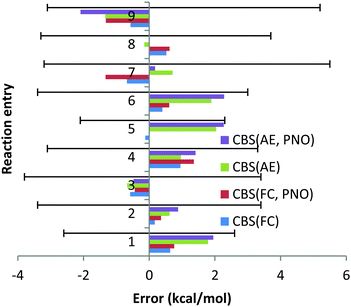
In general, the FC approach leads to somewhat smaller errors compared to the AE approach. In particular, for reactions (1), (5) and (6), the deviations in the reaction enthalpies are smaller by 1.2, 2.2 and 1.5 kcal mol−1, respectively, when the FC approach is applied. This perhaps counterintuitive conclusion can be explained by the fact that the deviations obtained with both FC and AE approaches are quite small and almost within the associated experimental uncertainties. Therefore, no statistically sound conclusion on the better performance of the frozen core approach can be made.
The excellent performance of the FC approach for the Li and Be reactions we studied suggests that no significant mixing between core and valence orbitals occurs and that all the core orbitals have been properly identified and isolated. In fact, only for one complex, LiBr, inversion of the molecular orbitals was needed: MO 10, mainly consisting of the 1s core orbital of Li, was replaced with MO 5, mainly consisting of the d orbital of Br. This means that, apart from LiBr, simple energy-based selection of the core orbitals would be sufficient.
Then, as no artificial mixing of the core and valence orbitals has been detected, the magnitude of the core–core (cc) and core–valence (cv) correlation effects can be derived from the direct comparison of the FC and AE reaction enthalpies. Thus, for reactions (2)–(4), (8) and (9), the cc and cv correlation effects turned out to be smaller than 1 kcal mol−1. Significantly larger cc and cv correlation effects have been found for reactions (1), (5), (6) and (7). The largest effect of the core correlation of 2.4 kcal mol−1 has been found for reaction (5), indicating that inclusion of the 1s orbital of Be in the correlation is essential. This means that inclusion of the core correlation is important for accurate thermochemistry of Li and Be complexes.
The DLPNO truncation almost does not affect the absolute reaction enthalpies (see the last paragraph of Section 3.3.5), since the difference between canonical CCSD(T) and DLPNO values is only within a fraction of a kcal mol−1. The largest deviation was obtained for reaction (9) and the AE approach, and amounts to 0.8 kcal mol−1 only.
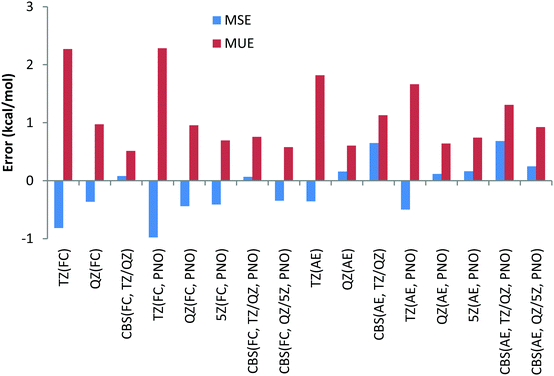
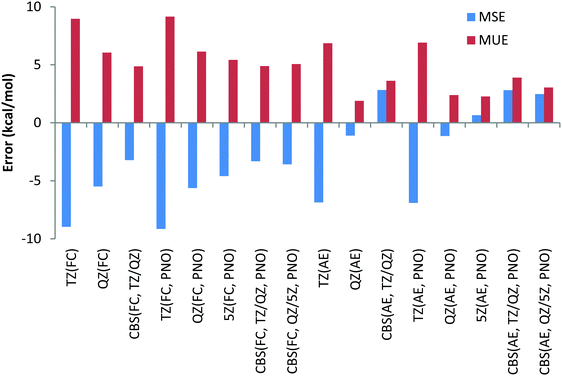
To have a more comprehensive vision, the overall performance obtained for the 9 Be and Li reactions is given in Chart 2 for both canonical and DLPNO CCSD(T) (PNO) methods with the FC and AE approaches and with the TZ, QZ, 5Z (for DLPNO only) and CBS (TZ, QZ) and CBS (QZ, 5Z) extrapolation schemes. Analysis of Chart 2 indicates again a slightly better performance of the FC approach and a negligible difference between canonical and DLPNO CCSD(T) results.
Another difference between the FC and AE schemes is related to the convergence with respect to the basis set size. Regardless of the core correlation settings, a noticeable decrease in both MUE and MSE is observed when going from the TZ to QZ basis set, as expected. When going from the QZ to 5Z basis set, marginal differences in the MUE/MSE are observed, indicating that the results are essentially converged with the QZ basis set. However, both TZ/QZ and QZ/5Z CBS extrapolation schemes lead to smaller errors compared to the QZ results only in the case of the FC approach. In the case of the AE scheme, even a slight increase of errors is observed compared to the QZ results. Noteworthily, the CBS extrapolation based on TZ/QZ basis sets results almost in the same MUE/MSE compared to the QZ/5Z scheme, requiring quite demanding 5Z calculations.
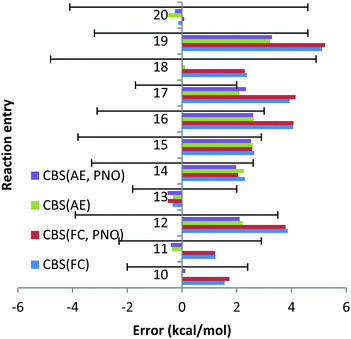
For reaction (12) the experimental uncertainty is (−3.9; 3.5) kcal mol−1. The CCSD(T)/CBS method with the AE and FC approaches results in deviations of 2.2 and 3.9 kcal mol−1, respectively, which are almost within the experimental uncertainty. Similar conclusions can be drawn for reaction (19) for which the experimental uncertainty (−3.2; 4.6) is comparable with the deviations obtained with the CCSD(T)/CBS scheme within the AE and FC approaches, 5.1 and 3.3 kcal mol−1.
For reactions (16) and (17) the deviations obtained with the CCSD(T)/CBS scheme within the FC approach of 4.1 and 3.9 kcal mol−1, respectively, turned out to be significantly larger compared to experimental uncertainties of (−3.1; 3) and (−1.7; 2.0) for these reactions. Meanwhile, the AE deviations are almost within the experimental uncertainties.
Inversion of the orbitals was required for complexes MgBr2, NaBr and NaI. In all cases the 2p core orbitals of Na and Mg turned out to be in the valence region. No significant mixing between core and valence orbitals has been revealed for Na and Mg complexes studied in this work, with all the core orbitals properly identified and isolated. Therefore, comparison of the FC and AE results can be used to evaluate core–core and core–valence correlation effects. Only for two reactions, reactions (13) and (20), the cc and cv correlation effects were found to be smaller than 1 kcal mol−1. For all other reactions, these effects turned out to be significantly larger. The largest deviation between FC and AE approximations was found for reaction (18) and amounted to 2.3 kcal mol−1, indicating the importance of including core (sub-valence) orbitals in the calculations.
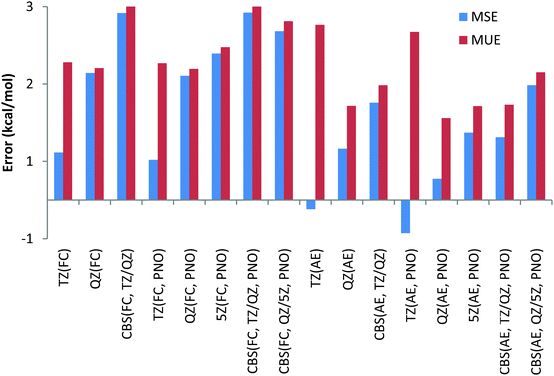
Thus, contrary to the Be and Li results, the FC approach in general results in larger deviations compared to the more CPU demanding AE scheme. This conclusion can also be drawn from Chart 4, where the overall performance obtained for the 11 Na and Mg reactions is given for both canonical and DLPNO coupled cluster methods with FC and AE approaches and with TZ, QZ, 5Z and CBS TZ/QZ and CBS QZ/5Z (for DLPNO) extrapolation schemes. The poor performance of the FC approach for Na and Mg has also been emphasized previously by Martin et al.32
Thus, CCSD(T)/CBS (FC) MUE is 2.5 kcal mol−1, which is 1 kcal mol−1 larger compared to CCSD(T)/CBS (AE) MUE. Another conclusion from the analysis of Chart 4 is that QZ results for all the method combinations provide the smallest deviations, making the use of relatively large 5Z basis sets and the CBS extrapolation schemes TZ/QZ and QZ/5Z redundant, at least for the reactions in this study. As previously found for Be and Li complexes, only a negligible difference, a fraction of a kcal mol−1, is found between DLPNO and canonical coupled cluster methods.
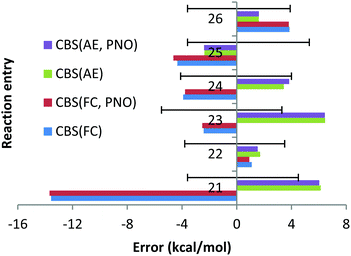
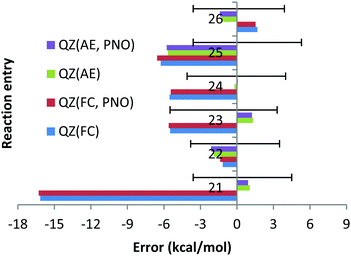
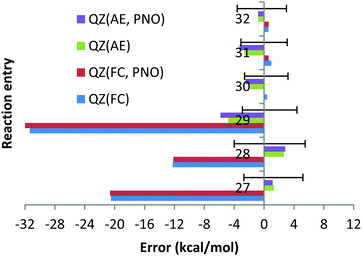
However, the deviation obtained with the QZ basis set is only 1.1 kcal mol−1 (see Chart 6). At the same time, the CCSD(T)/QZ FC MUE is 16.2 kcal mol−1, indicating clearly that the FC approach rather than the CBS extrapolation scheme is responsible for the failure. Interestingly, for reaction (23) the AE approach results in a deviation of 6.5 kcal mol−1, which is clearly larger than 2.4 kcal mol−1 obtained with the FC approach and cannot be explained by the experimental uncertainty of (−5.5; 3.3). Once again, the CCSD(T)/QZ AE deviation is only 1.3 kcal mol−1 (see Chart 6), which is well below the experimental uncertainty, indicating that the CBS might result in the lack of some error cancellations taking place with the QZ basis set.
In contrast to previous cases, apart from orbital inversion, significant mixing between core and valence orbitals has been found for two molecules of reactions (21)–(26). First, in CaF2, significant mixing occurs between the 3p core orbitals of Ca and the valence 2s orbital of F (MO 13, see Fig. S1, ESI†). Treating this orbital as core is apparently responsible for the large error documented for reaction (21), which is in line with previous works.22,23 Indeed, additional calculations with the 3s and 3p orbitals of Ca included in the correlation space and the 1s and 1s2s2p orbitals of F and Ca treated as a core (“reduced frozen core”) resulted in a CBS reaction enthalpy for reaction (21) of −234.7 kcal mol−1. This is in good agreement with the AE CBS enthalpy of −236.1 kcal mol−1, but differs significantly from the FC CBS enthalpy of −216.4 kcal mol−1. Second, mixing between the core 4p of Sr and the valence 3s orbitals of Cl was found in SrCl2 (MO 12, see Fig. S2, ESI†). However, in contrast to CaF2 the contribution of the 3s valence orbital of the halogen is significantly smaller (the orbital is dominated by the Sr 4p orbital). Treating this orbital as core has resulted in the FC CBS enthalpy for reaction (24) of −149.6 kcal mol−1, which is within the experimental uncertainties of the experimental enthalpy of −153.5 (−4.1; 4.0) kcal mol−1. However, still significant difference is observed upon comparison with the AE CBS enthalpy for this reaction, −156.9 kcal mol−1. Although the difference is not as dramatic as for reaction (21), additional reduced frozen core calculations (with only the 4s4p orbitals of Sr moved to the correlation space) resulted in a CBS enthalpy for reaction (24) of −156.7 kcal mol−1.
For CaBr2, no significant mixing between the core 3s3p orbitals of Ca and the valence 4s4p orbitals of Br was found. The FC and AE CBS enthalpies for reaction (22) turned out to be −144.2 kcal mol−1 and −144.8 kcal mol−1, indicating that the cc and cv effects are small. For SrF2, SrBr2 and SrI2, no mixing of the core 4s4p orbitals of Sr with the valence orbitals of halogens was found. However, large differences between the FC and AE reaction enthalpies have been obtained. Thus, for reaction (23) the FC CBS enthalpy is −220.9 kcal mol−1, while the corresponding AE reaction enthalpy is −229.8 kcal mol−1. This indicates that the cc and cv correlation effects are large for this reaction and amount to 9 kcal mol−1. We can rationalize this remarkable effect in terms of the dispersion interaction arising between the core electrons of Sr and the electrons on the F atoms. In fact, as already discussed by Petersson and co-workers,25 London dispersion forces between core electrons of one atom and electrons in neighbouring atoms can contribute significantly to binding energies. In the present case, the strong interaction between the Sr and the F atoms brings them very close to each other, leading to non-negligible attractive forces between their electrons. Indeed, reduced frozen core calculations with the 4s4p electrons of Sr included in the correlation space resulted in a CBS reaction enthalpy of −229.3 kcal mol−1.
Similar comparisons made for reaction (25) have revealed the effects from the cc and cv correlation of 2 kcal mol−1. The FC, AE and reduced frozen core (4s4p of Sr moved to the correlation space) reaction enthalpies are −140.1, −142.0 and −142.3 kcal mol−1, respectively. Finally, the FC, AE and reduced frozen core (4s4p of Sr are correlated) reaction enthalpies are −122.8, −120.5 and −120.6 kcal mol−1, respectively. This means that the cc and cv correlation effects are ca. 2 kcal mol−1 for the SrI2 reaction, indicating that even in the absence of core and valence orbital mixing, core–core and core–valence correlation effects can be very strong and cannot be ignored.
The smaller MUE/MSE values obtained with the QZ basis set are also confirmed in Chart 7 where the overall performance obtained for the 6 Ca and Sr reactions is given for both canonical and DLPNO coupled cluster methods with the FC and AE approaches and with TZ, QZ, 5Z and CBS TZ/QZ and QZ/5Z extrapolation schemes. Thus, MUE obtained with the QZ basis set is only 1.9 kcal mol−1 for the CCSD(T) AE method while the corresponding CBS value is 3.6 kcal mol−1, thus pointing to a questionable role of the CBS extrapolation scheme in this case. Also, application of large 5Z basis sets and the CBS QZ/5Z extrapolation scheme does not improve the QZ performance, indicating that quite CPU demanding 5Z calculations can be avoided. The poor performance of the FC approach is also confirmed in Chart 7, where the left half of the chart clearly contains larger MUEs. As previously found, only negligible difference of a fraction of a kcal mol−1 between DLPNO and canonical coupled cluster methods can be detected.
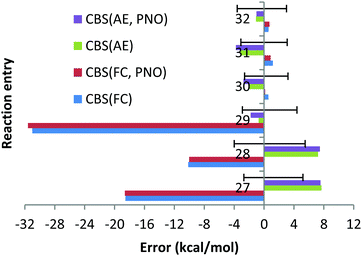
With the AE approach in the CBS limit the largest errors have been obtained for reactions (27) (7.7 kcal mol−1) and (28) (7.2 kcal mol−1). The quite large experimental uncertainties for those reactions (−2.7; 5.2) and (−4.0; 5.5) kcal mol−1, respectively, can partially account for such large deviations. The fact that deviations obtained with CCSD(T) and QZ basis sets and AE are only 1.3 and 2.7 kcal mol−1 (see Chart 9) would suggest that the CBS extrapolation does not work for these two reactions. However, the fact that 5Z DLPNO-CCSD(T) AE results in deviations of 4.7 and 4.9 kcal mol−1 (QZ DLPNO-CCSD(T) errors are 1.9 and 3.6 kcal mol−1, again very close to canonical CCSD(T), see above and Chart 9) indicates that the CBS extrapolation scheme is not responsible for the large deviation, rather the errors are increasing upon the increase in the basis sets for these reactions in general, which is not as expected. Such strange behaviour of the CCSD(T) AE method for these two reactions might only be explained by the very difficult natures of these two reactions, since both of them are dissociation/association reactions (Ba + X2 = BaX2, X = F, Cl) where the metal changes the oxidation state from 0 (in the atom) to +2 and no error compensation can be expected. In addition, the electronic structure of barium is drastically different in both parts of the equations. We do not expect that the core orbitals (replaced by relativistic ECP on the Ba atom, e.g. as f-orbitals in the case of Hf complexes33) or approximation of the scalar relativistic effects by relativistic pseudopotential is responsible for these failures since the DLPNO-CCSD(T) method with QZ fully de-contracted Sapporo basis sets accomplished with diffuse functions for all the exponents and AutoAux auxiliary basis sets lead to deviations of 8.5 and 4.9 kcal mol−1 for reactions (27) and 28, respectively, which are almost identical to CCSD(T)/CBS AE results. Finally, it is not impossible that the experimental data are not very accurate for BaF2 and BaCl2.
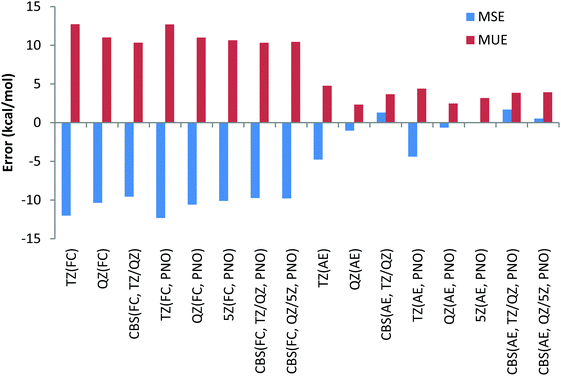
The smaller MUE/MSE values obtained with the QZ basis set are also confirmed in Chart 10, where the overall performance obtained for the 6 reactions is given for both canonical and DLPNO coupled cluster methods with/without the frozen core approach and with TZ, QZ, 5Z and CBS TZ/QZ and QZ/5Z extrapolations. Thus, MUE obtained with the QZ basis set is only 2.3 kcal mol−1 for the CCSD(T) AE method while the corresponding CBS value is 3.7 kcal mol−1. The poor performance of the frozen core approach is also confirmed in Chart 10 (the errors in the left side of the chart are clearly higher). As previously found, only negligible difference of a few tenths of a kcal mol−1 between DLPNO and canonical coupled cluster methods can be detected.
Strong mixing between the core 5p orbitals of Ba and the valence orbitals of oxygen and halogens was found for all the Ba compounds we studied, namely, BaF2, BaCl2 and BaO. This indicates that the large errors observed for reactions (27)–(29) are due to inconsistent treatment of the core and valence correlation in Ba. For BaF2, the mixing between the core (sub-valence) 5s orbital of Ba and the 2s valence orbital of F was identified in MO 3 (see Fig. S3 (ESI†)). Moreover, in MO 8 (Fig. S4, ESI†), mixing between the core 5p orbital of Ba and the 2s2p valence orbitals of F was identified as well. The FC CBS predicted enthalpy of reaction (27) is −216.7 kcal mol−1, versus an AE predicted enthalpy of −242.9 kcal mol−1, indicating that inclusion of the sub-valence Ba 5s5p orbitals has a substantial effect. It is confirmed by reduced FC calculations (5s5p orbitals of Ba moved to the correlation space), in which the CBS enthalpy of reaction (27) is −242.5 kcal mol−1. For BaCl2, significant mixing of the sub-valence (core) 5p orbitals of Ba with the 3s valence orbital of Cl was identified in MO 16, treated as a core orbital (see Fig. S5 (ESI†)). The FC CBS predicted enthalpy of reaction (28) is −151.4 kcal mol−1, versus an AE predicted enthalpy of −168.7 kcal mol−1. Reduced FC calculations (5s5p orbitals of Ba moved to the correlation space) resulted in a CBS enthalpy of −168.5 kcal mol−1, indicating that correlating the 5s5p orbitals is essential, while correlating the 1s2s2p orbitals of Cl is not. Finally, for BaO, significant mixing of the core (sub-valence) Ba 5p orbital with the valence O 2s orbital was identified in MO 6 (see Fig. S6 (ESI†)). The FC CBS predicted enthalpy of reaction (28) is 15.1 kcal mol−1, versus an AE predicted enthalpy of −15.2 kcal mol−1. Reduced FC calculations (5s5p orbitals of Ba moved to the correlation space) resulted in a CBS enthalpy of −15.3 kcal mol−1, indicating that inclusion of the 5s5p Ba orbitals in the correlation space is essential (while inclusion of core 1s orbitals of O is not).
No mixing of the core and valence orbitals has been found for the molecular core orbitals of the lead complexes we studied. Hence, the difference between the FC and the AE calculations can be attributed solely to the cc and cv correlation effects. The FC CBS enthalpy for reaction (30) is 8.6 kcal mol−1, versus an AE CBS enthalpy of 11.3 kcal mol−1, indicating that the cc and cv effect for this reaction is 2.7 kcal mol−1. Reduced FC calculations (5s5p of Pb moved to the correlation space) resulted in a CBS enthalpy of 11 kcal mol−1. The FC CBS enthalpy for reaction (31) is 24.2 kcal mol−1, versus an AE CBS enthalpy of 28.6 kcal mol−1, indicating that the cc and cv effect for this reaction is 4.4 kcal mol−1. Reduced FC calculations (5s5p orbitals of Pb included in the correlation space) resulted in a CBS enthalpy for this reaction of 28.5 kcal mol−1. The FC CBS enthalpy for reaction (32) is 15.6 kcal mol−1, versus an AE CBS enthalpy of 17.3, indicating that the cc and cv effect for this reaction is 1.7 kcal mol−1. Reduced FC calculations (5s5p orbitals of Pb moved to the correlation space) resulted in a CBS enthalpy for this reaction of 17.5 kcal mol−1. All these results indicate that inclusion of the sub-valence 5s5p orbitals of Pb in the correlation treatment is essential while inclusion of the core orbitals of halogens (1s for F, 1s2s2p for Cl and 3s3p for Br) is not.
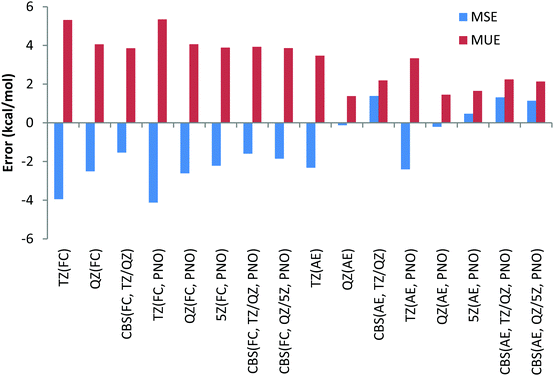
In the AE approach the largest errors were obtained with the TZ basis sets, namely 3.5 and 3.3 kcal mol−1 for canonical CCSD(T) and its DLPNO counterpart, respectively. QZ basis sets give MUEs of 1.4 kcal mol−1 for canonical CCSD(T) and 1.5 kcal mol−1 for DLPNO-CCSD(T) methods. CBS TZ/QZ extrapolation leads to somewhat larger MUE compared to that with the QZ basis set, namely deviations of 2.2 kcal mol−1 for both the canonical and DLPNO coupled cluster, respectively. The 5Z AE DLPNO-CCSD(T) calculations result in a MUE of 1.7 kcal mol−1 which is 0.2 kcal mol−1 larger compared to QZ results. Finally, the CBS QZ/5Z extrapolation results in a MUE of 2.1 kcal mol−1 which is almost equal to CBS TZ/QZ extrapolation results. The smallest MSEs have been obtained for the QZ basis sets as well when the AE approach is used.
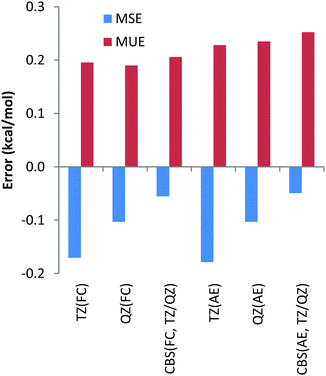
Finally, we have also calculated the deviations between the DLPNO-CCSD(T) reaction energies and their canonical CCSD(T) counterparts with all basis sets and the core-correlation settings for all 32 reactions studied in the present work. The deviations are given in Table S1 (ESI†) and the summary including the mean unsigned errors (MUE) and mean signed errors (MSE) is depicted in Chart 12. The largest MUE of 0.3 kcal mol−1 has been obtained for CBS extrapolated AE calculations; for all other core correlation settings and basis sets, MUEs of only 0.2 kcal mol−1 have been obtained. When analysing the deviations for the individual reactions in Table S1 (ESI†), the largest deviation between DLPNO-CCSD(T) and canonical CCSD(T) methods has been detected for AE calculations of reaction energy for reaction (29), see Table 2, and amounts to only 1.1 kcal mol−1. For all other reactions for all the combinations of basis sets and core correlation settings, deviations smaller than 0.9 kcal mol−1 have been obtained. All these results indicate that the DLPNO-CCSD(T) method is quite robust and reliable, providing essentially CCSD(T) accuracy at significantly smaller computational time and less severe hardware demands.
4 Conclusions
We have tested the performance of CCSD(T) and DLPNO-CCSD(T) methods, in conjunction with correlation consistent basis sets of Peterson et al., in reproducing the ligand exchange and association/dissociation enthalpies of highly ionic complexes of Li, Be, Na, Mg, Ca, Sr, Ba and Pb(II), for which experimental estimates are available. Two different strategies have been used to determine the number of electrons to be included in the correlation treatment. In the first option, only valence electrons were included, giving rise to the FC approach that can significantly speed up the calculations and either save the CPU time or make the calculations of larger molecules feasible. In the second option, all non-ECP electrons were included, giving rise to the AE (all electron) approach. The FC approach resulted in poor performance, both due to artificial mixing of the core sub-valence orbitals of the metal atom and the valence orbitals of oxygen and halogens in the molecular core orbitals and due to neglecting core–core and core–valence correlation effects. This is the consequence of very few valence electrons on the metals and highly ionic bonding. However, the performance of the FC approach is not homogeneous and turned out to be surprisingly good with MUEs below 2.0 kcal mol−1 for all the reaction enthalpies of Li and Be and for some reaction enthalpies of Na, Mg, Ca, Sr, Ba and Pb complexes.For a few reaction enthalpies of Ca and Ba, deviations up to 40 kcal mol−1 have been obtained, indicating that the reliability of the FC approach has always to be verified via test calculations (e.g. on smaller model systems) using AE calculations or FC calculations with sub-valence orbitals included in the correlation space. Even if no significant artificial mixing is obtained between the core metal orbitals and valence orbitals of oxygen and halogens, the effects of the core–core and core–valence correlations might be as large as 10 kcal mol−1 and cannot be ignored. We realize that, for the considered reactions, the importance of the inclusion of the core orbitals might be obvious and documented in earlier works, and in fact the FC approach resulted in huge deviations from both experimental measurements and AE calculations. At the same time, we believe that there are many cases where the importance of inclusion of the core correlation and sub-valence orbitals in the calculations is not that obvious and still may result in deviations that are harder to detect. This is especially true for the systems which have never been studied by the CCSD(T) calculations before, and for which the local CCSD(T) methods, in particular DLPNO-CCSD(T), made it possible for the first time. The AE approach provided much better overall performance and is recommended for routine CCSD(T) calculations when the importance of the core correlation is unclear, and the right answer for the right reason is the goal. For some of the investigated metals the default chemical cores used in this work might be too large and more conservative chemical core regions might significantly increase the accuracy of results with the FC approach. In a different publication the chemical core regions for heavier elements will be revisited and their influence on the accuracy of the prediction of experimental reaction enthalpies will be investigated.51
Another important point is that for most systems results are not converged at the TZ level and require at least QZ basis set calculations. Perhaps surprisingly, both TZ/QZ and QZ/5Z extrapolation schemes, as suggested by Helgaker et al., did not significantly improve upon the QZ results, and in fact often resulted in slightly higher deviations in the reaction enthalpies making CBS extrapolation redundant at least for the reactions in the current work. Moreover, even deviations resulting from 5Z basis sets turned out to be larger in many cases compared to the QZ results, indicating that some fortuitous cancellations take place.
In general, larger deviations have been obtained for reaction enthalpies involving complexes of heavier metals, i.e. Sr, Ba and Pb. This can at least partially be explained by large experimental uncertainties associated with reaction enthalpies involving these metals.
Finally, the DLPNO-CCSD(T) method with the tight PNO settings was confirmed to very closely approximate the parent canonical CCSD(T) method performance (MUEs of 0.2 to 0.3 kcal mol−1) also for the reaction enthalpies where the effects from the core correlation turned out to be important. This makes the application of the DLPNO method promising also in those cases where core-correlation effects might play an important role. One such potentially promising application is the calculation of unknown formation enthalpies via theoretically calculated reaction enthalpies and known formation enthalpies for all but one reactant and product, as shown by us earlier.88 We recommend the use of the DLPNO-CCSD(T) AE protocol for this purpose.
Acknowledgements
The research reported in this publication was supported by funding from King Abdullah University of Science and Technology (KAUST). For computer time, this research used the resources of the Supercomputing Laboratory at King Abdullah University of Science and Technology (KAUST) in Thuwal, Saudi Arabia. G. Bistoni and A. A. Auer gratefully acknowledge the financial support of the SPP 1807 “Control of London dispersion interactions in molecular chemistry” of the DFG. Open Access funding provided by the Max Planck Society.Notes and references
- K. Raghavachari, G. W. Trucks, J. A. Pople and M. Headgordon, Chem. Phys. Lett., 1989, 157, 479–483 CrossRef CAS.
- C. J. Cramer, Essentials of Computational Chemistry: Theories and Models, Wiley, 2nd edn, 2005 Search PubMed.
- F. Jensen, Introduction to Computational Chemistry, Wiley, 2nd edn, 2006 Search PubMed.
- C. Hättig and F. Weigend, J. Chem. Phys., 2000, 113, 5154–5161 CrossRef.
- F. Neese, F. Wennmohs and A. Hansen, J. Chem. Phys., 2009, 130, 114108 CrossRef PubMed.
- H.-J. Werner and M. Schütz, J. Chem. Phys., 2011, 135, 144116 CrossRef PubMed.
- D. G. Liakos, A. Hansen and F. Neese, J. Chem. Theory Comput., 2011, 7, 76–87 CrossRef CAS PubMed.
- J. W. Boughton and P. Pulay, J. Comput. Chem., 1993, 14, 736–740 CrossRef CAS.
- C. Riplinger and F. Neese, J. Chem. Phys., 2013, 138, 034106 CrossRef PubMed.
- C. Riplinger, B. Sandhoefer, A. Hansen and F. Neese, J. Chem. Phys., 2013, 139, 134101 CrossRef PubMed.
- P. Y. Ayala and G. E. Scuseria, J. Chem. Phys., 1999, 110, 3660–3671 CrossRef CAS.
- S. Saebo and P. Pulay, Annu. Rev. Phys. Chem., 1993, 44, 213–236 Search PubMed.
- C. Hampel and H. J. Werner, J. Chem. Phys., 1996, 104, 6286–6297 CrossRef CAS.
- M. Schütz and H. J. Werner, Chem. Phys. Lett., 2000, 318, 370–378 Search PubMed.
- D. G. Liakos, M. Sparta, M. K. Kesharwani, J. M. L. Martin and F. Neese, J. Chem. Theory Comput., 2015, 11, 1525–1539 CrossRef CAS PubMed.
- C. Riplinger, P. Pinski, U. Becker, E. F. Valeev and F. Neese, J. Chem. Phys., 2016, 144, 024109 CrossRef PubMed.
- F. Neese, WIREs Comput. Mol. Sci., 2012, 2, 73–78 Search PubMed.
- Y. Minenkov, E. Chermak and L. Cavallo, J. Chem. Theory Comput., 2015, 11, 4664–4676 CrossRef CAS PubMed.
- M. Sparta, C. Riplinger and F. Neese, J. Chem. Theory Comput., 2014, 10, 1099–1108 CrossRef CAS PubMed.
- M. Sparta and F. Neese, Chem. Soc. Rev., 2014, 43, 5032–5041 Search PubMed.
- C. W. Bauschlicher, C. F. Melius and M. D. Allendorf, J. Chem. Phys., 1999, 110, 1879–1881 CrossRef CAS.
- A. Schulz, B. J. Smith and L. Radom, J. Phys. Chem. A, 1999, 103, 7522–7527 CrossRef CAS.
- M. B. Sullivan, M. A. Iron, P. C. Redfern, J. M. L. Martin, L. A. Curtiss and L. Radom, J. Phys. Chem. A, 2003, 107, 5617–5630 CrossRef CAS.
- D. S. Ranasinghe, M. J. Frisch and G. A. Petersson, J. Chem. Phys., 2015, 143, 214110 CrossRef PubMed.
- A. J. Austin, M. J. Frisch, J. A. Montgomery and G. A. Petersson, Theor. Chem. Acc., 2002, 107, 180–186 CrossRef CAS.
- R. J. Bartlett and M. Musial, Rev. Mod. Phys., 2007, 79, 291–352 CrossRef CAS.
- D. Feller, K. A. Peterson and D. A. Dixon, Mol. Phys., 2012, 110, 2381–2399 CrossRef CAS.
- L. A. Curtiss, K. Raghavachari, G. W. Trucks and J. A. Pople, J. Chem. Phys., 1991, 94, 7221–7230 CrossRef CAS.
- L. A. Curtiss, P. C. Redfern and K. Raghavachari, WIREs Comput. Mol. Sci., 2011, 1, 810–825 CrossRef CAS.
- K. A. Peterson and T. H. Dunning, J. Chem. Phys., 2002, 117, 10548–10560 CrossRef CAS.
- B. P. Prascher, D. E. Woon, K. A. Peterson, T. H. Dunning Jr. and A. K. Wilson, Theor. Chem. Acc., 2011, 128, 69–82 CrossRef CAS.
- M. A. Iron, M. Oren and J. M. L. Martin, Mol. Phys., 2003, 101, 1345–1361 CrossRef CAS.
- Y. Gong, L. Andrews, C. W. Bauschlicher, K. S. Thanthiriwatte and D. A. Dixon, Dalton Trans., 2012, 41, 11706–11715 RSC.
- D. Figgen, K. A. Peterson, M. Dolg and H. Stoll, J. Chem. Phys., 2009, 130, 164108 CrossRef PubMed.
- D. Feller, K. A. Peterson and D. A. Dixon, J. Chem. Phys., 2008, 129, 204105 CrossRef PubMed.
- K. A. Peterson, D. Feller and D. A. Dixon, Theor. Chem. Acc., 2012, 131, 1–20 CrossRef CAS.
- D. A. Dixon, D. Feller and K. A. Peterson, in Annu. Rep. Comput. Chem., ed. A. W. Ralph, Elsevier, 2012, vol. 8, pp. 1–28 Search PubMed.
- D. Feller, K. A. Peterson and D. A. Dixon, The Impact of Larger Basis Sets and Explicitly Correlated Coupled Cluster Theory on the Feller–Peterson–Dixon Composite Method. In Annual Reports in Computational Chemistry, Elsevier Science, 2016, vol. 12 Search PubMed.
- N. J. DeYonker, T. R. Cundari and A. K. Wilson, J. Chem. Phys., 2006, 124, 104111 Search PubMed.
- A. Karton, E. Rabinovich, J. M. L. Martin and B. Ruscic, J. Chem. Phys., 2006, 125, 144108 Search PubMed.
- D. N. Laikov and Y. A. Ustynyuk, Russ. Chem. Bull., 2005, 54, 820–826 CrossRef CAS.
- M. J. Frisch, G. W. Trucks, H. B. Schlegel, G. E. Scuseria, M. A. Robb, J. R. Cheeseman, G. Scalmani, V. Barone, B. Mennucci, G. A. Petersson, H. Nakatsuji, M. Caricato, X. Li, H. P. Hratchian, A. F. Izmaylov, J. Bloino, G. Zheng, J. L. Sonnenberg, M. Hada, M. Ehara, K. Toyota, R. Fukuda, J. Hasegawa, M. Ishida, T. Nakajima, Y. Honda, O. Kitao, H. Nakai, T. Vreven, J. A. Montgomery Jr, J. E. Peralta, F. Ogliaro, M. J. Bearpark, J. Heyd, E. N. Brothers, K. N. Kudin, V. N. Staroverov, R. Kobayashi, J. Normand, K. Raghavachari, A. P. Rendell, J. C. Burant, S. S. Iyengar, J. Tomasi, M. Cossi, N. Rega, N. J. Millam, M. Klene, J. E. Knox, J. B. Cross, V. Bakken, C. Adamo, J. Jaramillo, R. Gomperts, R. E. Stratmann, O. Yazyev, A. J. Austin, R. Cammi, C. Pomelli, J. W. Ochterski, R. L. Martin, K. Morokuma, V. G. Zakrzewski, G. A. Voth, P. Salvador, J. J. Dannenberg, S. Dapprich, A. D. Daniels, Ö. Farkas, J. B. Foresman, J. V. Ortiz, J. Cioslowski and D. J. Fox, Gaussian 09, Revision D.01, Gaussian, Inc., Wallingford CT, 2013 Search PubMed.
- X. Xu, W. Zhang, M. Tang and D. G. Truhlar, J. Chem. Theory Comput., 2015, 11, 2036–2052 CrossRef CAS PubMed.
- L. Cheng, J. Gauss, B. Ruscic, P. B. Armentrout and J. F. Stanton, J. Chem. Theory Comput., 2017, 13, 1044–1056 CrossRef CAS PubMed.
- Z. Fang, M. Vasiliu, K. A. Peterson and D. A. Dixon, J. Chem. Theory Comput., 2017, 13, 1057–1068 CrossRef CAS PubMed.
- Y. Minenkov, E. Chermak and L. Cavallo, J. Chem. Theory Comput., 2016, 12, 1542–1560 CrossRef CAS PubMed.
- J. P. Perdew, K. Burke and M. Ernzerhof, Phys. Rev. Lett., 1996, 77, 3865–3868 CrossRef CAS PubMed.
- J. P. Perdew, K. Burke and M. Ernzerhof, Phys. Rev. Lett., 1997, 78, 1396 CrossRef CAS.
- D. N. Laikov, Chem. Phys. Lett., 2005, 416, 116–120 Search PubMed.
- K. G. Dyall, J. Chem. Phys., 1994, 100, 2118–2127 CrossRef CAS.
- Manuscript in preparation.
- T. H. Dunning, J. Chem. Phys., 1989, 90, 1007–1023 CrossRef CAS.
- J. Koput and K. A. Peterson, J. Phys. Chem. A, 2002, 106, 9595–9599 CrossRef CAS.
- H. Li, H. Feng, W. Sun, Y. Zhang, Q. Fan, K. A. Peterson, Y. Xie and H. F. Schaefer III, Mol. Phys., 2013, 111, 2292–2298 Search PubMed.
- I. S. Lim, H. Stoll and P. Schwerdtfeger, J. Chem. Phys., 2006, 124, 034107 Search PubMed.
- K. A. Peterson and K. E. Yousaf, J. Chem. Phys., 2010, 133, 174116 CrossRef PubMed.
- K. A. Peterson, D. Figgen, E. Goll, H. Stoll and M. Dolg, J. Chem. Phys., 2003, 119, 11113–11123 CrossRef CAS.
- K. A. Peterson, B. C. Shepler, D. Figgen and H. Stoll, J. Phys. Chem. A, 2006, 110, 13877–13883 CrossRef CAS PubMed.
- B. Metz, H. Stoll and M. Dolg, J. Chem. Phys., 2000, 113, 2563–2569 CrossRef CAS.
- C. Hättig, Phys. Chem. Chem. Phys., 2005, 7, 59–66 Search PubMed.
- A. Hellweg, C. Hättig, S. Hoefener and W. Klopper, Theor. Chem. Acc., 2007, 117, 587–597 Search PubMed.
- COSMOLOGIC, http://cosmologic-services.de/basis-sets/basissets.php.
- G. L. Stoychev, A. A. Auer and F. Neese, J. Chem. Theory Comput., 2017, 13, 554–562 CrossRef CAS PubMed.
- A. Halkier, T. Helgaker, P. Jørgensen, W. Klopper, H. Koch, J. Olsen and A. K. Wilson, Chem. Phys. Lett., 1998, 286, 243–252 Search PubMed.
- T. Helgaker, W. Klopper, H. Koch and J. Noga, J. Chem. Phys., 1997, 106, 9639–9646 CrossRef CAS.
- A. Halkier, T. Helgaker, P. Jørgensen, W. Klopper and J. Olsen, Chem. Phys. Lett., 1999, 302, 437–446 Search PubMed.
- NIST Chemistry WebBook, NIST Standard Reference Database Number 69, National Institute of Standards and Technology, 2005.
- M. W. Chase Jr, J. Phys. Chem. Ref. Data, Monogr., 1998, 9, 1–1951 Search PubMed.
- M. N. Glukhovtsev, R. D. Bach and C. J. Nagel, J. Phys. Chem. A, 1997, 101, 316–323 CrossRef CAS.
- V. L. Chevrier, S. P. Ong, R. Armiento, M. K. Y. Chan and G. Ceder, Phys. Rev. B: Condens. Matter Mater. Phys., 2010, 82, 075122 CrossRef.
- K. E. Riley and K. M. Merz, J. Phys. Chem. A, 2007, 111, 6044–6053 CrossRef CAS PubMed.
- R. H. West, G. J. O. Beran, W. H. Green and M. Kraft, J. Phys. Chem. A, 2007, 111, 3560–3565 CrossRef CAS PubMed.
- W. J. Zhang, D. G. Truhlar and M. S. Tang, J. Chem. Theory Comput., 2013, 9, 3965–3977 CrossRef CAS PubMed.
- R. D. Bach, D. S. Shobe, H. B. Schlegel and C. J. Nagel, J. Phys. Chem., 1996, 100, 8770–8776 CrossRef CAS.
- N. J. DeYonker, T. G. Williams, A. E. Imel, T. R. Cundari and A. K. Wilson, J. Chem. Phys., 2009, 131, 024106 CrossRef PubMed.
- K. S. Krasnov, Molecular Constants of Inorganic Compounds, Reference Book, Khimia, Leningrad, 1979 Search PubMed.
- L. V. Gurvich, G. V. Karachevtsev, V. N. Kondrat'ev, J. A. Lebedev, V. A. Medvedev, V. K. Potapov and Y. S. Khodeev, Bond dissociation enrgies, ionization potentials and electron affinities, Nauka, Moscow, 1974 Search PubMed.
- V. P. Glushko, Thermodynamic properties of individual substances, Nauka, Moscow, 1979 Search PubMed.
- O. M. Nefedov, M. P. Egorov, A. I. Ioffe, L. G. Menchikov, P. S. Zuev, V. I. Minkin, B. Y. Simkin and M. N. Glukhovtsev, Pure Appl. Chem., 1992, 64, 265–314 Search PubMed.
- K. S. Thanthiriwatte, M. Vasiliu, S. R. Battey, Q. Lu, K. A. Peterson, L. Andrews and D. A. Dixon, J. Phys. Chem. A, 2015, 119, 5790–5803 Search PubMed.
- V. P. Glushko, et al., Thermodynamic properties of individual substances, NAUKA, Moscow, 1982 Search PubMed.
- M. Vasiliu, S. G. Li, K. A. Peterson, D. Feller, J. L. Gole and D. A. Dixon, J. Phys. Chem. A, 2010, 114, 4272–4281 CrossRef CAS PubMed.
- V. P. Glushko, Thermodynamic properties of individual substances, NAUKA, Moscow, 1981 Search PubMed.
- M. Vasiliu, D. Feller, J. L. Gole and D. A. Dixon, J. Phys. Chem. A, 2010, 114, 9349–9358 CrossRef CAS PubMed.
- F. Weigend and R. Ahlrichs, Phys. Chem. Chem. Phys., 2005, 7, 3297–3305 RSC.
- T. Noro, M. Sekiya and T. Koga, Theor. Chem. Acc., 2012, 131, 1124 CrossRef.
- F. Neese, ORCA 3.0 An ab initio, DFT and semiempirical SCF-MO package. Input description., 2013 Search PubMed.
- Y. Minenkov, V. V. Sliznev and L. Cavallo, Inorg. Chem., 2017, 56, 1386–1401 CrossRef CAS PubMed.
Footnote |
| † Electronic supplementary information (ESI) available: Table S1, cartesian coordinates (Å), canonical and DLPNO CCSD(T)(AE) and CCSD(T)(FC) energies with different basis sets, T1 diagnostic values, T2 (largest amplitude values), enthalpic corrections, tabulated enthalpies and errors forming the basis of Charts 1–12, tabulated absolute enthalpies of all 32 reactions and automatically generated auxiliary basis sets needed to run DLPNO-CCSD(T)/cc-pwCV5Z calculations. See DOI: 10.1039/c7cp00836h |
| This journal is © the Owner Societies 2017 |

