
 Open Access Article
 This Open Access Article is licensed under a Creative Commons Attribution-Non Commercial 3.0 Unported Licence
Design of fast ion conducting cathode materials for grid-scale sodium-ion batteries†
Lee Loong
Wong
 ,
Haomin
Chen
and
Stefan
Adams
*
,
Haomin
Chen
and
Stefan
Adams
*
Department of Materials Science and Engineering, National University of Singapore, Singapore 117575. E-mail: mseasn@nus.edu.sg
First published on 21st February 2017
Abstract
The obvious cost advantage as well as attractive electrochemical properties, including excellent cycling stability and the potential of high rate performance, make sodium-ion batteries prime candidates in the race to technically and commercially enable large-scale electrochemical energy storage. In this work, we apply our bond valence site energy modelling method to further the understanding of rate capabilities of a wide range of potential insertion-type sodium-ion battery cathode materials. We demonstrate how a stretched exponential function permits us to systematically quantify the rate performance, which in turn reveals guidelines for the design of novel sodium-ion battery chemistries suitable for high power, grid-scale applications. Starting from a diffusion relaxation model, we establish a semi-quantitative prediction of the rate-performance of half-cells from the structure of the cathode material that factors in dimensionality of Na+ ion migration pathways, the height of the migration barriers and the crystallite size of the active material. With the help of selected examples, we also illustrate the respective roles of unoccupied low energy sites within the pathway and temperature towards the overall rate capability of insertion-type cathode materials.
1. Introduction
1.1. Background and motivation
Novel large-scale electrochemical energy storage systems with revolutionary energy density and power performance are needed to manage power grids based on intermittent renewable sources and to put urban mobility on a sustainable basis. Among the targets for large-scale electrochemical energy storage systems:• high energy density
• high rate performance
• high energy efficiency (i.e. low overpotential)
• long cycle (and shelf) life
• high safety, reliability and abuse tolerance
• low cost
the low cost and earth abundance of sodium is commonly cited as the key motivation for a transition from Li- to Na-based cell chemistry, especially in the context of large scale energy storage systems. Still a large fraction of this renewed exploration of sodium-based batteries just mimics approaches that proved successful in Li-ion battery (LIB) technology. Relying on sodium analogues of the conventional layered transition metal oxide cathode materials is, however, problematic as far as it concerns cathode materials containing relatively high cost transition metals such as Co, both as it defies the purpose of cost reduction and as it overlooks inherent differences in reaction mechanisms of sodium analogues of the classical layered lithium transition metal oxides. In this work, we discuss a more suitable approach in designing Na-ion battery (NIB) materials and NIB systems taking advantage of peculiar properties of sodium and we derive a method to predict the rate performance of insertion cathode materials directly from the crystal structure.
1.2. External design constraints for sodium-ion battery materials
The cost advantage of Na will only translate into commercially viable large-scale NIBs, if the concept of earth-abundance is consistently applied throughout the system design. From the abundance of elements in the Earth's upper crust seen in Fig. 1 the design of NIB electrode materials should concentrate on the most abundant transition metals Fe, Ti and Mn. Lower priority should be given to the less abundant first row transition metals V, Cr or the most abundant second row transition metal Zr. Fig. 1 particularly emphasizes that relying on Co oxides will not be sustainable and a transition to Ni or Cu offers only a marginal advantage. On the other hand, Earth abundance is only one condition for a low-cost material, and even if this is met, a scalable low cost processing technology is needed to realize the low-cost potential. | ||
| Fig. 1 Atom fraction of the lighter chemical elements in Earth's upper continental crust vs. atomic number (data averaged from two compilations in ref. 1). Transition metal elements are connected by a broken line as a guide to the eye. The abundant elements shown in green should be in the focus of a sustainable materials design, while less common elements shown in red and violet should be avoided in designing NIB materials and the availability of elements of average abundance (shown in orange) may become a limiting factor for low cost large-scale applications. | ||
In short, rather than copying what worked for LIBs, a rational design of NIB materials has to focus on peculiarities of Na compounds. Based on the strong potential for fast ion mobility, the requirement to limit volume changes during cycling, stability and energy density considerations we expect that insertion into open framework polyanionic oxides, oxyfluorides or oxynitrides containing abundant transition metals yields the most promising class of NIB electrode materials.
Here, we will thus analyse for a range of such polyanionic NIB cathode materials how suitable the respective structure type is for fast Na+ mobility and hence for high rate performance insertion-type NIBs. It will be shown that a stretched exponential function description yields a rational quantitative measure of rate capabilities for insertion-type cathode materials and allows to rationally quantify the relative influence of migration barrier height, pathway dimensionality, the fraction of unoccupied low energy sites in the pathways as well as particle size and operation temperature on the achievable rate performance.
1.3. SWOT analysis of Na cathode materials and NIB system design
Considering strengths and weaknesses of Na compounds for applications in NIBs in comparison to LIB materials, the somewhat lower cell voltage of NIBs slightly affects the achievable energy densities, but will also tend to enhance both cycle and shelf life of NIBs (as well as to a minor extent battery safety) as it moderates the requirements for the electrochemical window of the electrolyte. On the other hand, the larger size of Na+ tends to increase the volume changes on cycling insertion compounds. This is inevitable for layered transition metal oxides where sodiation/desodiation corresponds to adding or removing entire sodium layers in the crystal structure (and can only be mitigated by restricting the battery capacity to a partial utilisation of the available Na). Moreover, the rate-capability of layered NIB cathode materials is often seriously hampered by Na+ ordering as the intra-layer Na+–Na+ distance becomes a crucial structure-controlling factor.2 In polyanion framework compounds, where Na+ ions may be more evenly distributed over the unit cell volume, both effects will be much less of a concern, as the sodiation corresponds to filling otherwise vacant channels in a persisting three-dimensional framework that defines the cell volume within rather narrow boundaries. Moreover, the higher contribution of host guest interactions together with weaker Na+–Na+ interactions reduces the hazard of immobilising Na+ ordering. Thus, it appears straightforward to concentrate the search for NIB electrode materials on insertion type compounds, especially if a long cycle life is a key design target besides a high rate performance.The higher atomic weight of sodium in combination with the above-mentioned slightly higher anode potential obviously imply that NIBs cannot exceed LIBs in terms of gravimetric energy density but can only come close to these. It is, however, often overlooked that NIBs have a strong potential to outshine LIBs in terms of rate performance: the higher atomic number and larger size of Na+ ions also mean that Na+ are more polarizable and less polarizing than Li+. In addition, the motion of the heavier Na+ is less coupled to vibrations in the immobile oxide substructure and hence less harmonic than for Li+. In total this means that, despite the requirement of larger size bottlenecks for ionic motion, alkali ion motion through complex oxides is typically faster in Na compounds than in Li analogues. Provided that the charge carrier mobility within the electrode material controls the overall rate performance of the system, this mobility advantage should directly translate into opportunities for applications requiring high rate performance. It is generally assumed that for batteries relying on insertion electrode materials the charge carrier mobility inside the electrode material is indeed the rate limiting factor (see e.g.ref. 3 and Scheme 1).
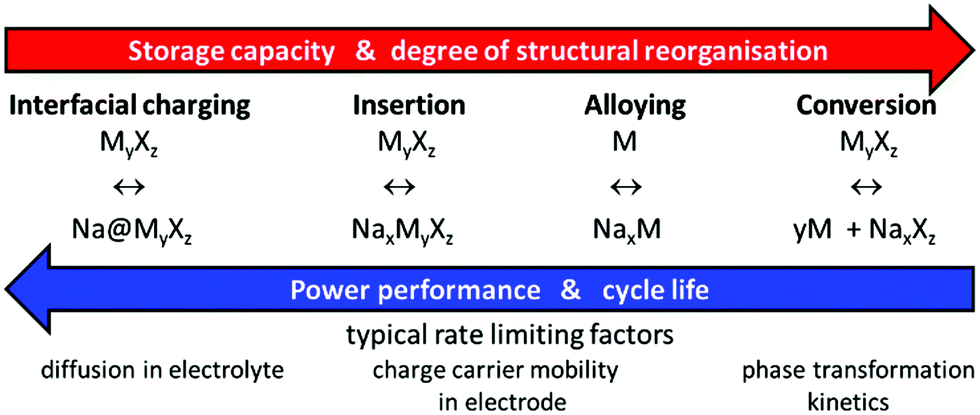 | ||
| Scheme 1 Interrelation of reversible energy storage mechanisms in Na-based batteries with system performance and rate limiting processes. | ||
The mobility of electrons in mixed-conducting electrode materials is often intrinsically higher and, if not, can be enhanced by conductive additives such as carbon coating. Therefore, the mobility of the inserted (or removed) cations typically controls the rate performance and thus the potential of a phase as a high rate performance electrode material. As suggested by Kalantarian et al.4 an exception might be extremely nanosized materials with poor electronic conductivity, for which they qualitatively suggest from DFT calculations that cathodes will show high rate performance if the discharged structure acts as p-type and the charged one as n-type semiconductor, while for the reverse case only lower current rates should be sustained.
In this work, we discuss the rate performance assuming that it is limited by ion mobility in the cathode material, which will be the default case in Na or Li-based batteries using metal anodes as well as in most practical Li- and Na-ion batteries. The resulting findings will remain applicable for cases, where the rate limiting process concerns an insertion-type anode.
1.4. Historical measures of rate performance
A few decades after the introduction of lead acid batteries Peukert5 suggested a simple power law | (1) |
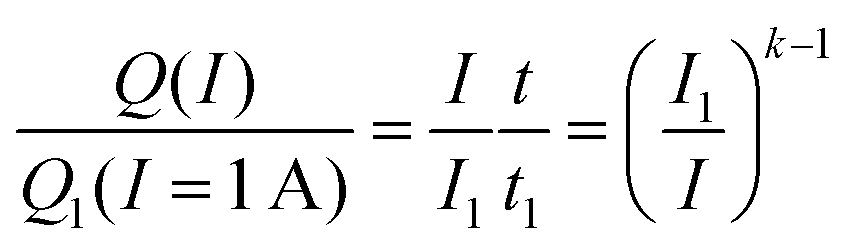 | (2) |
It is immediately obvious that eqn (2) can only be applied over a limited range of currents I > I1 as the relationship would yield a nonsensical increase of the capacity to infinity when applied to arbitrarily small currents. Despite its obvious shortcomings, Peukert's law is still widely used in technical literature both for lead acid batteries (often using different reference currents) and even for a wide range of other battery chemistries though it is commonly known that it does not yield a quantitative prediction of their rate performance.6 As will be shown below in Section 3.1, Peukert's law is not only imprecise but yields a fundamentally incorrect rate dependence of the capacity for the technologically relevant range of discharge rates of insertion electrode batteries and can only serve as a crude approximation for extremely high or low rates.
Thus attempts to expand or amend the Peukert equation to mitigate deviations (cf.ref. 7) appear questionable and we here aim to introduce a more rational way to quantify the rate performance starting from the insight that the relevant rate-limiting processes are diffusion relaxation processes. The approach is extendable to the less common case that both charge transfer processes at the electrode surface and diffusion rate affect the overall rate performance in different rate domains. While the theory of frequency dependent relaxation processes is well established in the context of diffusion controlled impedance, as well as to explain diffusion effects on NMR or inelastic neutron spectroscopy, (for reviews see e.g. Dieterich et al.8 or Fu9) to the best of our knowledge the approach seems to have not yet been utilized to systematically derive a rational and quantitative characterization of the C-rate dependence of capacities for intercalation batteries.
2. Computational methods
2.1. Bond-valence site energy method
Migration pathways for mobile Na+ are analysed both from literature crystal structure data and from series of snapshots of molecular dynamics (MD) simulations by our bond valence site energy approach, as discussed elsewhere.10–12 In brief, this modelling of pathways for mobile alkali ions A as regions of low bond valence site energy EBVSE(A) has been demonstrated to be a simple and reliable way of identifying transport pathways in local structure models,12,13 provided that the local structure model captures the essential features of the real structure. While bond valences sA–X = exp[(R0,A–X − RA–X)/bA–X] and hence the bond valence sum mismatch |ΔV| are often expressed in arbitrary “valence units”, they can, as elaborated by our group,14–16 be linked to an absolute energy scale by expressing the bond valence as a Morse-type interaction energy between cation Na+ and anion X.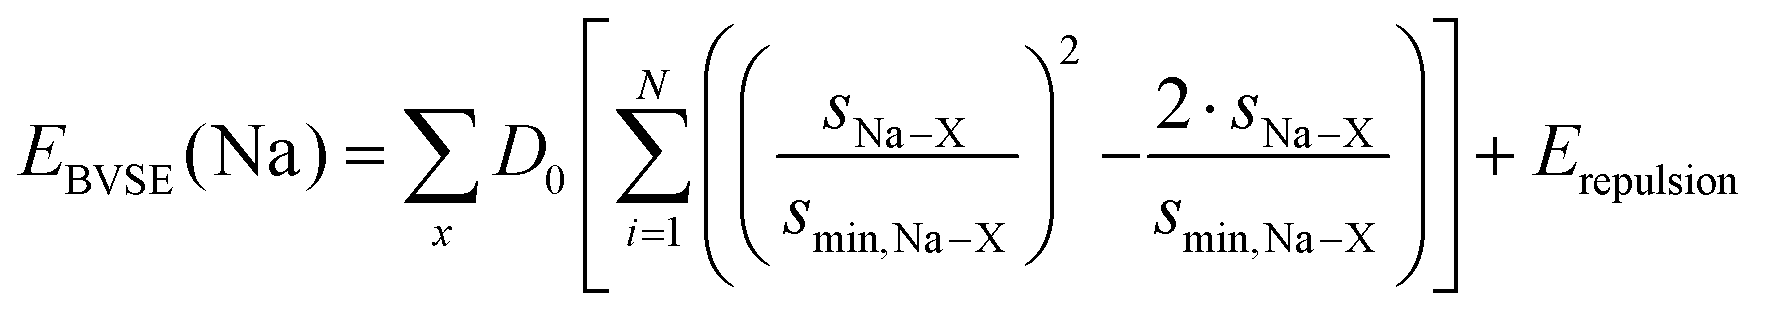 | (3) |
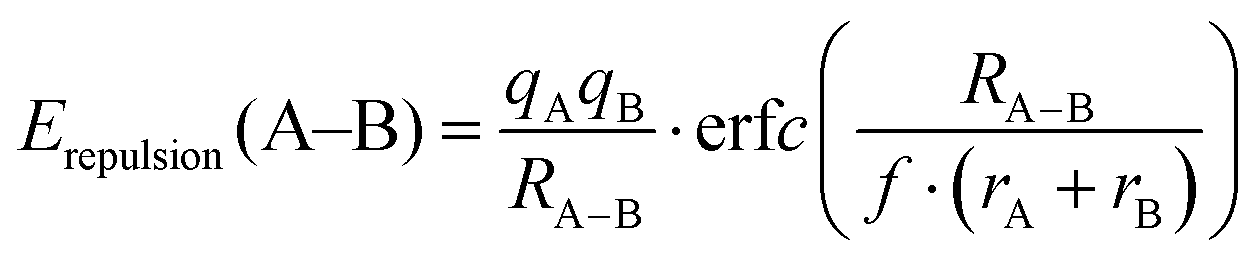
For the purpose of analysing EBVSE(Na) landscapes, Coulomb repulsions are considered only between mobile and immobile cations. Coulomb attraction terms are generally integrated into the Morse attraction term. The charge screening is based on an error function complement term
 | (4) |
3. Results
3.1. Fitting of experimental rate capability data
As a basis for our study we gathered rate performance data for about 25 NIB cathode materials from the recent literature22–47 focusing on room temperature data for composite electrode systems, where the mobility of electronic charge carriers should be high enough to be not rate limiting (either due to an intrinsically high electronic conductivity of the active cathode material or by carbon coating). Data for carbon-coated materials are therefore preferably adopted in this compilation.At this stage, we also avoided materials with median particle sizes below 40 nm to ensure that the rate performance at high C-rate is primarily limited by bulk ionic transport. Fig. 2 shows a compilation of the relative capacity for some of the polyanion-type Na+ ion insertion cathode materials used in this study vs. the logarithm of the rate of discharge. Here the relative capacity Qrel(C) is defined as the actual specific capacity Q of a cathode material at a given C-rate divided by its theoretical specific capacity Qtheoretical. We found in general similar trend in all the rate performances data – most compounds show considerable relative capacity at low C-rate, but eventually exhibit rapid fading where relative capacity drops to about 1/3 for every order of magnitude increase in C-rate. A qualitative approach might thus, as shown in Fig. 2, categorize the materials into the order of magnitude of the C-rate, where the rapid capacity fading sets in.
 | ||
| Fig. 2 Rate performance data of various polyanionic compounds recently reported in literature. All compounds eventually show rapid capacity fading at higher C-rates. Different categories are formed based on the C-rate at which rapid capacity fading is observed. Dotted lines correspond to the rate capability of materials predicted according to eqn (5a) assuming parameter values α = 0, β = 0.5 for all dotted lines, but varying values of W = 0.1, 1, 10, 100, or 1000 h−1. | ||
Peukert's law is – as mentioned above – found to be fundamentally unsuitable for a quantitative modelling of diffusion limited rate performance. In the plot of Qrelvs. logarithm of the C-rate of Fig. 2 any power law such as Peukert's law will invariably suggest a convex function, while experimental data consistently suggest a concave or sigmoidal shape of the Qrel(C) relationship. Thus Qrel(C) cannot be fitted meaningfully by eqn (2). For all the displayed systems, it is however possible to fit the variation of Qrel(C) with reasonable precision when assuming a stretched exponential relationship
 | (5a) |
 | (5b) |
The three parameters of this empirical relationship have clearly distinct physical meanings. The parameter α formally indicates the fraction of the theoretical capacity that remains inaccessible even at infinitely low C-rates, due to the consumption of mobile ions to form a SEI layer, due to an inadequate choice of the voltage window, etc. Practically, it will also include a capacity loss due to slow processes (at the electrode–electrolyte interface) for which the relaxation rate is below the studied C-rate “frequency” window.
The characteristic relaxation frequency W in eqn (5a) (or relaxation time w = 1/W in eqn (5b)) defines the point of inflection of the stretched exponential function, i.e. for a C-rate C = W the relative capacity dropped to 1/e ≈ 37% of its value at infinitely low discharge rate. Therefore, it may be convenient to use for W the unit h−1 that is commonly used to specify the C rate. The stretching exponent β defines the slope
 | (6) |
 | (7) |
 | (8) |
In reality, the Peukert law is however applied for relatively low rates, where the charge transfer kinetics at the electrode–electrolyte interface controls the reaction rate and overpotential, and this is often as much a question of system design as it is of electrode materials selection. Thus, despite such a formal analogy it should not be expected that the conventional values of k (1 < k < 1.5 describing the influence of activation overpotential effects on rate capability) can be related to the exponent β that characterises the effect of mass transport processes inside the electrode material on the rate capability. The formal analogy may in principle be utilized vice versa to set up a generalised version of eqn (5a) that describes the rate capability over a wider range of C-rates under the influence of both activation and concentration polarisation by
 | (9) |
It may be noted that parameter α in eqn (9) now refers to the fraction of the capacity that is lost when the C-rate significantly exceeds the relaxation frequency Wact of the charge transfer process at the electrode surface. In contrast to the Peukert equation this functional form ensures that 0 ≤ Qrel(C) ≤ 1 for any C-rate. Peukert exponents in the range 1 < k < 1.5 translate into 0 ≤ βact ≤ 1/3 and Wact will typically be orders of magnitude smaller than W. For most experimental capacity data sets C rates of the order of Wact will be below the range of studied C rates (C ≫ Wact) and experimental data can be fitted according to eqn (5a), i.e. assuming that concentration polarisation is the only relevant relaxation process.
3.2. Theory of rate performance of insertion electrode materials
The observed stretched exponential, i.e. Kohlrausch–Williams–Watts-like,48,49 relationship of eqn (5a) between relative capacity Qrel and C-rate may be understood as the consequence of two (or more) competing relaxation processes. To illustrate this, let us first consider a one-dimensional (1D) diffusional process assuming two independent relaxation mechanisms for the local relaxation of an ion at a site: the first process is a diffusion-independent relaxation involving the relaxation frequency C1 assumed for the sake of simplicity to be the same for all sites; the other involves an instantaneous relaxation triggered by the arrival of a second ion forming an interstitialcy pair. Therefore, the response function describing the polarisation decay after the sudden removal of a steady electric field can be written as the product of two terms:50–52 | (10) |
 | (11) |
 | (12) |
It may be noted that such a transition from non-Debye to Debye-type relaxation is consistently found from a variety of models for dielectric relaxations in complex disordered systems (which mostly have been originally elaborated to further a deeper understanding of ion conduction in glasses) such as Ngai's coupling concept,54 where C1 and C2 may be thought of as resulting from the independent short range and correlated long-range motion of ions, respectively, or Funke's jump relaxation model,55 where the competing relaxation rates correspond to the relaxation of the mismatch in charge distribution due to an initially successful hop via either a correlated backwards hop or by the rearrangement of the neighbouring ions. The latter concept appears particularly suited for a straightforward application to the complex pathways identified below in Section 3.3 of this paper.
3.3. Na+ migration pathways for Na-ion cathode materials
In this section, we will analyse both the C rate dependence of the discharge capacity and the pathways for Na+ ion migration pathways through the structures of a wide range of potential NIB cathode materials and discuss relationships between both ways of characterising the rate capability of the materials.Alluaudite-type “Na2Fe2(SO4)3” originally caught our attention due to its combination of low cost, high voltage and in fact decent rate performance.22 As compared to their phosphate counterparts which typically show ca. 3 V for Fe3+/Fe2+ redox couple, the more electronegative SO42− units in this compound lead to a high Fe redox potential of 3.8 V (vs. Na) and an initial reversible capacity of 102 mA h g−1.22 In the alluaudite structure edge-sharing bi-octahedral Fe2O10 are interconnected via corner-sharing SO4 tetrahedra to form a three-dimensional framework with open tunnels (cf.Fig. 3). These tunnels are occupied by three distinct types of Na+ ions (fully occupied Na(1) site and partially occupied Na(2), Na(3) sites).
 | ||
| Fig. 3 Structure of Na2+xFe2−x/2(SO4)3 (SG: C2/c) projected along (a) the b axis and (b) the c axis. Sodium ions are shown as yellow spheres and the types are marked accordingly. SO4 and FeO6 groups are represented by yellow tetrahedra and brown octahedra respectively. Black lines correspond to the unit cell. | ||
In their original work, Barpanda et al.22 noticed Fe deficiency while synthesizing “Na2Fe2(SO4)3” by low-temperature solid-state reactions (and hence the formation of FeSO4 as an impurity phase). We consider this to be an inherent feature of the material under the chosen synthesis conditions and modelled it more generally as Na2+xFe2−x/2(SO4)3 with a representative local structure model.21 The validity of this assumption was later corroborated by Oyama et al.58
Sodium ion migration pathways in “Na2Fe2(SO4)3” based on our BVSE method are shown in Fig. 4a and b. Long-range Na+ transport will be primarily one-dimensional along the c direction involving two distinct 1D paths. One path follows the Na(3)–Na(3) channel with a low migration barrier of 0.25 eV alongside desirable vacancies (50%). Fully occupied Na(1) sites are connected to this path and contributes additional mobile Na+. Another path involves Na(2) (site occupancy 0.75) also along the c direction with an activation energy of 0.48 eV. In general, there is a good agreement with the literature ab initio study.22 Quantitatively, the slight differences in migration barriers should partly be attributed to the different sodium content, as the DFT analysis and our BVSE modelling involves fully desodiated and sodiated structures, respectively. Indeed, in the BVSE analysis seen in Fig. 4c, fully occupied Na(1) sites, as to be expected, correspond to the lowest energy sites, while a ca. 0.2 eV higher site energy is found for the partially occupied Na(2) sites. In the hypothetical structure, Na0.125Fe2(SO4)3, from the DFT analysis, the Na(2) site becomes energetically more stable than Na(1) site. The energy barrier related to Na(3)–Na(3) hops is hardly affected, although the Na(3) site energy is significantly increased in the desodiated phase.
 | ||
| Fig. 4 Na+ ion migration pathways based on BVSE model represented by blue energy isosurfaces superimposed on a structure model of Na2Fe2(SO4)3 (a) projected along the fast channels c direction and (b) for a slice of the structure with 0.3 < x < 0.7 in the bc plane. This slice clearly shows two distinct 1D paths involving all three Na+ types. (c) Migration barriers for Na+ ion diffusion in Na2.25Fe1.875(SO4)3 based on BVSE model for the experimental crystal structure data from ref. 22. From left to right, the migration barriers correspond to transport long c axis for Na(2) channels, the connection between Na(2) and Na(1) sites, the local path allowing Na(1) to serve as additional Na+ source, and finally the fast Na(3) channel. Figure adapted from ref. 21. | ||
Based on the idealised stoichiometric structure model it appeared difficult to reconcile the excellent rate performance of this compound to its migration pathway topology (i.e. purely 1D conduction pathways). Based on previous studies, Fe site deficiency may open up additional pathways cross-linking the fast-ion conducting channels to higher dimensional pathway networks with moderate activation energy.11,16 To explore the role of vacancies at Fe sites, a local structure model was constructed based on a 1 × 1 × 2 superstructure by assigning the sodium sites according to their site occupancies. In particular, 1 out of the 16 Fe sites is vacant (experimentally refined Fe site occupancy ≈0.94). The superstructure was subsequently relaxed based on our softBV force-field.
As seen in Fig. 5a and b, our BVSE model reveals the role of vacant Fe2+ sites: they turn into interstitial sites for the Na+ which cross-link two adjacent Na(2) and Na(3) pathway channels. The resulting migration pathway is now effectively of a higher dimensionality than the original 1D model. Such cross-linking thus provides resilience against blocking defects, in combination with the facile migration along partially occupied 1D channels explains the experimentally observed high rate performance. As we showed in our previous study, BVSE reveals also other valuable insights into such local structure models incorporating Fe vacancies, including the modification of migration profiles along the paths in the vicinity of such defects.21 The concentration and distribution of Fe vacancies thus determines the overall rate performance and the practical dimensionality of the pathways. The outstanding rate performance (W = 244 h−1) reported recently by Meng et al.25 for Fe-depleted non-stoichiometric Na2.9Fe1.55(SO4)3 (i.e. x = 0.9) seems to confirm this interpretation.
 | ||
| Fig. 5 (a) Isosurfaces of constant BVSE for Na+ superimposed on the geometry-optimised local structure model of Na2.25Fe1.875(SO4)3 projected along the c axis. (b) Details from the graph (a) showing a superposition of Na+ migration pathways for different BVSE values projecting the central portion of the unit cell 0.3 < y < 0.7 (close to the Fe site vacancy in this local structure model) along the b axis. | ||
The Na0.44MnO2 structure type for which we mainly use Na0.61[Mn0.27Fe0.34Ti0.39]O2 (NMFTO)43 as an example, is characterized by the presence of two distinct tunnels (cf.Fig. 6a) for the Na+: part of the Na+ are hosted in large, S-shaped tunnels, and the remaining Na+ are hosted in smaller tunnels. This is in contrast with the NaFePO4 olivine structure type where all Na+ ion pathways are single channels (cf.Fig. 6c and d). In NaFePO4 (first prepared by ion exchange from LiFePO4)59 the one-dimensional pathways are fully isolated from each other and should thus be highly susceptible to blocking by defects.
 | ||
| Fig. 6 Crystal structure of (a) Na0.61[Mn0.27Fe0.34Ti0.39]O2 and (c) olivine NaFePO4 showing channels along c and b axis, respectively suitable for Na+ conduction as represented by blue energy isosurfaces. In the former compound, two types of tunnels exist: large, S-shaped tunnels (highlighted in purple) and small Na1 tunnel (highlighted in red) (b) migration pathways for Na0.61[Mn0.27Fe0.34Ti0.39]O2 along the S-shaped tunnel (purple) and Na1 tunnel (red). (d) Migration pathways for olivine NaFePO4 along the b channels involving sodium sites (Na1) and interstitial sites (i). | ||
In NMFTO, BVSE model reveals three crystallographically distinct energy minima (cf.Fig. 6b) in the S-shaped tunnels separated by shallow energy barriers (<0.2 eV), where all three sites are partially occupied by sodium ions (site occupancy factors for Na2: 0.797, Na3: 0.787, Na4: 0.195). Extremely short apparent Na+–Na+ distances (Na2–Na4: 1.49 Å) within this pathway are due to the distribution of locally mobile Na+ ions over multiple adjacent energy minima.
Such interconnected low-lying energy sites extend in the c axis to form independent 1D tunnels. Within each of these S-shaped tunnels, Na3–Na3 hops enable the formation of a continuous ribbon-like 1D pathway (cf. inset to Fig. 6b) that is expected to be more resilient against blocking by impurity defects than the Na1 channel. This is also in line with the respectable specific capacity observed experimentally at low cycling rate even with micrometre-sized particles.43 The lowest energy sodium site was found to be the Na1 site within the small tunnel, where the presence of vacancies along this Na1 path (ca. 10% vacancies) distinguishes this compound from other members of the Na0.44MnO2 family, for which the Na1 sites are fully occupied. Coupled with a moderate migration barrier of 0.39 eV, this supports the experimental observation that some Na+ ion extraction from these channels might be possible in NMFTO.43
The comparison among olivine, alluaudite and Na0.44MnO2 structure type cathode materials in terms of their rate performances in Fig. S1 (ESI†) shows that the rate-dependent capacity reduction is characterised by W = 0.5 h−1 in the single channels of olivine-type NaFePO4, by ca. W = 0.8–1.5 h−1 for Na0.44MnO2-related cathode materials with their 1D pathway ribbons, but reaches W = 40 h−1 or 244 h−1 for the alluaudite-type Na2+xFe2−x/2(SO4)3 (NFS) with x = 0.25 or x = 0.9 (the latter is also optimized by forming a composite with single-walled carbon nanotubes). It is to be stressed that such significant difference in rate performance between NFS and the other two structure types is largely due to the cross-linking among its 1D channels via Fe vacancies, giving rise to paths of higher effective pathway dimensionality. The tendency for cross-linking of pathways in the other two structure types is much weaker as the formation of a relevant concentration of antisite defects requires a substantial defect formation energy and would involve a reduced mobility in channel direction by the Fe on Na sites.
Among these, Eldfellite-type Na1+xFe(SO4)2 is one of the members of the sulfate-based cathode family and could be seen as compositionally related to the alluaudite-type iron sulfates discussed above.24 However, it has a distinct structure consisting of stacked layers of corner-sharing FeO6 and SO4 polyhedra (Fig. 7a), while two energy minima sites exist within the inter-layer spaces, namely the fully occupied Na1 sites (2c at 0, 0, 0.5) and interstitial site (4i at 0.226, 0.5, 0.278) that are vacant in the desodiated state. Since the two site energies differ only slightly, it might also be possible that sodium redistribution occurs upon sodiation to mitigate the Coulomb repulsion between Na on the equilibrium and interstitial sites (Na–i distance = 2.66 Å; i–i distance = 4.08 Å).
 | ||
| Fig. 7 (a) Eldfellite structure of NaFe(SO4)2 with layered Na+ conduction pathways being shown as cyan energy isosurface (b) reaction pathway involved for long-range 2D Na+ transport. Two symmetrically distinct energy sites were found, Na site and interstitial site. | ||
In the absence of structural reports for synthetic eldfellite, our pathway analysis is based on the structure data for the volcanic mineral Eldfellite.60 We relaxed the structure model computationally using our softBV-based forcefield. In the relaxed structure the occupied Na site becomes the most favourable site, but the energy of the i site is only minutely higher (cf.Fig. 7b). The high migration barrier of 0.93 eV also dictates that ion diffusion kinetics becomes increasingly sluggish as the charged state is approached. It may be noted here that (in the absence of experimental data for the sodiated state) this barrier is determined for the desodiated state, whereas pathways for all other compounds in this paper are studied for the discharged (i.e. sodiated) state and (by analogy to our findings for structure types where both sodiated and desodiated phases could be analysed) a somewhat lower barrier may be expected for the fully sodiated Na2Fe(SO4)2.
Details for further cathode materials featuring two-dimensional Na-ion migration paths including tavorite-type Na2FePO4F and maricite-type NaFePO4 are shown in the ESI† (cf. Fig. S3). In brief, the enhancement in rate performance (from W = 0.04 h−1 in maricite NaFePO4 to W = 1.67 h−1 in Na2FePO4F) can be related to the lower migration barrier (1.4 eV vs. 0.58 eV). The overall kinetics in Na2FePO4F is still expected to be relatively slow due to the moderately high migration barrier of 0.58 eV in combination with a lack of vacancies for sodium. Thus, a 2D transport network topology does not necessarily translate into high rate capability. In the next section, we demonstrate how high rate performance can be unlocked by lower migration barriers (<0.5 eV) while maintaining an at least 2-dimensional pathway network.
The lowest rate performance in this family of compounds is observed for the vanadium-based NaVP2O7 which crystallizes in space group P21/c with corner-sharing PO4 and VO6 groups (Fig. S4a, ESI†). A previous study on this compound as a cathode material reported poor performance, achieving only ca. 35% of theoretical capacity (108 mA h g−1) even at low cycling rate of 0.05C.34 Detailed pathway analysis of this compound is discussed in Fig. S4b (ESI†).
Among the Na2MP2O7 pyrophosphates with M = Fe, Mn, VO,63,64,67,68 consistently somewhat higher rate capabilities are noted for the case M = Fe (the rate performance data for three Na2−2xFe1+xP2O7 samples correspond to relaxation frequencies W of 7–21 h−1) than for M = Mn or M = VO (both with W ≈ 2–4 h−1), while both perform significantly better than the V-compound described above (where the relaxation frequency can only be roughly estimated to W ≈ 0.04 h−1 due to the limited range of experimental data). A study of a Na2FeP2O7–CNT composite28 even suggests W to be as high as 45 h−1. Here we explore the structural origin of such differences.
Na2FeP2O7, has only been characterized in 2012 independently by three research groups who reported different polymorphs – adopting either P![[1 with combining macron]](https://www.rsc.org/images/entities/char_0031_0304.gif) structure (Barpanda et al.65 and Honma et al.61) or P1 structure (Kim et al.62) with a reversible capacity of 90 mA h g−1 at 3.0 V (vs. Na/Na+). The Na+ pathway topology we found for Na2FeP2O7 starting from the P structural data of ref. 63 (see Fig. S5, ESI†) is in excellent agreement with a previous computational study based on atomistic methods.64 Based on our BVSE analysis, long-range Na+ transport in this compound is effectively two-dimensional in the (011) planes due to the high barrier (0.83 eV) involved with Na1–i1 hop which acts as connection between adjacent (011) planes. Na+ transport predominantly takes place in the [0, 1, −1] direction, involving ribbon-like 1D paths containing fully occupied Na2 and interstitial site i1, where i1 connects two adjacent Na2. Such Na2–i1 paths are the bottlenecks for 1D percolation, with a corresponding barrier 0.33 eV.
structure (Barpanda et al.65 and Honma et al.61) or P1 structure (Kim et al.62) with a reversible capacity of 90 mA h g−1 at 3.0 V (vs. Na/Na+). The Na+ pathway topology we found for Na2FeP2O7 starting from the P structural data of ref. 63 (see Fig. S5, ESI†) is in excellent agreement with a previous computational study based on atomistic methods.64 Based on our BVSE analysis, long-range Na+ transport in this compound is effectively two-dimensional in the (011) planes due to the high barrier (0.83 eV) involved with Na1–i1 hop which acts as connection between adjacent (011) planes. Na+ transport predominantly takes place in the [0, 1, −1] direction, involving ribbon-like 1D paths containing fully occupied Na2 and interstitial site i1, where i1 connects two adjacent Na2. Such Na2–i1 paths are the bottlenecks for 1D percolation, with a corresponding barrier 0.33 eV.
The “large tunnels” previously reported contain partially occupied Na4, Na5 and Na6.65 Within these tunnels, two symmetrically equivalent, adjacent energy local minima separated by a barrier of <0.05 eV are occupied by Na6 each (occupancy 1/3), while Na4 position coincides with the saddle point (occupancy 1/3). This can be simplified by the description of a single Na type (hereby named ‘Na4/6’) with total occupancy 1.0, delocalised in this low energy region. On the other hand, Na5 sites are nearby with site energy ca. 0.1 eV higher than Na4/Na6. In fact, the Na5 site energy is the highest among all occupied Na sites, suggesting that this is the least favourable site for Na+. This is in line with experimental observation that Na5 occupancy is 0.5 while that of Na1, Na2, Na3, and Na4/Na6 is 1.0.
The percolating 1D channels are subsequently connected by the large tunnels to form 2D network via the path between the relatively high energy (and hence low occupancy) Na5 sites. The partial occupancy of Na sites is crucial in lowering the effective energy barrier for 2D percolation via Na5–Na5 hops to 0.40 eV yielding a more robust network when compared to isolated 1D paths. Based on the overall reaction pathway, Na3 is expected to constitute and additional source of Na+ ions for extraction via a Na3–Na5 path with a moderate barrier of 0.46 eV (these Na3 sites may be viewed as “side branches” to the main “large tunnels”). Indeed, in the desodiated phase β-NaFeP2O7 (SG: P), Na3 site occupancy drops to 0.5.63 Two further members of the pyrophosphate family with M = Mn (W = 4.3 h−1) and VO (W = 2.9 h−1) that exhibit lower rate performances than Na2FeP2O7 are briefly discussed in the ESI† (see Fig. S6).
To reinforce the importance of built-in sodium site vacancies towards rate performance, we turn to the recently reported sodium-deficient Na1.63Co1.13P2O7 (W = 15 h−1).36 We found the pathway topology to be similar to Na2FeP2O7 albeit with higher migration barriers (0.52 eV for 1D, 0.61 eV for 2D). Despite similar migration barriers in both Na1.63Co1.13P2O7 and Na2MnP2O7, the former (W = 15 h−1) is clearly outperforming the latter (W = 4.3 h−1) at higher C-rates. While all sodium sites are fully occupied in Na2MnP2O7, Na1.63Co1.13P2O7 exhibits highly disordered sodium sites akin to the disordered Na5 and Na4/6 sites in Na2FeP2O7. Therefore, as we move from Na2FeP2O7 to Na1.63Co1.13P2O7, the minor decrease in W is mainly related to the increasing migration barrier, while from Na1.63Co1.13P2O7 to Na2MnP2O7, further drop in W is largely due to the diminishing availability of vacancies in sodium sites.
Our model of Na1.63Co1.13P2O7 also includes the excess Co2+ and presence of Co3+ to compensate for sodium deficiencies. Due to the higher BV sum of Co on Co1 this site is considered to contain a mixture of (redox inactive) Co3+ and Co2+ while the Co2 site is occupied by Co2+ in the sodiated form. The remaining excess Co2+ ions are assigned to the Na6 sites as suggested by ref. 36. As these Na6 sites are side branches to the main percolating pathway, we do not expect the co-presence of Co2+ at these sites to block the sodium extraction. Interestingly, the unusually high value of α = 20% of Na1.63Co1.13P2O7 (i.e. 20% of theoretical capacity inaccessible even at low C-rate) might suggest that these Co2+ ions at the Na6 sites, which should contribute to ca. 13% of the total theoretical capacity, are also redox-inactive.
The case of Na1.63Co1.13P2O7 highlights the strategy of off-stoichiometry synthesis to improve the rate performance via disordered sodium sites throughout the (dis)charge cycle. Since Na2FeP2O7 has naturally disordered Na4/6 and Na5 sites, intuitively this strategy should have limited success here. Indeed, we find that the pathway characteristics in the related Na2−2xFe1+xP2O7, in particular the case of Na1.56Fe1.22(P2O7)2,66 are less favourable than in Na2FeP2O7 in two ways. Firstly, some of the corresponding migration barriers in Na1.56Fe1.22(P2O7)2 are significantly increased. While the barrier for 1D percolation remains at 0.37 eV (marginally higher than 0.33 eV in Na2FeP2O7), the 2D barrier increases to 0.69 eV (as compared to 0.40 eV in Na2FeP2O7). Secondly, the link between the 1D channels now no longer occurs via Na5–Na5 hops, but rather via the long Na5–Na3–Na1–Na2 (following the same sodium site nomenclature as in Na2FeP2O7). Furthermore, the latter path is now susceptible to blocking as the Na1 site is partially occupied with Fe2+ in Na1.56Fe1.22(P2O7)2. Therefore, the effectiveness of higher dimensionality pathway in Na1.56Fe1.22(P2O7)2 is compromised by both blocking effects as well as the resulting higher migration barrier.
More recently, Kim et al. reported Na7V3(P2O7)4 as a 4V cathode material for Na-ion battery.23 This compound retains an impressive relative capacity of ca. 80% even at 10C cycling rate and seems to have a second plateau of the relative capacity above this value, so that the fit yields the extraordinary value of W ≈ 141 h−1. Unsurprisingly, we found that this compound bears an unusually low migration barrier and contains vacant sites within the pathway. Our model reveals that Na7V3(P2O7)4 allows Na+ conduction involving Na3 and Na4 in an extended 2D network in the ab-plane with a low migration barrier of 0.23 eV (cf.Fig. 8c). While all the sodium sites are reported experimentally to be fully occupied, the availability of low-lying interstitial sites i1 within the 2D backbone should aid the overall ionic transport. Furthermore, the polyanion framework intersperses with the 2D networks (cf.Fig. 8a and b), in contrast to NaMO2-type layered compound where sodium ions constitute a whole layer between adjacent polyanion slabs. The more robust framework in the former therefore ensures a high mechanical stability against sodium extraction/insertion. This is also verified experimentally where the observed volume change is only 1%.23
 | ||
| Fig. 8 (a) Crystal structure of Na7V3(P2O7)4 (SG: C2/c) and (b) energy isosurfaces representing Na+ conduction pathway projected along b-direction. Black solid line highlights the unit cell. (c) Reaction pathway shows a 2D percolating network containing Na3, Na4 and involving a low barrier of 0.23 eV as well as additional sodium ions (Na1, Na2) which are accessible via moderate migration barriers of 0.3–0.4 eV. | ||
An extension to the pyrophosphate family is the mixed phosphates involving (PO4)3− and (P2O7)4− polyanion groups (cf. Fig. S7a, ESI†). Mixed phosphates of the general formula Na4M3(PO4)2P2O7 (M = Mn,29 Fe30,31) have shown respectable rate capability as evidenced in Fig. 2. In both compounds, we found similar pathway topology consisting of interconnected 1D paths of low to moderate barriers to form an overall 3D percolating network for long-range ionic transport. The estimated migration barrier for at least 1D transport is only approximately 0.30 eV and 0.28 eV for M = Fe and M = Mn, respectively (cf. Fig. S7b, ESI†), in close agreement with an earlier molecular dynamics study.67 Higher-dimensional pathways are subsequently activated at higher barriers. This combination of energetic considerations clearly explains their superior performance over Na2MnP2O7 and Na2VOP2O7. However, there is a lack of readily available low energy vacant sites within the sodium ion pathways of these mixed phosphates that may explain the relatively high fraction of the theoretical capacity that cannot be realised even at low rates.
Another promising mixed phosphate compound is Na7V4PO4(P2O7)4 (SG: P![[4 with combining macron]](https://www.rsc.org/images/entities/char_0034_0304.gif) 21c) as shown in Fig. 9a.32 Our pathway model in Fig. 9b reveals that the overall conduction network consists of two independent networks (both long-range percolating): 1D paths along c-direction and 3D paths formed by linking cross-shaped local clusters. These two networks are separated by a moderate barrier of 0.53 eV, while the effective migration barriers for the 1D and 3D network associated with long-range transport are 0.33 eV and 0.46 eV, respectively (cf.Fig. 9c). There is also a considerable amount of low-lying interstitial sites in the Na2 channels. A qualitative consideration of these factors thus reasonably qualifies this compound to have a rate performance on par with or better than the previously discussed mixed phosphates compounds. In relation to this, it should be noted that the rate performance shown in Fig. 2 for this compound is associated with nanosizing and hierarchical composite design. Nonetheless, this highlights the fact that a compound which has by default a decent rate capability without special optimizations stands a chance to compete with top contenders with elaborate particle morphology design.
21c) as shown in Fig. 9a.32 Our pathway model in Fig. 9b reveals that the overall conduction network consists of two independent networks (both long-range percolating): 1D paths along c-direction and 3D paths formed by linking cross-shaped local clusters. These two networks are separated by a moderate barrier of 0.53 eV, while the effective migration barriers for the 1D and 3D network associated with long-range transport are 0.33 eV and 0.46 eV, respectively (cf.Fig. 9c). There is also a considerable amount of low-lying interstitial sites in the Na2 channels. A qualitative consideration of these factors thus reasonably qualifies this compound to have a rate performance on par with or better than the previously discussed mixed phosphates compounds. In relation to this, it should be noted that the rate performance shown in Fig. 2 for this compound is associated with nanosizing and hierarchical composite design. Nonetheless, this highlights the fact that a compound which has by default a decent rate capability without special optimizations stands a chance to compete with top contenders with elaborate particle morphology design.
 | ||
| Fig. 9 (a) Crystal structure of Na7V4PO4(P2O7)4 (space group P21c) and (b) energy isosurfaces representing Na+ conduction pathway projected along c-direction. Black solid line and red dotted line highlight the unit cell and the 1D pathway along c respectively. (c) Pathway topology of this compound can be described by the reaction graph where two conduction network (one 1D and the other 3D) are separated by a moderate barrier of 0.53 eV. The 3D network itself is made by inter-linking cross-like clusters where each cluster contains four identical Na1–Na3 local migration paths. | ||
Finally, the chemistry of pyrophosphates can be further enriched with the introduction of fluorides into the structure. The first sodium fluoropyrophosphate Na-ion battery cathode material with an open three-dimensional framework, Na4NiP2O7F2 (SG: Imma), was reported by Kundu et al.68 and found to have a high average voltage of ca. 5 V although only the Ni2+/3+ redox couple could be activated limiting the theoretical capacity to about 75 mA h g−1. Ab initio calculations by the same group suggest a low migration barrier of 0.36 eV along the [010] direction and their experimental determination of the ionic conductivity (finding value of 0.32 eV) suggest that the material should be able to sustain high rate performance, though this remains to be experimentally verified. Details on the Na+ paths in this compound can be found in the ESI† (see Fig. S8).
 | ||
| Fig. 10 (a) Crystal structure of Sidorenkite Na3MnPO4CO3 with energy isosurfaces between stacked slabs made of PO4 (light purple polyhedra), MnO6 (dark purple octahedra) and CO3 (brown triangle) groups. (b) Reaction pathway of a sodium ion in the b–c plane (inset) for long-range transport. | ||
The combination of high-dimensional pathway and moderate migration barriers (slightly above 0.5 eV) are in line with the observed relaxation frequency (W = 1.5 h−1 similar to the one of Na2FePO4F both in W and migration barrier), but the absolute capacity is limited by an unusually large fraction of the theoretical capacity that remains inaccessible even at low C rates (α ≈ 0.31). Assuming that Na(2) sites are fully extracted so that Mn is oxidised to Mn3+, achieving 100% of theoretical capacity (i.e. an oxidation to Mn4+) requires an extraction of 50% of the Na from Na1 sites, which involves a slightly higher barrier at 0.66 eV. The original authors already offered several possible reasons for the low capacity, including defects due to intense ball-milling. In a separate study, it was found that long ball-milling time caused excessive formation of both Mn2+/Na(1)+ and Mn2+/Na(2)+ antisite defects (especially the latter) that in this structure are expected to reduce ionic conductivity and rate capability.69
To investigate the effects of such defect formation, we have created and relaxed two 2 × 2 × 2 supercell structures containing these defects respectively. Interestingly, in both cases, we observe that the displaced NaMn′ ion facilitates the cross-linking of two adjacent conduction planes. One such example is shown in Fig. 11 for the case of a Mn/Na1 antisite defect, where the cross-linking path (Na1–i–NaMn–Na1) involves a moderate migration barrier of ca. 0.5 eV comparable to the long-range transport barrier 0.52 eV in the fully ordered structure. Therefore, these sodium ions at defect sites are expected to be equally extractable. The downside of this antisite defect formation is that it negatively affects the more important Na2–Na2 backbone of the long-range migration path. A MnNa2˙·blocks four Na2–Na2 paths and four Na1–Na2 paths and a MnNa1˙ raises the migration barrier of two out of the four adjacent Na2–Na2 paths significantly from 0.52 eV to 0.75 eV (cf.Fig. 11) due to the stronger Coulombic repulsion from doubly-charged Mn2+ and Coulomb attraction to a nearby CO3 group that is tilted towards Mn2+ (i.e. closer to the saddle points of the high-barrier Na2–Na2 paths).
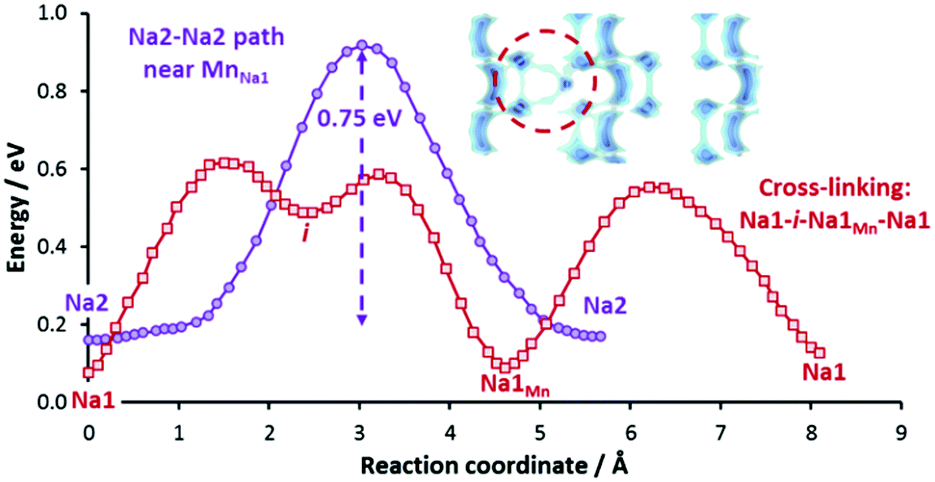 | ||
| Fig. 11 Reaction pathway in the structure incorporating a Mn/Na1 antisite defect pair. The NaMn‘ defect allows cross-linking of adjacent 2D planes via Na1–i–Na1Mn–Na1 path (red graph). Visualization of such cross-linking is highlighted in the dotted circle. At the same time, some Na2–Na2 paths become less accessible due to the higher barrier of 0.75 eV in the vicinity of MnNa1. | ||
Such a situation involving a sacrifice of backbone effectiveness for an increase in pathway dimensionality in other directions may be analogous to the previously studied case of LiFePO4, where a small concentration of Li/Fe antisite defects allows for cross-linking of neighbouring Li extraction of channels, while an excessively high antisite defect concentration renders the material electro-inactive by blocking the backbone of the ion paths.70,71 It is therefore important, in the design of high rate capability electrode materials, to study antisite defect formation involving sodium sites, especially those which participate in the overall ionic conductivity.
In this section, we reinforce our argument by focusing on another structure type that contains a high fraction of unoccupied sites within the pathways: the “Na superionic conductor” (NASICON) structure type Na3M2(PO4)3. In the rhombohedral high temperature β phase (space group R![[3 with combining macron]](https://www.rsc.org/images/entities/char_0033_0304.gif) c) the NASICON structure contains a 3D network of interstitial spaces of a size particularly suitable for Na+ ion diffusion.72,73
c) the NASICON structure contains a 3D network of interstitial spaces of a size particularly suitable for Na+ ion diffusion.72,73
Among the Na3M2(PO4)3 compounds, we will discuss here the example of Na3V2(PO4)3 that gained particular attention due to the ability to exchange more than 1Na+/e− per transition metal ion. The compound displays three potential plateaux located at 3.4, 1.6 V and 0.3 V vs. Na/Na+, where the highest potential is related to the oxidation of V3+ to V4+ in Na1V2(PO4)3 that is accompanied by a moderate volume contraction (7.4% of unit cell volume).74–76 The lower two potential plateaux corresponding to the stepwise reduction of V3+ to V2+ in Na4V2(PO4)3 and finally Na5V2(PO4)3 will not be discussed here as the low voltage makes them more suitable for anode applications.
Lim et al.75 suggested that the rhombohedral phase is retained and Na(1) remains fully occupied while the Na(2) site is electrochemically active when NaxV2(PO4)3 is desodiated from x = 3 to x = 1 and that this oxidation should occur as a two-phase reaction. Jian et al.77 find that both Na site types are partially occupied in Na3V2(PO4)3 with a 0.843 occupancy of the 6b site (M1) and a 0.719 occupancy of the 18e site (M2) at room temperature and that lowering the temperature to about 100 K would be necessary to for a full occupancy of M1 site (reducing the M2 site occupancy to 2/3). In Na1V2(PO4)3 the M2 site is completely desodiated, whereas the site occupancy factor of M1 increases to 0.94 (the location of remaining 0.06Na could not be identified).
Our pathway model for Na3V2(PO4)3 as shown in Fig. 12 demonstrates that Na+ migrates through the 3D-percolating network by consecutive M1–M2–M1 hops. A barrier of 0.39 eV is calculated for the sodiated phase, in good agreement with a recent ab initio study.78 For the fully desodiated phase with vacant M2 sites both the migration barrier and the site energy difference between M1 and M2 sites increase by about 0.07 eV. It may be noted in passing that the pathway for the sodiated phase involves a plateau-like energy region between M1 and the saddle point, which is reminiscent of the ‘third sodium site’ M3 in previous NASICON structure refinements where the Na density distribution on the essentially fully occupied M1 site is described by Na+ partially occupying both M1 and nearby M3 sites.79 Since the energy minimum is very shallow, we adopt the simpler model involving only M1 and M2 sites.
 | ||
| Fig. 12 Top: NASICON-type structure of Na3V2(PO4)3 with energy isosurfaces showing 3D Na+ pathway interweaving the polyanionic framework of PO4 (red octahedra) and VO6 (purple) groups. Unit cell is shown by the black rectangle. Bottom: Migration pathways of Na+ within the 3D network involving M1–M2–M1 hops with moderate barrier energy of 0.39 eV and 0.46 eV for the sodiated and desodiated phases respectively. The M2 site energy increases as the structure gets desodiated. Inset shows that each M1 site is connected to six adjacent M2 sites. | ||
Based on the increasing site preference of Na+ for the M1 site with decreasing sodium content as seen in Fig. 12, the redistribution of some Na+ from M2 to M1 sites during desodiation appears plausible, as the difference in EBVSE(Na) between these sites increases from 0.11 to 0.18 eV. Based on recent structure refinements an earlier model of a two-step desodiation with equal occupancy of both Na sites at all stages of desodiation was revived in the literature,80,81 but such a model can be clearly ruled out from the observed energy profiles. The recent experimental observation that the anyways favourable power performance is substantially enhanced further by slight Mg-doping in Na3V1.95Mg0.05(PO4)382 can also be rationalised from our pathway model. Mg doping on the vanadium site limits desodiation to Na1.1V1.95Mg0.05(PO4)3 preventing a complete ordering of Na on the Na(1) site which would be the power performance-limiting stage during deep cycling.
Although other (electronically insulating) NASICON variants such as Na3Zr2(SiO4)2(PO4) have exhibited much lower activation energy of 0.2–0.35 eV, the moderate barrier in Na3V2(PO4)3 (0.39 eV) coupled with the robust 3D pathway with numerous built-in vacancies justify a high rate capability of this compound (W ≈ 95 h−1). It should be emphasized that an analysis focusing on just one of the criteria is not sufficient to make a useful prediction of rate performance: when comparing the pyrophosphates e.g. Na4Mn3(PO4)2P2O7 (W = 54 h−1) and Na3V2(PO4)3 (W = 95 h−1) just based on the migration barriers within the pathways a similar power performance would be expected. However, Na3V2(PO4)3 retains relatively higher capacity for the 10–100C range. Such a decent rate capability is believed to originate from the built-in sodium site vacancies, so that the activation energy for ion transport does not need to include a defect formation component. Even in the fully sodiated NASICON phase there is already a significant amount of vacancies in the pathway network, corresponding to one-third of the total sites (M1 + M2). This and not the migration energy alone distinguishes such good ionic conductors (or high rate performance electrode materials) from most other compounds for which all the low energy sites in the pathways sites are fully occupied. The high concentration of vacancies facilitates long-range ion transport by ensuring high success rate for ion hops. It is of course a well-established strategy to induce the formation of vacancies at alkali ion sites via aliovalent doping to improve ionic conductivity.83 We believe the presence of sodium site vacancies in Na3V2(PO4)3 contributes to the considerable capacity at high C-rate.
 | ||
| Fig. 13 (a) Crystal structure of Na3V2(PO4)2F3 in the Amam space group, containing layered Na+ conduction pathways (shown as energy isosurfaces) (b) projection along c-axis showing energy isosurfaces of Na+ pathways involving interconnected ring-like local loops via Na3–Na3 path (bottleneck for 1D percolation) and i2–i2 path (bottleneck for 2D percolation) (c) reaction pathway showing relevant barriers involved in the 2D-percolating network. | ||
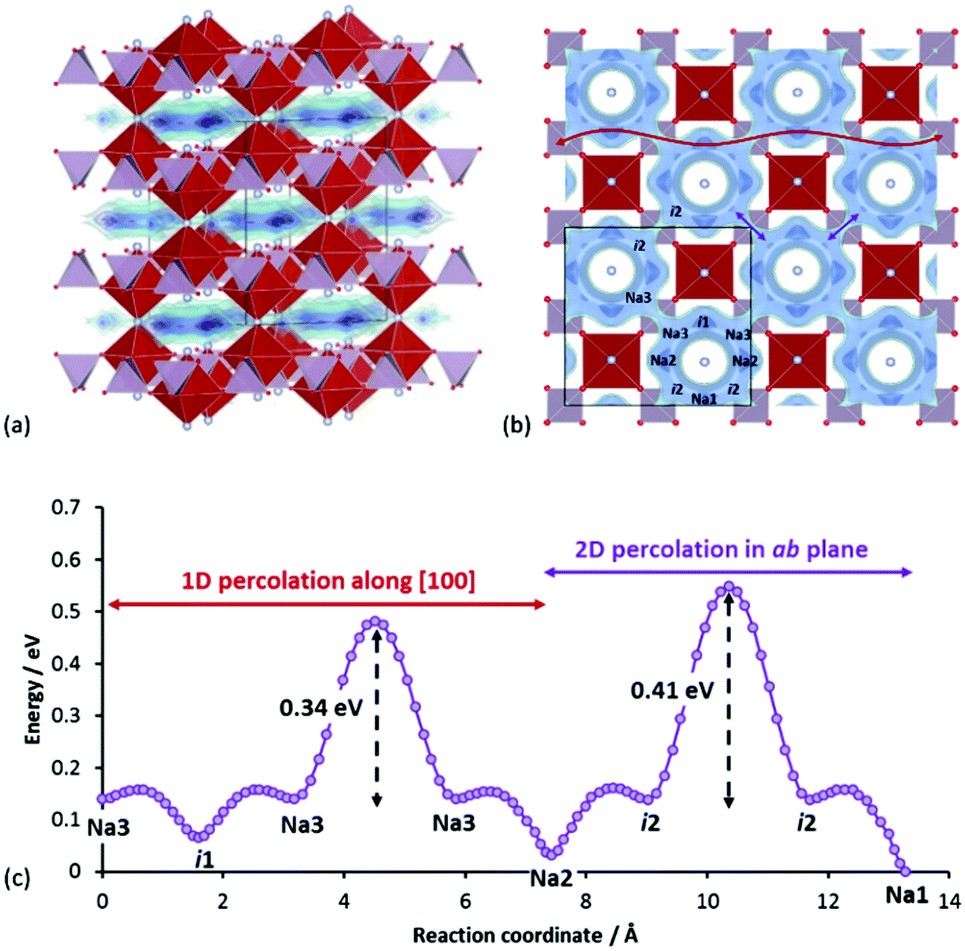
According to our calculations, the Na+ pathways in Na3V2(PO4)2F3 show a slight in-plane anisotropy, where “ring-like” local pathway loops are interconnected via Na3–Na3 sodium sites and i2–i2 interstitial sites. The Na3–Na3 path was found to have lower barrier, leading to 1D percolation first prior to 2D percolation via i2–i2 path. As the site energy increases from Na1 (0 eV) to Na2 (0.03 eV) to Na3 (0.14 eV), occupancy decreases from Na1 (1.0) to Na2 (0.65) to Na3 (0.30). We found also two other relevant unoccupied energy sites (i1, i2) at (0.250, 0.031, 0.500) and (0.104, 0.396, 0.500) respectively. The labelled crystallographic sites, relative site energies and the corresponding migration barriers among all the energy sites are shown in Fig. 13b and c. Also, the average number of sodium ions in a ring approximates three (since the multiplicity of Na2 and Na3 sites is 2 and the site occupancies sum ≈1.0).
Interestingly, this compound mimics the excellent ionic conductor beta-alumina in two ways. Firstly, both compounds exhibit fast Na+ motions in a two-dimensional pathway, although strictly speaking in Na3V2(PO4)2F3 this facile motion is limited to within each ring. Secondly, both compounds utilize a 2D conduction pathway which is contained within a three-dimensionally connected polyanionic framework, unlike layered NaxMO2 where the transition metal slabs are completely separated from each other. In Na3V2(PO4)2F3, the inter-transition metal layer connection is made via a shared F− ion between two VO4F2 groups. This may also explain the low volume change (∼2%) upon cycling,84 since the Na+ ions play less of a role in supporting the structure mechanically during cycling, in contrast to the case of layered NaxMO2.
With a “liquid-like” low energy pathway within each local loop (average local barriers = 0.11 eV), it is anticipated that intra-ring ionic motion will be highly correlated. Hops targeting occupied sites may still be successful, if the ion at the target site can be pushed across the low barrier to another position within the ring and a Na+ that fails to hop to a fully occupied adjacent ring can quickly rearrange itself in the current ring to find an alternative “exit” to another adjacent ring that can accommodate it. Intuitively, this promotes the effectiveness of the 2D network in terms of sodium extraction.
3.4. Design guidelines from correlations between rate performance and pathway characteristics
So far we have essentially demonstrated the relevance of three qualitative materials design criteria for high rate performance electrodes: low migration barrier in at least one direction, high pathway dimensionality and a sufficient excess number of low energy sites for the mobile species. Here we aim to proceed beyond such a qualitative treatment by establishing a quantitative figure of merit that allows us to directly predict the achievable rate capability for a given structure type. In doing so we utilize the characteristic C-rate W, i.e. the C-rate where the capacity drops to 1/e of its low rate value and the stretching exponent β that both have been introduced in eqn (5a) (see Section 3.1). Fig. 14 implies that for the covered range of sodium cathode materials the value of W can be empirically correlated, as shown in eqn (13), to an activation term involving the ratio between activation energy and effective pathway dimensionality to the power of 1.5 | (13) |
 | ||
| Fig. 14 Dependence of the achievable critical C-rate W, the relevant migration barrier height EA and the effective pathway dimensionality d. The straight line in the double-logarithmic plot indicates the regression according to the fit function of eqn (13). | ||
From Fig. 14 it may e.g. be concluded that in order to achieve a rate capability corresponding to W > 10 h−1 (in other words a capacity > 37% of the low rate capacity at a C-rate > 10C), the ratio of migration barrier to pathway dimensionality EA/d1.5 should be smaller than ca. 0.15 eV. A significant part of the remaining scatter in Fig. 14 will be due to the different particle sizes l of the samples from the underlying experimental literature reports. The scatter of experimental conditions, a probably relatively narrow range of particle sizes and incomplete data in the experimental literature reports did not permit to empirically include the particle size into eqn (11) for all the systems. Still the coefficient f2 ≈ 0.5 can be understood as a signature of the correlation between the diffusion length and the square root of the activation energy for the diffusion.
The example of particle-size dependent rate-capability data for Na3(VO)2(PO4)2F from ref. 88–91, shown in Fig. 15 emphasizes that W will follow a W ∝ l−γ dependence on the median particle size l that constitutes an approximate measure of the required diffusion length inside the particle. For the case of Fig. 15 the exponent γ is 1.2. The necessary diffusion length for completion of the (de)sodiation reaction will also depend on the particle shape as well as for compounds with low-dimensional pathways on the orientation of the transport pathways relative to the long and short particle extensions. Therefore, it must be expected that the pathway tortuosity exponent γ will depend on the pathway dimensionality. The diffusion length will, as discussed above, in compounds with one-dimensional conductors also be strongly influenced by the concentration of blocking defects (see e.g. also ref. 70, 71 and 92).
 | ||
| Fig. 15 Dependence of the achieved critical C-rate W in Na3(VO)2(PO4)2F on the median particle size as an approximate measure value for the length of the effective ion diffusion inside the particle. Data points refer to fits to the rate performances reported in four literature studies.88–91 The solid line corresponds to a power law fit W ∝ l−γ. | ||
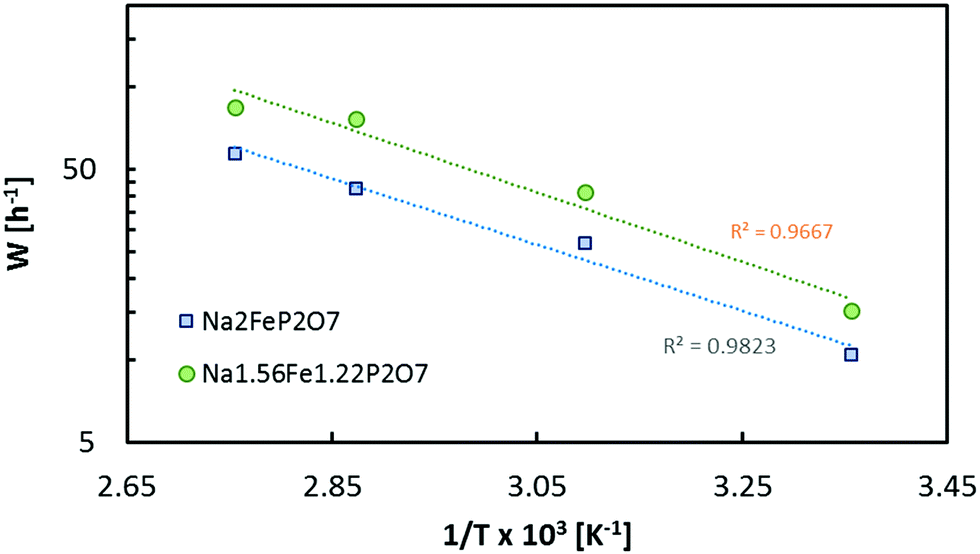
Based on the assumption that diffusion inside the cathode material limits the rate performance, it is obvious that the achievable rate performance of the cathode materials will also depend on temperature as expressed in eqn (13). Thus, testing the temperature of the rate performance may serve as a plausibility test. As an example, data from ref. 27 for Na2FeP2O7 and Na1.56Fe1.22P2O7 confirm that the temperature dependence of the rate performance can be expressed by the exponential relationship between W and T (cf.Fig. 16)
| W = f1e−A/kBT, | (14) |
 | ||
| Fig. 16 Dependence of the achieved critical C-rate W in two selected pyrophosphate compounds on the operating temperature. Data points refer to fits to the rate performances reported in ref. 27. The dotted lines correspond to a W = ce−b/T fit. | ||
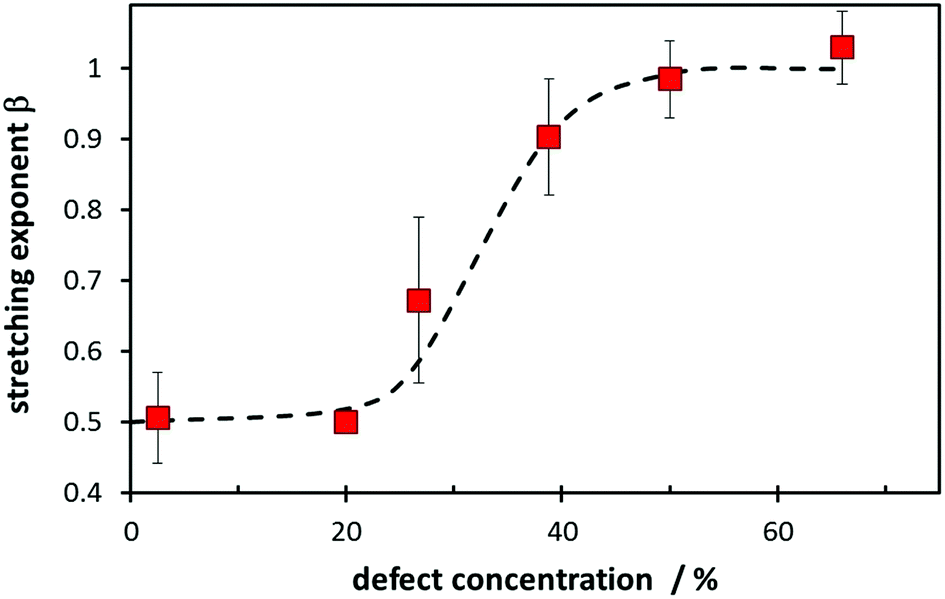
Besides W, the value of the stretching exponent β in eqn (5a) also represents a structural feature. Essentially it relates to how complex the transport process will be. In more ordered compounds where defect formation and defect migration have to be considered and most attempted hops will be unsuccessful, a value of β ≈ 0.5 is to be expected, while in “fast-ion conductors” with a high concentration of mobile defects (which may be interstitial ions of or vacant low energy sites for the mobile species) it will approximate β ≈ 1 as the creation of additional defects plays no significant role for the anyways high success rate of elementary migration steps for mobile ions with sufficient kinetic energy. Indeed Fig. 17 shows a transition from β ≈ 0.5 to a value close to β ≈ 1 as a function of the “defect concentration”, which for the sake of simplicity is here just taken as the sum of the interstitial Na+ ions and the number of vacant low energy Na sites, relative to the number of Na per unit cell. More refined measures for the “defect concentration” may further reduce the scatter of the values.
 | ||
| Fig. 17 Dependence of the stretching exponent β on the number of defects of the mobile species relative to the number of sodium ions per formula unit for the studied compounds. To reduce experimental scatter results for compounds with similar defect concentrations are averaged. Error bars indicate the standard deviation of this average. The broken line is a guide to the eye. | ||
A maybe not so intuitive consequence of the different stretching exponent values β for different cathode materials may be worth noting. It implies opposite design guidelines for batteries and battery–supercapacitor hybrid systems (pseudo-capacitors). Pseudo-capacitors operate at high C-rates ≫ W and therefore it will be advantageous to choose materials for which the exponent β is low (ideally 0.5), whereas for high rate batteries operating at rates just below W it is crucial to use a material with β ≈ 1 to retain a high capacity. At a rate of W/4 a material with β = 0.5 e.g. retains only 61% of its capacity, while for β = 1 it would retain 78% of its low-rate capacity. When operated at a rate of 4W a material with β = 0.5 still has 13.5% of its low-rate capacity whereas for a material with β = 1 the capacity dropped already to 1.8% of its low-rate value. For battery materials with high-dimensional pathways but low defect concentrations (and hence β ≈ 0.5) the capacity at C-rates slightly below W can be significantly enhanced by introducing redox-inactive aliovalent dopants that boost the defect concentration (while in compounds with low-dimensional pathways this holds only if the dopants do not block the pathways).
The third empirical parameter α, i.e. the fraction of the not realised theoretical capacity at low rates comprises a variety of effects such as interfacial kinetics, pathway blocking by impurities, chemical incompatibilities of cathode components, SEI formation, low electronic conductivity, volume changes and phase transitions during (de)sodiation etc. so that we cannot expect to derive a strong correlation to any structural feature. Still, it is observed that a high pathway dimensionality, low activation energy (and thus a high W value) tends to favour a low α value, i.e. an almost complete utilisation of the theoretical capacity.
4. Conclusions
In this work, we have proposed to quantify the rate performances of sodium cathode materials in half-cells using the stretched exponential function. This allows a systematic comparison among different compounds in terms of the critical C-rate W, inaccessible fraction of theoretical capacity α, and defect concentration-dependent β. We have also shown that W is fundamentally related to the underlying structural features as they in turn determine the pathway topology, which can be characterized by two main descriptors: limiting migration barrier EA and pathway dimension d. The dependence of W on particle size and temperature is also demonstrated. We believe our work would facilitate a deeper understanding of the various contributing factors towards the overall rate capability and provide a systematic guideline for future designs of high rate performance NIBs.Glossary of main symbols
| A | Numerical factor |
| b A–X | Bond valence parameter |
| C | Discharge rate |
| d | Dimension of percolating pathway for Na+ ionic conduction |
| D 0 | Bond breaking energy |
| E A | Ion migration barrier |
| E BVSE | Bond valence site energy of the mobile ion |
| E repulsion | Screened cation–cation or anion–anion repulsion energy |
| e | Euler's number |
| f, f1, f2 | Numerical factors |
| I | Current |
| k | Peukert exponent |
| k B | Boltzmann constant |
| l | Median particle size |
| P(C) | Probability that a triggering ion has reached the site within the period 1/C |
| q A, qB | Charges of ions A and B, respectively |
| Q(C) | Absolute specific capacity at a given C-rate |
| Q rel(C) | Relative specific capacity at a given C-rate |
| Q theoretical | Theoretical specific capacity |
| r A, rB | Covalent radii of atoms A and B, respectively |
| R A–X | Bond distance between cation A and anion X |
| R 0,A–X | Bond distance between cation A and anion X that corresponds to a bond valence of sA–X = 1 valence unit. |
| s A–X | Bond valence of the interaction between cation A and anion X |
| T | Temperature |
| |ΔV| | Bond valence sum mismatch |
| W | Characteristic relaxation frequency of stretched exponential curve, i.e. characteristic C rate where the capacity drops to 1/e of its value at (infinitely) low discharge rate. |
| W act | Characteristic relaxation frequency of charge transfer process at the electrode surface |
| w | Characteristic relaxation time = 1/W |
| α | Fraction of theoretical capacity that practically remains inaccessible at low C rates |
| β | Stretching exponent |
| β act | Stretching exponent related to the charge transfer process at the electrode surface |
| γ | Pathway dimensionality-dependent pathway tortuosity exponent |
Acknowledgements
This research was supported by the National Research Foundation, Prime Minister's Office, Singapore under its Competitive Research Programme (CRP Awards NRF-CRP 10-2012-6 and NRF-CRP 8-2011-4). Scholarships to L. L. Wong (jointly funded by NUS and Johnson Matthey PLC) as well as to H. M. Chen (funded by the National Research Foundation, Prime Minister's Office, Singapore) are gratefully acknowledged.References
- A. A. Yaroshevsky, Geochem. Int., 2005, 44, 48–55 CrossRef.
- R. Berthelot, D. Carlier and C. Delmas, Nat. Mater., 2011, 10, 74–80 CrossRef CAS PubMed.
- B. Xu, D. Qian, Z. Wang and Y. S. Meng, Mater. Sci. Eng., R, 2012, 73, 51–65 CrossRef CAS.
- M. M. Kalantarian, S. Asgari and P. Mustarelli, J. Mater. Chem. A, 2014, 2, 107–115 CAS.
- W. Peukert, Elektrotech. Z., 1897, 20, 287–288 Search PubMed.
- D. Doerffel and S. Abu Sharkh, J. Power Sources, 2006, 155, 395–400 CrossRef CAS.
- A. Hausmann and C. Depcik, J. Power Sources, 2013, 235, 148–158 CrossRef CAS.
- W. Dieterich and P. Maass, Chem. Phys., 2002, 284, 439–467 CrossRef CAS.
- J. Y. Fu, Philos. Mag., 2014, 94, 1788–1815 CrossRef CAS.
- S. Adams and R. Prasada Rao, Understanding Ionic Conduction and Energy Storage Materials with Bond-Valence-Based Methods, in Bond Valences, Structure and Bonding, ed. I. D. Brown and K. R. Poeppelmeier, Springer Berlin Heidelberg, 2014, vol. 158, pp. 129–159 DOI:10.1007/430_2013_137.
- S. Adams, J. Solid State Electrochem., 2010, 14, 1787–1792 CrossRef CAS.
- S. Adams and R. Prasada Rao, J. Mater. Chem., 2012, 22, 7687–7691 RSC.
- S. Adams and R. Prasada Rao, J. Mater. Chem., 2012, 22, 1426–1434 RSC.
- S. Adams and R. Prasada Rao, Phys. Chem. Chem. Phys., 2009, 11, 3210–3216 RSC.
- S. Adams, Practical Considerations in Determining Bond Valence Parameters, in Bond Valences, Structure and Bonding, ed. I. D. Brown and K. R. Poeppelmeier, Springer Berlin Heidelberg, 2014, vol. 158, pp. 91–128 DOI:10.1007/430_2013_96.
- S. Adams and R. Prasada Rao, Solid State Ionics, 2011, 184, 57–61 CrossRef CAS.
- M. J. S. Dewar, E. F. Healy and J. J. P. Stewart, J. Chem. Soc., Faraday Trans. 2, 1984, 80, 227–233 RSC.
- S. Adams and R. Prasada Rao, Phys. Status Solidi A, 2011, 208, 1746–1753 CrossRef CAS.
- J. D. Gale, J. Chem. Soc., Faraday Trans., 1997, 93, 629–637 RSC.
- Materials Studio 6.0, Accelrys Inc., San Diego, CA 92121-3752, 2012 Search PubMed.
- L. L. Wong, H. Chen and S. Adams, Phys. Chem. Chem. Phys., 2015, 17, 9186–9193 RSC.
- P. Barpanda, G. Oyama, S. Nishimura, S. C. Chung and A. Yamada, Nat. Commun., 2014, 5, 4358 CAS.
- J. Kim, I. Park, H. Kim, K.-Y. Park, Y.-U. Park and K. Kang, Adv. Energy Mater., 2016, 6, 1502147 CrossRef.
- P. Singh, K. Shiva, H. Celio and J. B. Goodenough, Energy Environ. Sci., 2015, 8, 3000–3005 CAS.
- Y. Meng, T. Yu, S. Zhang and C. Deng, J. Mater. Chem. A, 2016, 4, 1624–1631 CAS.
- G. Li, D. Jiang, H. Wang, X. Lan, H. Zhong and Y. Jiang, J. Power Sources, 2014, 265, 325–334 CrossRef CAS.
- C.-Y. Chen, K. Matsumoto, T. Nohira and R. Hagiwara, J. Electrochem. Soc., 2015, 162, A176–A180 CrossRef CAS.
- G. Longoni, J. E. Wang, Y. H. Jung, D. K. Kim, C. M. Mari and R. Ruffo, J. Power Sources, 2016, 302, 61–69 CrossRef CAS.
- H. Kim, G. Yoon, I. Park, K.-Y. Park, B. Lee, J. Kim, Y.-U. Park, S.-K. Jung, H.-D. Lim, D. Ahn, S. Lee and K. Kang, Energy Environ. Sci., 2015, 8, 3325–3335 CAS.
- H. Kim, I. Park, D.-H. Seo, S. Lee, S.-W. Kim, W. J. Kwon, Y.-U. Park, C. S. Kim, S. Jeon and K. Kang, J. Am. Chem. Soc., 2012, 134, 10369–10372 CrossRef CAS PubMed.
- H. Kim, I. Park, S. Lee, H. Kim, K.-Y. Park, Y. Park, H. Kim, J. Kim, H.-D. Lim, W.-S. Yoon and K. Kang, Chem. Mater., 2013, 25, 3614–3622 CrossRef CAS.
- S. Zhang, C. Deng and Y. Meng, J. Mater. Chem. A, 2014, 2, 20538–20544 CAS.
- P. Barpanda, G. Liu, M. Avdeev and A. Yamada, ChemElectroChem, 2014, 1, 1488–1491 CrossRef CAS.
- Y. Kee, N. Dimov, A. Staikov, P. Barpanda, Y.-C. Lu, K. Minami and S. Okada, RSC Adv., 2015, 5, 64991–64996 RSC.
- C. S. Park, H. Kim, R. A. Shakoor, E. Yang, S. Y. Lim, R. Kahraman, Y. Jung and J. W. Choi, J. Am. Chem. Soc., 2013, 135, 2787–2792 CrossRef CAS PubMed.
- H. Kim, C. S. Park, J. W. Choi and Y. Jung, Angew. Chem., Int. Ed., 2016, 55, 6662–6666 CrossRef CAS PubMed.
- P. P. Prosini, C. Cento, A. Masci and M. Carewska, Solid State Ionics, 2014, 263, 1–8 CrossRef CAS.
- Y. Zhu, Y. Xu, Y. Liu, C. Luo and C. Wang, Nanoscale, 2013, 5, 780–787 RSC.
- Y.-L. Ruan, K. Wang, S.-D. Song, X. Han and B.-W. Cheng, Electrochim. Acta, 2015, 160, 330–336 CrossRef CAS.
- Y.-U. Park, D.-H. Seo, H.-S. Kwon, B. Kim, J. Kim, H. Kim, I. Kim, H.-I. Yoo and K. Kang, J. Am. Chem. Soc., 2013, 135, 13870–13878 CrossRef CAS PubMed.
- L. Wang, J. Song, R. Qiao, L. A. Wray, M. A. Hossain, Y.-D. Chuang, W. Yang, Y. Lu, D. Evans, J.-J. Lee, S. Vail, X. Zhao, M. Nishijima, S. Kakimoto and J. B. Goodenough, J. Am. Chem. Soc., 2015, 137, 2658–2664 CrossRef PubMed.
- H. Chen, Q. Hao, O. Zivkovic, G. Hautier, L.-S. Du, Y. Tang, Y.-Y. Hu, X. Ma, C. P. Grey and G. Ceder, Chem. Mater., 2013, 25, 2777–2786 CrossRef CAS.
- S. Xu, Y. Wang, L. Ben, Y. Lyu, N. Song, Z. Yang, Y. Li, L. Mu, H.-T. Yang, L. Gu, Y.-S. Hu, H. Li, Z.-H. Cheng, L. Chen and X. Huang, Adv. Energy Mater., 2015, 5, 1501156 CrossRef.
- M. Jayakumar, K. Hemalatha, K. Ramesha and A. S. Prakash, Phys. Chem. Chem. Phys., 2015, 17, 20733–20740 RSC.
- Y. Kawabe, N. Yabuuchi, M. Kajiyama, N. Fukuhara, T. Inamasu, R. Okuyama, I. Nakai and S. Komaba, Electrochem. Commun., 2011, 13, 1225–1228 CrossRef CAS.
- M. Xu, L. Wang, X. Zhao, J. Song, H. Xie, Y. Lua and J. B. Goodenough, Phys. Chem. Chem. Phys., 2013, 15, 13032–13037 RSC.
- K. H. Ha, S. H. Woo, D. Mok, N.-S. Choi, Y. Park, S. M. Oh, Y. Kim, J. Kim, J. Lee, L. F. Nazar and K. T. Lee, Adv. Energy Mater., 2013, 3, 770–776 CrossRef CAS.
- R. Kohlrausch, Ann. Phys., 1854, 167, 56–82 CrossRef; R. Kohlrausch, Ann. Phys., 1854, 167, 179–214 CrossRef.
- G. Williams and D. C. Watts, Trans. Faraday Soc., 1970, 66, 80–85 RSC.
- S. H. Glarum, J. Chem. Phys., 1960, 33, 369 Search PubMed.
- P. Bordewijk, Chem. Phys. Lett., 1975, 32, 592 CrossRef CAS.
- S. R. Elliott and A. P. Owens, Philos. Mag. B, 1989, 60, 777–792 CAS.
- J. Klafter and M. F. Shlesinger, Proc. Natl. Acad. Sci. U. S. A., 1986, 83, 848 CrossRef CAS.
- K. L. Ngai, Comments Solid State Phys., 1979, 9, 127 CAS; K. L. Ngai, Comments Solid State Phys., 1979, 9, 141 Search PubMed; K. L. Ngai and R. W. Rendell, J. Non-Cryst. Solids, 1990, 131, 233 Search PubMed.
- (a) K. Funke, B. Roling and M. Lange, Solid State Ionics, 1998, 105, 195–208 CrossRef CAS; (b) K. Funke, R. D. Banhatti and C. Cramer, Phys. Chem. Chem. Phys., 2005, 7, 157–165 RSC.
- S. Guo, H. Yu, D. Liu, W. Tian, X. Liu, N. Hanada, M. Ishida and H. Zhou, Chem. Commun., 2014, 50, 7998–8001 RSC.
- X. Jiang, S. Liu, H. Xu, L. Chen, J. Yang and Y. Qian, Chem. Commun., 2015, 51, 8480–8483 RSC.
- G. Oyama, S.-i. Nishimura, Y. Suzuki, M. Okubo and A. Yamada, ChemElectroChem, 2015, 2, 1019–1023 CrossRef CAS.
- T. Shiratsuchi, S. Okada, J. Yamaki and T. Nishida, J. Power Sources, 2006, 159, 268–271 CrossRef CAS.
- T. Balic Zunic, A. Garavelli, P. Acquafredda, E. Leonardsen and S. P. Jakobsson, Mineral. Mag., 2009, 73, 51–57 CrossRef CAS.
- T. Honma, T. Togashi, N. Ito and T. Komatsu, J. Ceram. Soc. Jpn., 2012, 120, 344–346 CrossRef CAS.
- H. Kim, R. A. Shakoor, C. Park, S. Y. Lim, J. S. Kim, Y. N. Jo, W. Cho, K. Miyasaka, R. Kahraman, Y. Jung and J. W. Choi, Adv. Funct. Mater., 2013, 23, 1147–1155 CrossRef CAS.
- P. Barpanda, G. Liu, C. D. Ling, M. Tamaru, M. Avdeev, S. Chung, Y. Yamada and A. Yamada, Chem. Mater., 2013, 25, 3480–3487 CrossRef CAS.
- J. M. Clark, P. Barpanda, A. Yamada and M. Islam, J. Mater. Chem. A, 2014, 2, 11807–11812 CAS.
- P. Barpanda, T. Ye, S. Nishimura, S. Chung, Y. Yamada, M. Okubo, H. Zhou and A. Yamada, Electrochem. Commun., 2012, 24, 116–119 CrossRef CAS.
- J. Angenault, J. C. Couturier, M. Quarton and F. Robert, Eur. J. Solid State Inorg. Chem., 1995, 32, 335–343 CAS.
- S. M. Wood, C. Eames, E. Kendrick and M. S. Islam, J. Phys. Chem. C, 2015, 119, 15935–15941 CAS.
- D. Kundu, R. Tripathi, G. Popov, W. R. M. Makahnouk and L. F. Nazar, Chem. Mater., 2015, 27, 885–891 CrossRef CAS.
- C. Wang, M. Sawicki, J. A. Kaduk and L. L. Shaw, J. Electrochem. Soc., 2015, 162, A1601–A1609 CrossRef CAS.
- S. Adams, Appl. Energy, 2012, 90, 323–328 CrossRef CAS.
- R. P. Rao, M. V. Reddy, S. Adams and B. V. R. Chowdari, Mater. Res. Bull., 2015, 66, 71–75 CrossRef CAS.
- V. Palomares, M. Casas-Cabanas, E. Castillo-Martínez, M. H. Han and T. Rojo, Energy Environ. Sci., 2013, 6, 2312–2337 CAS.
- R. Prasada Rao, M. H. Chen and S. Adams, J. Solid State Electrochem., 2012, 16, 3349–3354 CrossRef.
- Z. Jian, C. Yuan, W. Han, X. Lu, L. Gu, X. Xi, Y.-S. Hu, H. Li, W. Chen, D. Chen, Y. Ikuhara and L. Chen, Adv. Funct. Mater., 2014, 24, 4265–4272 CrossRef CAS.
- S. Y. Lim, H. Kim, R. A. Shakoor, Y. Jung and J. W. Choi, J. Electrochem. Soc., 2012, 159, A1393–A1397 CrossRef CAS.
- Z. Jian, Y. Sun and X. Ji, Chem. Commun., 2015, 51, 6381–6383 RSC.
- Z. L. Jian, L. Zhao, H. L. Pan, Y. S. Hu, H. Li, W. Chen and L. Q. Chen, Electrochem. Commun., 2012, 14, 86–89 CrossRef CAS.
- K. M. Bui, V. A. Dinh, S. Okada and T. Ohno, Phys. Chem. Chem. Phys., 2015, 17, 30433–30439 RSC.
- J. P. Boilot, G. Collin and Ph. Colomban, Mater. Res. Bull., 1987, 22, 669–676 CrossRef CAS.
- J. Gopalakrishnan and K. K. Rangan, Chem. Mater., 1992, 4, 745–747 CrossRef CAS.
- W. Song, X. Cao, Z. Wu, J. Chen, K. Huangfu, X. Wang, Y. Huang and X. Ji, Phys. Chem. Chem. Phys., 2014, 16, 17681–17687 RSC.
- H. Li, X. Yu, Y. Bai, F. Wu, C. Wu, L. Y. Liu and X.-Q. Yang, J. Mater. Chem. A, 2015, 3, 9578–9586 CAS.
- A. D. Robertson, A. R. West and A. G. Ritchie, Solid State Ionics, 1997, 104, 1–11 CrossRef CAS.
- R. A. Shakoor, D. H. Seo, H. Kim, Y. U. Park, J. Kim, S. W. Kim, H. Gwon, S. Lee and K. Kang, J. Mater. Chem., 2012, 22, 20535–20541 RSC.
- M. Bianchini, N. Brisset, F. Fauth, F. Weill, E. Elkaim, E. Suard, C. Masquelier and L. Croguennec, Chem. Mater., 2014, 26, 4238–4247 CrossRef CAS.
- I. L. Matts, S. Dacek, T. K. Pietrzak, R. Malik and G. Ceder, Chem. Mater., 2015, 27, 6008–6015 CrossRef CAS.
- W. Song, X. Cao, Z. Wu, J. Chen, Y. Zhu, H. Hou, Q. Lan and X. Ji, Langmuir, 2014, 30, 12438–12446 CrossRef CAS PubMed.
- Y. Qi, L. Mu, J. Zhao, Y.-S. Hu, H. Liu and S. Dai, Angew. Chem., Int. Ed., 2015, 54, 9911–9916 CrossRef CAS PubMed.
- H. Jin, J. Dong, E. Uchaker, Q. Zhang, X. Zhou, S. Hou, J. Li and G. Cao, J. Mater. Chem. A, 2015, 3, 17563–17568 CAS.
- M. Xu, P. Xiao, S. Stauffer, J. Song, G. Henkelman and J. B. Goodenough, Chem. Mater., 2014, 26, 3089–3097 CrossRef CAS.
- P. Serras, V. Palomares, P. Kubiak, L. Lezama and T. Rojo, Electrochem. Commun., 2013, 34, 344–347 CrossRef CAS.
- R. Malik, D. Burch, M. Bazant and G. Ceder, Nano Lett., 2010, 10, 4123–4127 CrossRef CAS PubMed.
Footnote |
| † Electronic supplementary information (ESI) available. See DOI: 10.1039/c7cp00037e |
| This journal is © the Owner Societies 2017 |