 Open Access Article
Creative Commons Attribution 3.0 Unported Licence
Electrode potential dependent desolvation and resolvation of germanium(100) in contact with aqueous perchlorate electrolytes
Fang
Niu
a,
Rainer
Schulz
b,
Arcesio
Castañeda Medina
b,
Rochus
Schmid
b and
Andreas
Erbe
 *ac
*ac
aMax-Planck-Institut für Eisenforschung GmbH, Max-Planck-Str. 1, 40237 Düsseldorf, Germany. E-mail: a.erbe@mpie.de; aerbe@arcor.de; Fax: +49 211 6792218; Tel: +49 211 6792890
bComputational Materials Chemistry Group, Lehrstuhl Anorganische Chemie 2, Ruhr-Universität Bochum, Universitätsstr. 150, 44801 Bochum, Germany
cDepartment of Materials Science and Engineering, NTNU, Norwegian University of Science and Technology, 7491 Trondheim, Norway
First published on 10th May 2017
Abstract
The electrode potential dependence of the hydration layer on an n-Ge(100) surface was studied by a combination of in situ and operando electrochemical attenuated total reflection infrared (ATR-IR) spectroscopy and real space density functional theory (DFT) calculations. Constant-potential DFT calculations were coupled to a modified generalised Poisson–Boltzmann ion distribution model and applied within an ab initio molecular dynamics (AIMD) scheme. As a result, potential-dependent vibrational spectra of surface species and surface water were obtained, both experimentally and by simulations. The experimental spectra show increasing absorbance from the Ge–H stretching modes at negative potentials, which is associated with an increased negative difference absorbance of water-related OH modes. When the termination transition of germanium from OH to H termination occurs, the surface switches from hydrophilic to hydrophobic. This transition is fully reversible. During the switching, the interface water molecules are displaced from the surface forming a “hydrophobic gap”. The gap thickness was experimentally estimated by a continuum electrodynamic model to be ≈2 Å. The calculations showed a shift in the centre of mass of the interface water by ≈0.9 Å due to the surface transformation. The resulting IR spectra of the interfacial water in contact with the hydrophobic Ge–H show an increased absorbance of free OH groups, and a decreased absorbance of strongly hydrogen bound water. Consequently, the surface transformation to a Ge–H terminated surface leads to a surface which is weakening the H-bond network of the interfacial water in contact.
1 Introduction
Structural changes of the hydration layer of surfaces formed in aqueous solutions are essential to many chemical, physical and biological phenomena.1–4 Numerous spectroscopic, microscopic and theoretical studies have characterized interfacial water structure and dynamics.5–10 Attenuated total reflection infrared (ATR-IR) spectroscopy is a powerful tool to investigate the hydration shells, via their vibrational modes.11–13Water can form different types of hydrogen bond networks depending on the physical and chemical conditions of the environment. Water molecules have four hydrogen bonds with their nearest neighbours, thus forming a tetrahedral arrangement.14 This is usually found in crystalline ice structures around the freezing point.15–18 This crystalline ice structure has a characteristic vibrational peak at 3220 cm−1 in IR spectra.19,20 Above the freezing temperature, the liquid phase is the most thermodynamically stable structure, where the water molecule has two to three hydrogen bonds with other water molecules,21 and gives a broad infrared absorbance peak around 3400 cm−1.19,20 When a hydroxyl group in a water molecule is not donating a hydrogen bond, the IR absorption is blue-shifted to 3640 cm−1. These OH groups are often called “free OH” or “dangling OH”.22,23 The peak position of the OH vibrational peak is highly sensitive to the overall degree of hydrogen bonding.24 Moreover, there are numerous reports of surfaces with red-shifted water absorptions indicating a higher degree of hydrogen bonding and possibly a more structured water interface at room temperature.25–29 Such highly hydrogen bonded structures show a characteristic peak around 3220 cm−1. Therefore, is often referred to as “ice-like” water.25–29 This term is, however, slightly misleading, as the observed vibrational frequencies are characteristic for strongly hydrogen bound water, independent of its state of aggregation and mobility.
An early assumption was that the interfacial structure of water at a “flat repelling” hydrophobic surface should be similar to that of water at the water/air interface.30 Theoretical studies on interfacial water structure at hydrophobic interfaces exist,31–34 however, in most cases lack experimental validation at the molecular level. In general, ab initio calculations yield detailed insight, but need experimental validation due to the approximations made, and the limited size- and time-scales of the simulations. One open question is whether a layer of water depletion exists between water and the hydrophobic substrate.30,35–37 Neutron reflection measurements showed the presence of a layer of reduced water density at a hydrophobic silane/water interface, that depends on the dissolved gas in the water.38–40 Removal of the dissolved gas decreased the width of the layer. Observation of depletion of electron density in a range of 1–6 Å near hydrophobic surface by X-ray reflectivity studies also suggested the presence of a corresponding water depletion layer.40–43 The term “hydrophobic gap” will be used to refer to the depletion layer. Alternative interpretations centre around the presence of nanosized gas bubbles at the interface.44–48 Detailed interpretation on whether or not there is a lateral structuring of the interfacial region shall not be topic of this work.
The interface of germanium with an aqueous electrolyte is particularly well suited to study solvation an desolvation of interfaces, because of its potential-dependent, reversible transition to a hydrogen terminated surface at cathodic polarisation. The resulting surface is hydrophobic.49 The transition has been characterised electrochemically,49 using ATR-IR spectroscopy and quartz-crystal microbalance.50–53 In the past, electrochemically interfaced ellipsometry has been used to show the presence of a layer resembling hydrogen after cathodic polarisation of gold electrodes covered with organic molecules.54,55 Here, we present a study using electrochemical ATR-IR spectroscopy, complemented by simulations, to obtain vibrational spectra of water under different electrode potentials and draw conclusions about the state of the interfacial water at the solid/liquid interface.
Density functional theory (DFT) calculations of solvated model clusters resembling the Ge(100)/solution interface have been successfully used to assign characteristic vibrational modes of intermediate species detected during the electrochemical oxygen reduction reaction.56 For Germanium nanocrystals, a microscopic lattice dynamical mode was developed to study phonon modes.57 In the present study, the theoretical focus is on obtaining the full vibrational spectra through ab initio molecular dynamics (AIMD) simulations of the Ge(100) surfaces under realistic electrochemical conditions, i.e., taking into account (i) the potential imposed on the surface and (ii) the interaction with the electrolyte. Several approaches exist to deal with the electrified interface.58 Within DFT periodic boundary calculations, one of the most common model is the so-called “constant-charge” approach, where the potential is included indirectly by energy shifts associated to the electron transfer processes. Formally, however, the electrochemical conditions require instead a grand potential description, at least, for the electronic subsystem.59 Thus, assuming the Fermi level is determined by the electrochemical potential, the exchange of electrons between the system and the reference (electrode) is correctly described. Within the Born–Oppenheimer approach to AIMD, this entails to optimize the electronic structure for a given chemical potential. However, such type of calculations are more expensive than the traditional constant-charge approaches, due the high fluctuations in the electron density, and as such they are not of widespread use yet. The hydration/solvation effects, on the other hand, require a huge quantity of solvent and solute molecules to obtain meaningful thermodynamic results. For water this can be even more problematic than for other type of solvents. In practice, such a system size is computationally prohibitive and most of the DFT calculations involve just a small number of molecules of water and/or continuum solvation models.60
Here, both problems are tackled within the Car–Parinello MD (CPMD) scheme,61 using an electronic grand-potential real space (RS) DFT to solve the electronic structure problem, and a joint explicit-water/implicit continuum model of the electrolyte to describe the hydration effects. Details of the computational methods will be described elsewhere. Apart from its high scalability, the RS-DFT allows to deal with systems of arbitrary periodicity, in particular 2D-periodic (slabs): spurious long-range interactions along the non-periodic direction are avoided because there are no image replicas in such direction. Furthermore, 2D-periodic charged systems can be dealt with by a proper setup of the boundary conditions. The main aim of this paper is to show that this approach directly yields experimentally measurable quantities, and to compare simulation and experimental results.
2 Materials and methods
2.1 Experiments
The experimental setup combining electrochemical and spectroscopic experiments has been described in detail previously.56,62 Briefly, a standard ATR-IR setup was modified to permit use of trapezoidal Sb-doped n-type Ge(100) internal reflection elements (Crystal GmbH, Berlin, Germany) of size 52 mm × 20 mm × 2 mm, with an angle of incidence of 60° at the Ge/electrolyte interface. A custom-built PTFE basin placed on the crystal via an O-ring enclosed the electrolyte. The Ge surface inside the O-ring has contact with the elctrolyte. The effective electrode area is 4 cm2. The cell was covered by a Teflon lid that included the gas inlet and outlet and bores for the reference (double junction Ag/AgCl/3 M KCl microreference electrode) and counter (Pt foil, 99.99%, 1.2 cm × 1 cm) electrodes. All the potentials reported in this work are with reference to the standard hydrogen electrode (SHE). 0.1 M HClO4 was used as electrolyte, with a measured pH of 1.4. All the experiments were conducted under Ar atmosphere, by purging the solution with gas prior to the experiment, and purging the cell continuously above the electrolyte during the experiment. All experiments were carried out at ambient temperature of (23 ± 2) °C.The germanium elements were cleaned by immersing them in neutral Extran lab detergent (VWR) for 3 h, followed by 3× rinsing with ultrapure water, and a final rinse with isopropanol. Subsequently, the elements were again rinsed with ultrapure water for 3 times, and dried with a N2 stream before the experiment.
ATR-IR spectra were recorded on a Vertex 70v Fourier transform IR spectrometer (Bruker, Germany) using a mercury cadmium telluride (MCT) detector. Spectra were recorded in p-polarization, averaging 400 scans for each spectrum. Spectra are displayed as difference absorbance  , were Is and I0 represent the sample and reference spectrum intensity, respectively. The sample spectrum Is was measured in a range of electrode potentials from 0.21 V to −0.79 V in steps of 0.1 V, first in direction of decreasing potential, and then in direction of increasing potential. Each corresponding reference spectrum I0 was measured at a fixed potential of 0.21 V, immediately after the collection of the sample spectrum at every potential. Water vapour contributions were subtracted manually from all spectra. An Iviumstat potentiostat (Ivium, Eindhoven, The Netherlands) with a simultaneous recording of currents in chronoamperometry mode was used for electrode potential control.
2.2 DFT calculations
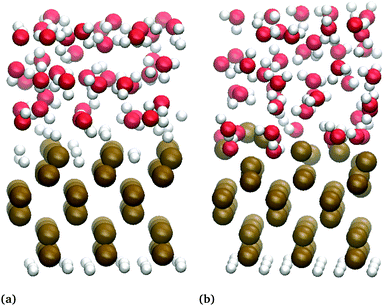
All AIMD simulations have been done using the RSDFT software package, a code to perform CPMD using an RS approach to DFT.23,63 The time scales involved in the transformation from the –OH to the –H termination are clearly prohibitive for realistic AIMD simulations. Therefore, both types surfaces were sampled under the experimental used potentials. Fig. 1 shows snapshots of the slabs used for the numerical simulations of the biased-hydrated Ge(100) electrodes. Six square (3 × 3) monolayers were disposed in orthorhombic supercells, periodic in the x, y directions, with vacuum regions in the non-periodic z-direction. The slab's bottoms were saturated by hydrogen atoms, which, together the four bottom monolayers of Ge, were fixed during the calculations. The tops were terminated with hydroxyl groups (Ge–OH), or hydrogen atoms (Ge–H). Two bilayers of “explicit” water (40 molecules), supporting the electrolyte continuum model, were added. Thus, the full system was partitioned into two coupled subsystems: (i) the explicit hydrated/biased slab, quantum-mechanically described by an extended CPMD approach, and (ii) the implicit electrolyte double layer described at the continuum level also within an extended CPMD approach. A detailed description will be published elsewhere in a dedicated method paper. The former allows to the deal with the open electronic subsystem (electrode) and was central to perform calculations at constant electrochemical potential by using a grand-potential DFT approach. The continuum description of the electric double layer, on the other hand, takes into account the non-constant dielectric effects, by the generalized Poisson equation, as well the ionic species in the electrolyte by a modified Poisson–Boltzmann functional.64,65 The electrolyte itself was “open”, in the sense it counterbalanced the charge of the electrode such that the full system was neutral, and takes into account saturation effects of the densities at the charged solid/liquid interface.In all of the calculations, the wavefunctions and both electronic and ionic densities were discretised in a homogeneous mesh of 0.3 Bohr of spacing, which corresponds to an energy cutoff of 54.8 Hartree, if a planewave point of view is adopted. The Brillouin zone is sampled just at the Γ point, which is justified by the lateral (periodic) sizes of the supercells and the semiconducting character of the “bare” slab. Norm-conserving pseudopotentials,66 in their fully non-local form,67 were used to describe the nuclei-electron interaction for all of the chemical species. The egg-box problem inherent to any RS computation with pseudopotentials was alleviated by efficient Fourier filtering techniques.68 The exchange–correlation interactions were taken into account via the RPBE functional,69 including van der Waals interactions through the DTF-D3 atom-pairwise potentials.70 The electron–electron interaction (Hartree term), as well as the Coulomb terms associated with ionic species in the electrolyte, were computed by solving the generalized Poisson problem with a varying static dielectric permittivity ε and Dirichlet (Neumann) BC at the top (bottom) of the supercell. The permittivity was a function of the water-density and changes smoothly from 1 inside the explicitly hydrated slab, to a value of 78 in the electrolyte bulk. For those calculations, the supercell size was increased by 60 Bohr in the +z direction. The dipole moment of water was set to 4.79 D.71 For the finite size effect, the effective radius of hydronium was taken into account as 1.0 Å,72 and the effective radius of the perchlorate as 3.09 Å.73,74 The ionic bulk concentration of anions and cations were set to 0.1 mol L−1 and that of water to 55.4 mol L−1.
In the first step of the numerical simulations, the explicitly hydrated slabs were optimized in vacuum (ε = 1) by second-order damped dynamics until the energy changes were below 10−4 Hartree.63 Then, the implicit electrolyte model was added, and optimization was carried out under chemical potentials references to SHE as75 −μ = ESHE + 4.44 V. The charges gained or lost by the hydrated slab were determined by the changes in the electronic occupations. With those values, constant-charge microcanonical simulations of few thousand timesteps (δt = 5 a.u.) were done to equilibrate the full system. Subsequently, simulations at the canonical ensemble were performed by a second-generation thermostat during 105 timesteps.76 From the atomic trajectories, vibrational power spectra were computed, and using Hirschfeld-type dipole moments,77 the corresponding infrared spectra were extracted.
3 Results and discussions
3.1 In situ infrared spectroscopic investigations
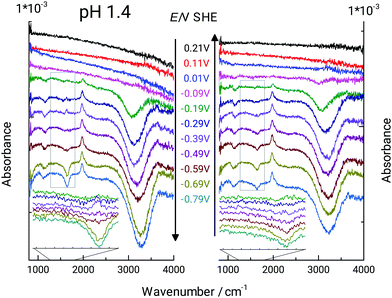
In acidic electrolyte (pH ≈ 1), the germanium surface transition to an H-terminated surface is observed when the electrode potential is below ≈−0.2 V.49,50,52 Typical cyclic voltammograms (CVs) on Ge(100) closely resemble previously published CVs.52,53,78 An anodic peak at +0.1 V is attributed to the formation of a surface oxide layer.49,51,52 At −0.3 V, a cathodic current peak was attributed to the change in surface termination from Ge–OH to Ge–H. The pH dependence of the occurrence of the Ge–H was further investigated by ATR-IR spectroscopy.Fig. 2 shows a series of ATR-IR spectra with potential control on Ge(100). The Ge–H termination gives a Ge–H stretching mode absorption at 1960 cm−1,49,50,53 with increasing absorbance at decreasing potential. The absorption at 1115 cm−1 originates from the antisymmetric Cl–O stretching mode of ClO4− in solution.56,79–81 Its appearance indicates changes in the number of ions near the interface. The appearance of OH2 bending (centred at 1640 cm−1) and stretching (centred at 3250 cm−1) modes can be interpreted as related to changes in the hydrogen-bonding pattern at the interface, changes in orientation, or change of the number of molecules near the interface.13,82 Positive peaks indicate an increase in absorbance compared to the state of the surface at the reference potential of 0.21 V, while negative peaks indicate a decrease in absorbance compared to the reference potential.
Fig. 3 indicates the peak height and peak position as function of electrode potential of the OH stretching and bending modes. Increase in negative difference absorbance of water bending and stretching modes in negative stepping direction was observed simultaneously with the rise in absorbance of the Ge–H peak. Intuitively, this observation can be explained by the repelling effect of the hydrophobic Ge–H terminated surface. Repulsion of electrolyte from the surface was furthermore confirmed by the increase in negative difference absorbance of the antisymmetric ClO4− stretching peak. Consequently, not only water molecules are repelled from the surface, but also the solvated ClO4− ions.
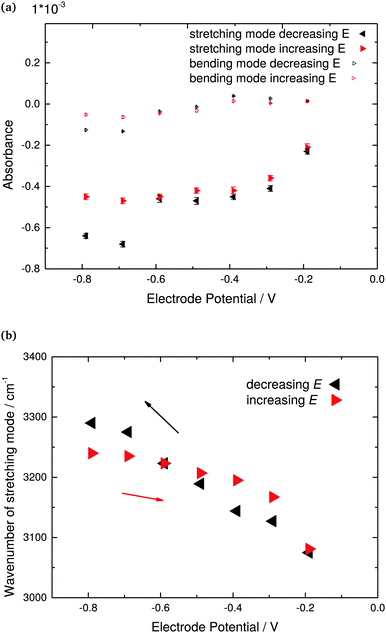 | ||
| Fig. 3 Quantitative analysis of ATR-IR spectra shown in Fig. 2 of Ge(100) in contact with Ar-saturated 0.1 M HClO4 (pH 1.4). (a) Peak difference absorbance of OH bending and stretching modes, and (b) stretching mode peak position as function of electrode potential. The quantitative analysis of the bending mode was made after fitting the region around to maximum to a Lorentzian, while the analysis of the stretching mode was made by reading directly absorbance and peak wavenumber from the extrema of the spectra after baseline correction. | ||
The negative difference absorbance in the OH stretching mode region is not only affected by depletion of water, but also by the disappearance of surface bound hydroxyl groups during the surface transformation
| Ge–OH + 2H+ + 2e− ⇌ Ge–H + H2O. | (1) |
The reversible shift to higher wavenumbers of the OH stretching mode (Fig. 2) under cathodic polarisation is likely affected by changes in the hydrogen-bonding situation at the interface, in addition to the different major contributions from Ge–OH and H2O. Such potential dependence of water vibrational modes may reveal more detailed information on the structural changes of interfacial water layers, and shall be discussed in the second part of this manuscript in combination with the AIMD simulations. The results indicate also that in the positive potential stepping direction, peak heights are not exactly the same as in the experiments in negative stepping directions. Consequently, there must be some irreversible changes of the surface, e.g. during hydrogen evolution at the lowest potentials.
The potential dependent ATR-IR spectra of water and anion modes show a complex behaviour, combining action of two contributions, namely the removal of interfacial water by termination change and the approach of the hydration shell by electrostatic force. At the same time, the hydrogen bonding structure around the surface changes, leading to peak shifts in the absorbance spectra. Qualitatively and also semiquantitatively, the negative difference absorbance for the ClO4− stretching modes is consistent with removing solvated ions away from the surface. Changes in ion solvation itself shall hence not be discussed here, as there is too little experimental evidence for such changes. Nevertheless, the interaction between ions and the electrode surface is controlled by the varying electric field near the interface.
3.2 Analysis of the “hydrophobic gap” in 0.1 M HClO4
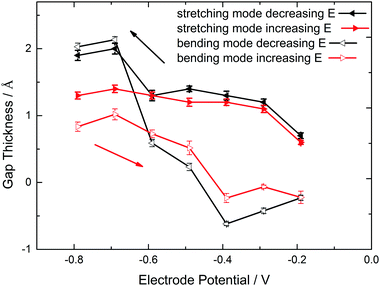
The system investigated here offers the possibility to switch on and off the hydrophobicity, without complex molecular systems in charge of the switching. Hydrophobicity of H-terminated Ge itself has been shown before by bubble contact angle analysis.49 A qualitative analysis of the ATR-IR spectra shown in Fig. 2 already shows that after completion of the surface transformation, a density-depleted region in water is observed at interface. This depletion shall be analysed quantitatively in more detail in the following.To obtain an estimate of the thickness d of the hydrophobic gap, water with bulk optical constants was assumed to be present initially at the most positive electrode potentials.83 A continuum electrodynamics based matrix method was used to calculate reflectivities of germanium in contact with water with different thickness of a layer of refractive index 1 in between water and germanium. Both the matrix method,84 as well as the calculation of absorbance spectra,85 were described previously in detail. Two different spectral regions have been analysed for estimating d, the OH stretching mode region because of the higher total absorbance and consequently higher sensitivity, and the OH2 bending mode region, because it is not affected by the presence of Ge–OH. The difference absorbance between d = 0 and a certain non-zero gap thickness was then calculated, and compared to experimental data in the range of the OH stretching and bending region. A calibration curve was generated on the basis of (i) the experimental extremal absorbance of the OH stretching mode around 3400 cm−1, and (ii) the extremal absorbance of the OH2 bending mode around 1640 cm−1, respectively. While in the case of the stretching mode, the extremal absorbance value was directly read from the graph, the region around the peak in the bending mode region was fit to a Lorentzian curve first, and the maximum of the Lorentzian fit was used. Both absorbance values are displayed in Fig. 3a.
The resulting d values for both scenarios are summarized in Fig. 4. A reasonable gap thickness can only be obtained at potentials negative of the surface transformation onset, which in this case means lower than −0.19 V. The largest gaps appear at very negative potentials. As result of the OH stretching mode analysis, the maximum thickness is (1.9 ± 0.1) Å, larger than the reported Ge–H bond length of 1.59 Å.86 Analysis of the bending mode leads to a maximum gap thickness of (2.0 ± 0.1) Å.
It is clear that the analysis presented in the previous paragraph is stretching the limits of continuum electrodynamics. Differences in water absorption spectra are certainly present, and are actually interesting to analyse. For this purpose, the difference absorbance spectra calculated with the specific d as given in Fig. 4 were subtracted from the measured spectra. Subtraction was done both using d derived by analysing the stretching mode absorbance (Fig. 5a), as well as the bending mode absorbance (Fig. 5b). In Fig. 5b, the bending mode is typically quite well compensated, which implies that there is no strong shift in wavenumber. A shift in peak wavenumber depending on the hydrogen bonding situation is possible, but the shifts are not as pronounced as in the stretching mode region.13,87,88 As the bending mode does not shift significantly in wavenumber with potential, and is typically well compensated in Fig. 5b, the following discussion shall focus on the stretching mode region of the spectra in Fig. 5b. The region 3200–3700 cm−1 is split into two smaller distinct positive bands, and one negative band. The positive band centring at 3440 cm−1 may correspond to the stretching modes of water molecules similar to standard bulk hydrogen bonding state. There is qualitative agreement between the spectra obtained with the two different analysis approaches used in this work. Some MD simulations,89 Monte Carlo simulations,90 and some experimental sum frequency generation spectroscopy-based results91,92 point to the preferred presence trend of “ice-like” water near hydrophobic interfaces. In these cases, the nearby water molecules are oriented in a specific OH-down-structure that one hydrogen atom directs at the solid surface. Following a standard literature interpretation, the peak negative peak centred at 3060 cm−1 could be assigned to highly structured water, also widely referred to as “ice-like”.25–29 As the difference absorbance is negative at these low potentials, IR spectra for the specific system investigated here point to a decrease in the presence of strongly H-bound “ice-like” water. It must be kept in mind that a large portion of this peak is due to the disappearance of the Ge–OH surface groups. However, with disappearance of Ge–OH, the H2O molecules bound to it will change their spectral signature, which then generates the overall shape of the peak. Peak shape does also change with potential, though the Ge–H absorbance is almost constant, indicating that changes are ongoing, especially also during the onset of hydrogen evolution.
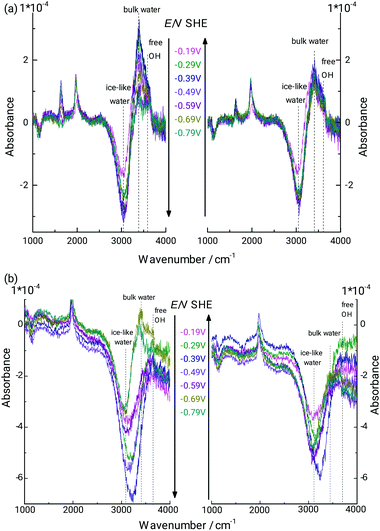 | ||
| Fig. 5 ATR-IR difference absorbance spectra of interfacial water in 0.1 M HClO4 (pH 1.4; Fig. 2) at different potentials. Spectra were obtained from subtraction of calculated spectra with bulk optical constants of water, separated from the germanium by a hydrophobic gap of the thickness shown in Fig. 4. Shown spectra thus represent the deviations of interfacial water from bulk water at the respective potential. (a and b) Represent the two different scenarios analysed in this work, basing the thickness analysis on the OH stretching and OH2 bending modes, respectively. | ||
The peak appearing at 3640 cm−1 under certain lower potentials (−0.59 to −0.79 V), which is also visible for certain potentials in the raw spectra in Fig. 2 is assigned to “free” OH groups, i.e. to –OH groups not participating in hydrogen bonding. Such molecules are likely those with the direction of the OH bond directly to the Ge–H surface. Similar vibrational modes have been observed elsewhere, e.g. by applying IR visible sum frequency generation (SFG) spectroscopy at interfaces involving water and a second hydrophobic phase, such as air/water,93,94 water/hexane,20 water/CCl4,91 and other hydrophobic liquids.95,96 It has been difficult to observe this mode for hydrophobic solid/water interfaces before. Besides, this mode of free OH is typically not observed at interfaces by linear absorption spectroscopy, due to the large background of bulk water. Typically, the presence of free OH is observed in SFG, together with a broad band with seemingly two components often labelled as “liquid-like” and “ice-like” bands. The band positions are quite similar to the three peaks observed in Fig. 5.
It is likely that the reversible potential dependant hydrophobic gap is induced by the reversible surface transition, thus leading to the destruction and re-construction of interfacial water molecules. The two stage process observed here supports the interpretation of a mixed terminated intermediate forming initially.53 However, it is also possible that the desolvation is partially triggered by the electron accumulation at the electrode under the applied negative polarisation. As there was no discontinuity observed in the potential-dependent absorbance of the ClO4− modes, the second hypothesis appears unlikely to the authors. To clarify this question, similar studies are needed on systems that do not show a surface transformation.
3.3 Analysis of interfacial structure by DFT
The analysis of the net charge in the relaxed biased slabs (Fig. 6) shows the H-terminated surfaces are only appreciable charged after certain threshold (≈−0.3 V). This is approximately the chemical potential of the unbiased hydrated slab and therefore for this surface is energetically more favourable to give electrons to the reservoir. On the other hand, for the OH-terminated electrodes there is an always increasing net charge with the increasing of the chemical potential. Two approximately linear regimes were observed below and above μ ≈ −0.6 V, with capacitances of C ≈ 0.2 e V−1 and C ≈ 0.17 e V−1, respectively.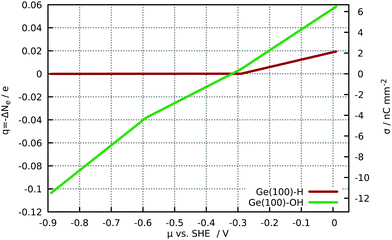 | ||
| Fig. 6 Net charge in the hydrated slabs as function of the chemical potential. The right axis shows the corresponding charge density σ. | ||
The spectral information was separated into the contributions coming from the electrode, including its molecular termination, and those coming from the explicit water layers. The vibrational data is represented on a logarithmic scale to facilitate the analysis. Fig. 7 shows the power spectra for the Ge–H surface at three of the electrode potentials used experimentally. Five main vibrational modes were identified in this spectrum: stretching, bending, rocking, wagging and distortion. These modes are roughly reproduced by the AIMD calculations compared to well-known experimental values (Table 1). For the Ge–OH system (Fig. 7), a Ge–O stretching vibration and a distortion mode are clearly visible, as well as an O⋯H–O bending mode, due to the interaction between the terminating OH and the water molecules. The Ge–O stretching mode is found at 500 cm−1, whereas the O⋯H–O bending vibration is observed as a broad and small peak around 1000 cm−1. Although for both terminations the spectra are not strongly dependent on the potential, for the larger surface charges than used here, a Stark shift was found in the Ge–H stretching mode of the Ge–H and the Ge–O stretching mode of the Ge–OH surface.
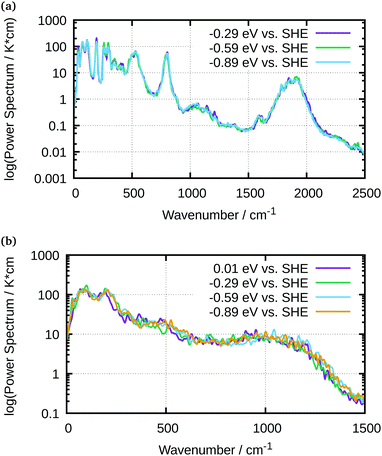 | ||
| Fig. 7 AIMD-calculated vibrational power spectra of water in contact with (a) H-terminated Ge(100) and (b) OH-terminated Ge(100) at different potentials as indicated in the graph. | ||
| Mode | Stretch | Bending | Wagging | Rocking | Ge3–GeH |
|---|---|---|---|---|---|
| Exp. | 1970 | 755 | 565 | 400 | 120 |
| Theory | 1842 | 804 | 533 | 297 | 115 |
An analysis of the simulated IR spectra allows to identify water-specific modes on both types of surfaces (Fig. 8 and 9). For the Ge–H surface, the maximum of the water stretching vibration was observed at 3440 cm−1, while it is shifted to around 3350 cm−1 for the Ge–OH surface. Consequence is the observed dispersive band shape in experimental spectra (Fig. 5), when differences between the two surfaces are considered. The free OH stretching mode can also be observed as small shoulder on the OH-terminated surface, while it is a larger peak on the H-terminated surface. In all the IR spectra, librational modes are visible between 0 and 1000 cm−1, as well as the bending mode. The latter is shifted to 1750 cm−1 in the simulations, whereas it is found around 1640 cm−1 in experiments.
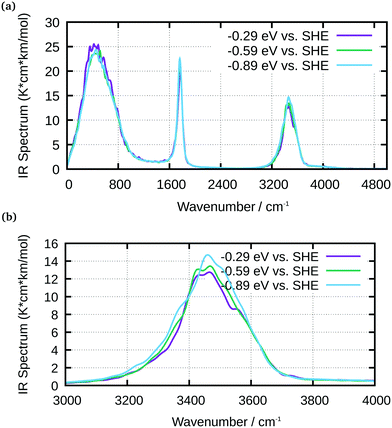 | ||
| Fig. 8 IR spectra of water at Ge–H obtained from AIMD simulations for selected potentials, as indicated in the graph; (a) full spectrum; (b) enlarged water stretching mode region. | ||
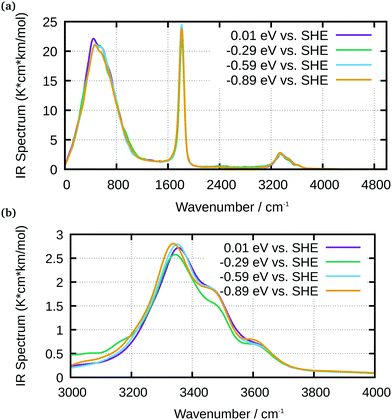 | ||
| Fig. 9 IR spectra of water at Ge–OH obtained from AIMD simulations for selected potentials, as indicated in the graph; (a) full spectrum; (b) enlarged water stretching mode region. | ||
It is evident from the simulations that the largest part of the observed spectral changes in experiments stems from the fact that the surface termination changes; at each surface, the spectra do not change significantly with potential. In so far, experiments and calculations agree. For comparison with the experiments, a plot of a difference spectrum obtained in a similar manner as done in experiments is best suited (Fig. 10). For the calculation, the spectra shown at the most positive potential 0.01 V for Ge–OH was subtracted from the spectrum at −0.89 V for Ge–H. This subtraction of calculated absorption coefficients corresponds to the logarithmic subtraction of experimental spectra commonly performed in the acquisition of experimental data. Spectra were scaled such that their maximum absorbance between 3000 and 4000 cm−1 was set to unity. With some shifts in wavenumber, the resulting spectrum closely resembles the OH stretching mode region in the experimental interface water spectrum shown in Fig. 5. The high wavenumber region is stronger developed in the calculated spectrum, presumably because of the larger fraction of water molecules in direct contact with hydrophobic areas in the simulations.
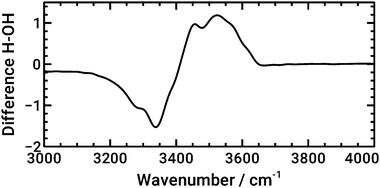 | ||
| Fig. 10 Calculated IR difference spectrum between the AIMD-calculated spectrum of water at Ge–H at −0.89 V and at Ge–OH at 0.01 V, resembling approximately the experimental situation. | ||
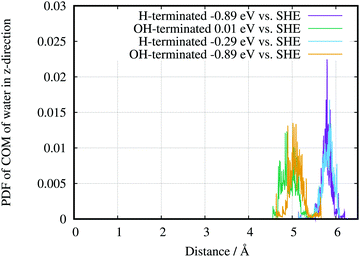
The AIMD also lead to evidence for a hydrophobic H-terminated surface and a hydrophilic OH-terminated surface. Plotting the probability distribution function (PDF) of the centre of mass of surface water for the two different surface terminations (Fig. 11) shows a shift of the average position of water with respect to the surface. Going in the direction from the –OH to the –H termination, i.e., decreasing the potential, the PDFs have widths of (0.9 ± 0.05) Å and (0.6 ± 0.05) Å, respectively. The corresponding distances from the surface are 4.9 Å and 5.8 Å respectively, which results in a difference of 0.9 Å between the peak positions. Going in the opposite direction, OH-termination at −0.89 V and H-termination at −0.29 V, the distances are (5.09 ± 0.05) Å and (5.89 ± 0.05) Å respectively, which results in a difference of 0.8 Å. Consequently the main effect of the peak positions of the PDF arises from the different chemical environments. Due to small changes in the surface charges, the different potentials play only a smaller role for the gap between electrode and water in this setup. Although the above differences are not directly comparable to the experimentally determined gap between the Ge–H and the first layer of water, the theory can reproduce the hydrophilic behaviour of the Ge–OH terminated surface, and the hydrophobic behaviour of the Ge–H terminated surface. A quantitative comparison between calculation and experiments needs to take into account averaging of the information in the experiment.
4 Conclusion
When the Ge(100) surface transforms from a OH-terminated surface at higher electrode potentials to an H-terminated surface at lower electrode potentials, the surface becomes partly desolvated: interfacial water molecules are displaced from the surface at more negative potentials. In the transition region, the displacement is potential dependent. At lowest potentials, the displacement was estimated from experiments to be ≈2 Å. AIMD simulations show that the centre of mass of water molecules moved ≈0.9 Å from the germanium surface. The IR spectrum of the interfacial water clearly displays the mode typically assigned to “free” OH groups, and observed in liquid water only in contact with hydrophobic surfaces. Before and after the surface transformation, the potential dependence of the IR spectrum is weak. The IR spectrum of the interfacial water also shows a decrease in the fraction of very strongly hydrogen bound water molecules after switching the surface to the hydrophobic state. The potential at which the surface transforms shows the thermodynamically expected dependence on pH. The switching in hydrophobicity with electrode potential is reversible, because of the reversible switch in the surface termination. This reversibility in switching makes the system interesting from the materials science point of view. The possibility to couple it with DFT calculations for different chemical potentials of the electrode will foster fundamental understanding. The semiquantitative agreement with experiments of the electronic grand-potential real space DFT shows the potential of this approach to genuinely electrochemical ab initio simulations, with full treatment of the electric double layer of the electrode.Acknowledgements
This work is supported by the Cluster of Excellence RESOLV (EXC 1069) funded by the Deutsche Forschungsgemeinschaft within the framework of the German Excellence Initiative. F. N. and A. E. acknowledge the MPIE machine shop for building the in situ experiment cells, Petra Ebbinghaus for technical assistance and Simantini Nayak as well as P. Ulrich Biedermann for helpful discussions. A. E. thanks M. Stratmann for continuous support. Open Access funding provided by the Max Planck Society.References
- H. S. Frank and M. W. Evans, J. Chem. Phys., 1945, 13, 507–532 CrossRef CAS
.
- W. Blokzijl and J. B. F. N. Engberts, Angew. Chem., Int. Ed. Engl., 1993, 32, 1545–1579 CrossRef
.
- N. T. Southall, K. A. Dill and A. D. J. Haymet, J. Phys. Chem. B, 2002, 106, 521–533 CrossRef CAS
.
- E. A. Vogler, Adv. Colloid Interface Sci., 1998, 74, 69–117 CrossRef CAS PubMed
.
- F. Perakis, L. D. Marco, A. Shalit, F. Tang, Z. R. Kann, T. D. Kühne, R. Torre, M. Bonn and Y. Nagata, Chem. Rev., 2016, 116, 7590–7607 CrossRef CAS PubMed
.
- A. Verdaguer, G. M. Sacha, H. Bluhm and M. Salmeron, Chem. Rev., 2006, 106, 1478–1510 CrossRef CAS PubMed
.
- S. Ebbinghaus, S. J. Kim, M. Heyden, X. Yu, U. Heugen, M. Gruebele, D. M. Leitner and M. Havenith, Proc. Natl. Acad. Sci. U. S. A., 2007, 104, 20749–20752 CrossRef CAS PubMed
.
- H. Bluhm, D. F. Ogletree, C. S. Fadley, Z. Hussain and M. Salmeron, J. Phys.: Condens. Matter, 2002, 14, L227 CrossRef CAS
.
- M. Sovago, R. K. Campen, G. W. H. Wurpel, M. Müller, H. J. Bakker and M. Bonn, Phys. Rev. Lett., 2008, 100, 173901 CrossRef PubMed
.
- M. Valtiner, A. Erbe and A. Rosenhahn, Biointerphases, 2016, 11, 018801 CrossRef PubMed
.
-
M. Milosevic, Internal Reflection and Spectroscopy. ATR, Wiley, New York, USA, 2012 Search PubMed
.
- D. A. Woods and C. D. Bain, Soft Matter, 2014, 10, 1071–1096 RSC
.
-
A. Erbe, A. Sarfraz, C. Toparli, K. Schwenzfeier and F. Niu, in Soft Matter atAqueous Interfaces, ed. P. R. Lang and Y. Liu, Springer, Cham, Switzerland, 2016, vol. 917, pp. 459–490 Search PubMed
.
- J. Yang, S. Meng, L. Xu and E. G. Wang, Phys. Rev. B: Condens. Matter Mater. Phys., 2005, 71, 035413 CrossRef
.
- P. A. Thiel, F. M. Hoffmann and W. H. Weinberg, J. Chem. Phys., 1981, 75, 5556–5572 CrossRef CAS
.
- B. Maté, A. Medialdea, M. A. Moreno, R. Escribano and V. J. Herrero, J. Phys. Chem. B, 2003, 107, 11098–11108 CrossRef
.
- M. Nakamura, Y. Shingaya and M. Ito, Chem. Phys. Lett., 1999, 309, 123–128 CrossRef CAS
.
- B. W. Callen, K. Griffiths and P. R. Norton, Phys. Rev. Lett., 1991, 66, 1634–1637 CrossRef CAS PubMed
.
- G. E. Ewing, J. Phys. Chem. B, 2004, 108, 15953–15961 CrossRef CAS
.
- Q. Du, E. Freysz and Y. R. Shen, Science, 1994, 264, 826–828 CAS
.
- T. A. Weber and F. H. Stillinger, J. Phys. Chem., 1983, 87, 4277–4281 CrossRef CAS
.
- W. Gan, D. Wu, Z. Zhang, R. R. Feng and H. F. Wang, J. Chem. Phys., 2006, 124, 114705 CrossRef PubMed
.
- D. A. Schmidt and K. Miki, J. Phys. Chem. A, 2007, 111, 10119–10122 CrossRef CAS PubMed
.
- H. A. Al-Abadleh and V. H. Grassian, Langmuir, 2003, 19, 341–347 CrossRef CAS
.
- D. B. Asay and S. H. Kim, J. Phys. Chem. B, 2005, 109, 16760–16763 CrossRef CAS PubMed
.
- M. Foster, M. D'Agostino and D. Passno, Surf. Sci., 2005, 590, 31–41 CrossRef CAS
.
- M. Foster, M. Furse and D. Passno, Surf. Sci., 2002, 502–503, 102–108 CrossRef CAS
.
- P. B. Miranda, L. Xu, Y. R. Shen and M. Salmeron, Phys. Rev. Lett., 1998, 81, 5876–5879 CrossRef CAS
.
- M. S. Bergren, D. Schuh, M. G. Sceats and S. A. Rice, J. Chem. Phys., 1978, 69, 3477–3482 CrossRef CAS
.
- F. H. Stillinger, J. Solution Chem., 1973, 2, 141–158 CrossRef CAS
.
- D. Chandler, Nature, 2005, 437, 640–647 CrossRef CAS PubMed
.
- S. H. Lee and P. J. Rossky, J. Chem. Phys., 1994, 100, 3334–3345 CrossRef CAS
.
- D. K. Hore, D. S. Walker and G. L. Richmond, J. Am. Chem. Soc., 2008, 130, 1800–1801 CrossRef CAS PubMed
.
- S. Iuchi, H. Chen, F. Paesani and G. A. Voth, J. Phys. Chem. B, 2009, 113, 4017–4030 CrossRef CAS PubMed
.
- P. Ball, Nature, 2003, 423, 25–26 CrossRef CAS PubMed
.
- D. Chandler, Nature, 2007, 445, 831–832 CrossRef CAS PubMed
.
- S. Granick and S. C. Bae, Science, 2008, 322, 1477–1478 CrossRef CAS PubMed
.
- D. A. Doshi, E. B. Watkins, J. N. Israelachvili and J. Majewski, Proc. Natl. Acad. Sci. U. S. A., 2005, 102, 9458–9462 CrossRef CAS PubMed
.
- M. Maccarini, R. Steitz, M. Himmelhaus, J. Fick, S. Tatur, M. Wolff, M. Grunze, J. Janeček and R. R. Netz, Langmuir, 2007, 23, 598–608 CrossRef CAS PubMed
.
- D. Schwendel, T. Hayashi, R. Dahint, A. Pertsin, M. Grunze, R. Steitz and F. Schreiber, Langmuir, 2003, 19, 2284–2293 CrossRef CAS
.
- M. Mezger, H. Reichert, S. Schöder, J. Okasinski, H. Schröder, H. Dosch, D. Palms, J. Ralston and V. Honkimäki, Proc. Natl. Acad. Sci. U. S. A., 2006, 103, 18401–18404 CrossRef CAS PubMed
.
- A. Poynor, L. Hong, I. K. Robinson, S. Granick, Z. Zhang and P. A. Fenter, Phys. Rev. Lett., 2006, 97, 266101 CrossRef PubMed
.
- M. Mezger, S. Schöder, H. Reichert, H. Schröder, J. Okasinski, V. Honkimäki, J. Ralston, J. Bilgram, R. Roth and H. Dosch, J. Chem. Phys., 2008, 128, 244705 CrossRef PubMed
.
- J. R. T. Seddon and D. Lohse, J. Phys.: Condens. Matter, 2011, 23, 133001 CrossRef PubMed
.
- V. S. J. Craig, Soft Matter, 2011, 7, 40–48 RSC
.
- M. Hampton and A. Nguyen, Adv. Colloid Interface Sci., 2010, 154, 30–55 CrossRef CAS PubMed
.
- Y.-H. Lu, C.-W. Yang and I.-S. Hwang, Langmuir, 2012, 28, 12691–12695 CrossRef CAS PubMed
.
- C.-W. Yang, Y.-H. Lu and I.-S. Hwang, J. Phys.: Condens. Matter, 2013, 25, 184010 CrossRef PubMed
.
- R. Memming and G. Neumann, J. Electroanal. Chem. Interfacial Electrochem., 1969, 21, 295–305 CrossRef CAS
.
- F. Maroun, F. Ozanam and J.-N. Chazalviel, J.
Phys. Chem. B, 1999, 103, 5280–5288 CrossRef CAS
.
- F. Maroun, J.-N. Chazalviel, F. Ozanam and D. Lincot, J. Electroanal. Chem., 2003, 549, 161–163 CrossRef CAS
.
- J.-N. Chazalviel, A. Belaïdi, M. Safi, F. Maroun, B. Erné and F. Ozanam, Electrochim. Acta, 2000, 45, 3205–3211 CrossRef CAS
.
- S. Nayak and A. Erbe, Phys. Chem. Chem. Phys., 2016, 18, 25100–25109 RSC
.
- N. Kemnade, Y. Chen, M. I. Muglali and A. Erbe, Phys. Chem. Chem. Phys., 2014, 16, 17081–17090 RSC
.
- M. I. Muglali, A. Erbe, Y. Chen, C. Barth, P. Koelsch and M. Rohwerder, Electrochim. Acta, 2013, 90, 17–26 CrossRef CAS PubMed
.
- S. Nayak, P. U. Biedermann, M. Stratmann and A. Erbe, Phys. Chem. Chem. Phys., 2013, 15, 5771–5781 RSC
.
- W. Cheng, S.-F. Ren and P. Y. Yu, Phys. Rev. B: Condens. Matter Mater. Phys., 2003, 68, 193309 CrossRef
.
- U. Benedikt, W. B. Schneider and A. A. Auer, Phys. Chem. Chem. Phys., 2013, 15, 2712–2724 RSC
.
- A. Y. Lozovoi, A. Alavi, J. Kohanoff and R. M. Lynden-Bell, J. Chem. Phys., 2001, 115, 1661–1669 CrossRef CAS
.
- V. M. Sánchez, M. Sued and D. A. Scherlis, J. Chem. Phys., 2009, 131, 174108 CrossRef PubMed
.
- R. Car and M. Parrinello, Phys. Rev. Lett., 1985, 55, 2471–2474 CrossRef CAS PubMed
.
- S. Nayak, P. U. Biedermann, M. Stratmann and A. Erbe, Electrochim. Acta, 2013, 106, 472–482 CrossRef CAS
.
- R. Schmid, M. Tafipolsky, P. H. König and H. Köstler, Phys. Status Solidi B, 2006, 243, 1001–1015 CrossRef CAS
.
- I. Borukhov, D. Andelman and H. Orland, Phys. Rev. Lett., 1997, 79, 435–438 CrossRef CAS
.
- I. Borukhov, D. Andelman and H. Orland, Electrochim. Acta, 2000, 46, 221–229 CrossRef CAS
.
- N. Troullier and J. L. Martins, Phys. Rev. B: Condens. Matter Mater. Phys., 1991, 43, 1993–2006 CrossRef CAS
.
- L. Kleinman and D. M. Bylander, Phys. Rev. Lett., 1982, 48, 1425–1428 CrossRef CAS
.
- M. Tafipolsky and R. Schmid, J. Chem. Phys., 2006, 124, 174102 CrossRef PubMed
.
- B. Hammer, L. B. Hansen and J. K. Nørskov, Phys. Rev. B: Condens. Matter Mater. Phys., 1999, 59, 7413–7421 CrossRef
.
- S. Grimme, J. Antony, S. Ehrlich and H. Krieg, J. Chem. Phys., 2010, 132, 154104 CrossRef PubMed
.
- E. Gongadze, U. van Rienen, V. Kralj-Iglič and A. Iglič, Comput. Methods Biomech. Biomed. Eng. Imaging Vis., 2013, 16, 463–480 CrossRef CAS PubMed
.
- Y. Marcus, J. Chem. Phys., 2012, 137, 154501 CrossRef PubMed
.
- W. R. Fawcett, Condens. Matter Phys., 2005, 8, 413–424 CrossRef
.
-
A. Pullman and J. Jortner, Transport Through Membranes: Carriers, Channels and Pumps: Proceedings of the Twenty-First Jerusalem Symposium on Quantum Chemistry and Biochemistry Held in Jerusalem, Israel, May 16–19, 1988, Springer, Netherlands, 2012 Search PubMed
.
- S. Trasatti, Pure Appl. Chem., 1986, 58, 955–966 CAS
.
- P. E. Blöchl, Phys. Rev. B: Condens. Matter Mater. Phys., 2002, 65, 104303 CrossRef
.
- S. Van Damme, P. Bultinck and S. Fias, J. Chem. Theory Comput., 2009, 5, 334–340 CrossRef CAS PubMed
.
-
F. Niu and A. Erbe, Light, Energy and the Environment, Washington, D.C., USA, 2016, p. JW4A.14 Search PubMed
.
- C. I. Ratcliffe and D. E. Irish, Can. J. Chem., 1984, 62, 1134–1144 CrossRef CAS
.
- L. Bencivenni, R. Caminiti, A. Feltrin, F. Ramondo and C. Sadun, J. Mol. Struct.: THEOCHEM, 1992, 257, 369–403 CrossRef
.
- A. Karelin, Z. Grigorovich and V. Rosolovskii, Spectrochim. Acta, Part A, 1975, 31, 765–775 CrossRef
.
- M. Falk and T. A. Ford, Can. J. Chem., 1966, 44, 1699–1707 CrossRef CAS
.
- J. Bertie and Z. Lan, Appl. Spectrosc., 1996, 50, 1047–1057 CrossRef CAS
.
- M. Schubert, Phys. Rev. B: Condens. Matter Mater. Phys., 1996, 53, 4265–4274 CrossRef CAS
.
- M. Reithmeier and A. Erbe, Phys. Chem. Chem. Phys., 2010, 12, 14798–14803 RSC
.
- H. Dietrich, Angew. Chem., 1961, 73, 511–512 CrossRef
.
- Y. Ni and J. L. Skinner, J. Chem. Phys., 2015, 143, 014502 CrossRef PubMed
.
- M. Falk, Spectrochim. Acta, Part A, 1984, 40, 43–48 CrossRef
.
- C. Lee, J. A. McCammon and P. J. Rossky, J. Chem. Phys., 1984, 80, 4448–4455 CrossRef CAS
.
- J. Janeček and R. R. Netz, Langmuir, 2007, 23, 8417–8429 CrossRef PubMed
.
- L. F. Scatena, M. G. Brown and G. L. Richmond, Science, 2001, 292, 908–912 CrossRef CAS PubMed
.
- C. S. Tian and Y. R. Shen, Proc. Natl. Acad. Sci. U. S. A., 2009, 106, 15148–15153 CrossRef CAS PubMed
.
- Q. Du, R. Superfine, E. Freysz and Y. R. Shen, Phys. Rev. Lett., 1993, 70, 2313–2316 CrossRef CAS PubMed
.
- A. Yamakata, E. Soeta, T. Ishiyama, M. Osawa and A. Morita, J. Am. Chem. Soc., 2013, 135, 15033–15039 CrossRef CAS PubMed
.
- L. F. Scatena and G. L. Richmond, J. Phys. Chem. B, 2001, 105, 11240–11250 CrossRef CAS
.
- M. G. Brown, D. S. Walker, E. A. Raymond and G. L. Richmond, J. Phys. Chem. B, 2003, 107, 237–244 CrossRef CAS
.
- B. W. Batterman and D. R. Chipman, Phys. Rev., 1962, 127, 690–693 CrossRef CAS
.
- M. Cardona, Phys. Status Solidi B, 1983, 118, 463–481 CrossRef CAS
.
| This journal is © the Owner Societies 2017 |

