Kinetic analysis of overlapping multistep thermal decomposition comprising exothermic and endothermic processes: thermolysis of ammonium dinitramide†
Received
1st December 2016
, Accepted 5th January 2017
First published on 5th January 2017
Abstract
This study focused on kinetic modeling of a specific type of multistep heterogeneous reaction comprising exothermic and endothermic reaction steps, as exemplified by the practical kinetic analysis of the experimental kinetic curves for the thermal decomposition of molten ammonium dinitramide (ADN). It is known that the thermal decomposition of ADN occurs as a consecutive two step mass-loss process comprising the decomposition of ADN and subsequent evaporation/decomposition of in situ generated ammonium nitrate. These reaction steps provide exothermic and endothermic contributions, respectively, to the overall thermal effect. The overall reaction process was deconvoluted into two reaction steps using simultaneously recorded thermogravimetry and differential scanning calorimetry (TG–DSC) curves by considering the different physical meanings of the kinetic data derived from TG and DSC by P value analysis. The kinetic data thus separated into exothermic and endothermic reaction steps were kinetically characterized using kinetic computation methods including isoconversional method, combined kinetic analysis, and master plot method. The overall kinetic behavior was reproduced as the sum of the kinetic equations for each reaction step considering the contributions to the rate data derived from TG and DSC. During reproduction of the kinetic behavior, the kinetic parameters and contributions of each reaction step were optimized using kinetic deconvolution analysis. As a result, the thermal decomposition of ADN was successfully modeled as partially overlapping exothermic and endothermic reaction steps. The logic of the kinetic modeling was critically examined, and the practical usefulness of phenomenological modeling for the thermal decomposition of ADN was illustrated to demonstrate the validity of the methodology and its applicability to similar complex reaction processes.
1. Introduction
Kinetic analysis of heterogeneous reaction processes using various thermoanalytical techniques is widely applied in different fields with diverse purposes. The methodology for kinetic analysis has been developed largely based on the assumption of single step reactions.1,2 However, the kinetic behaviors of actual heterogeneous reaction processes that occur in the solid state or in viscous liquids and are accompanied by interactions with gases are not so simple, being largely influenced by various physico-chemical and physico-geometrical phenomena. Thermal decomposition of solids (A(s) → B(s) + C(g)) is a typical example that exhibit complex overall kinetic behavior.3–7 When more than one heterogeneous reaction takes place simultaneously, the kinetic interpretation of the overall heterogeneous process and of each component reaction step by analyzing experimental kinetic data resolved using thermoanalytical techniques is a challenging task.
Rigorous and effective solutions for determining the kinetic features of such multistep and heterogeneous reactions are required in many fields, including materials development, product management, and safety assessment. The applicability of kinetic calculation methods available to the thermoanalytical data of multistep reactions has been examined through trial kinetic analyses of mathematically simulated kinetic data.8–12 Several sophisticated mathematical software packages have been developed for the formal kinetic description of multistep processes.13 Furthermore, a great deal of experimental effort has recently been focused on finding rigorous kinetic solutions based on the physico-chemistry and physico-geometry of heterogeneous multistep processes.7,14–19
Considering the thermoanalytical approaches to heterogeneous multistep reactions, further complications are introduced when the overall reaction comprises partially overlapping processes with oppositely signed thermoanalytical signals, e.g., mass loss and mass gain20–22 or exothermic and endothermic events.23 When two overlapping mass-loss processes indicate endothermic and exothermic effects, respectively, the apparent kinetic data recorded using differential scanning calorimetry (DSC) are different from those recorded with thermogravimetry (TG), as has been shown for isopropylammonium nitrate decomposition.24 This type of process with superimposed oppositely signed thermal effects has also been observed during kerogen pyrolysis.25 Sophisticated kinetic deconvolution technique has been applied to this type of solid-state reaction, as reported for the thermal decompositions of sodium percarbonate23 and tin(II) oxyhydroxide.22 Through kinetic deconvolution analysis, the kinetic parameters for constituent reaction steps with opposite thermoanalytical signals have been linked with the physico-chemical and physico-geometrical features of the transformations.
The thermal decomposition of ammonium dinitramide (ADN), a promising green oxidizer for propellant formulations, is one such multistep processes composed of exothermic and endothermic reaction steps. On heating linearly, first the sample melts at 366 K, and the molten ADN decomposes by evolving a range of gases including NO2, N2O, NO, N2, H2O, and NH3via complex multistep chemical processes with consecutive, concurrent, and competitive reaction schemes.26–29 From the viewpoint of the overall thermal effect revealed using DSC, the reaction starts as an exothermic reaction due to the overall decomposition of the molten ADN and becomes an endothermic evaporation/decomposition of the in situ-produced ammonium nitrate (AN),26,30–32 as illustrated schematically in Fig. 1. The mass-loss behavior revealed using TG is also characterized as a partially overlapping two-step reaction, resulting from gaseous evolution by the decomposition of the molten ADN and the subsequent evaporation/decomposition of AN. It is also reported in the literature30 that the experimentally resolved shapes of TG and DSC curves change significantly with the reaction conditions applied. In addition, it has been reported that a nearly constant exothermic value for the total thermal effect of the reaction is observed under environmental pressures lower than 5 MPa,31,33 but the value increases under higher pressures.31 These changes in the shapes of the TG and DSC curves and the total thermal effect are probably caused by variations in the contributions of the exothermic and endothermic reaction steps and their differing degrees of overlap depending on the reaction conditions. Therefore, a phenomenological kinetic modeling of the thermal decomposition of ADN based on the assumption that it is a partially overlapping two-step reaction comprising initial exothermic and subsequent endothermic reaction steps may be practically valuable for understanding its thermodynamic and kinetic features.
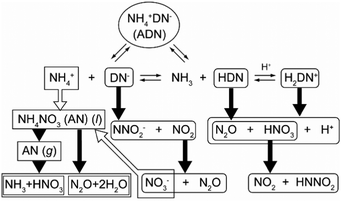 |
| | Fig. 1 Schematic illustration of the reaction pathways for the thermal decomposition of ADN.26,27,30,34,35 | |
This study focuses on the establishment of a methodology for kinetic modeling by deconvolution of an overall reaction into exothermic and endothermic reaction steps using simultaneously recorded TG and DSC curves. A deconvolution method using experimental TG and DSC curves is proposed based on the procedure previously reported by Schmid et al.24 The separated kinetic curves of the exothermic and endothermic reaction steps are analyzed as single-step reactions. The results of the kinetic analysis, including the contributions of each reaction step to the overall reaction, are refined by assuming that the kinetic data for the overall reaction process is the sum of the two reaction steps weighed by the contributions of each reaction step. The logics of the proposed kinetic approach and the meaning of the results are critically examined to validate the phenomenological kinetics of the thermal decomposition of ADN. Furthermore, strategies for further detailed phenomenological kinetic characterization and also the physico-chemical kinetic interpretation of other systems are discussed by reviewing the results of the practical kinetic analysis of the experimental TG–DSC curves for the thermal decomposition of ADN.
2. Theoretical
For a single-step reaction in a heterogeneous process, the normalized overall reaction rate (dα/dt) is expressed as a function of temperature T and fractional conversion α:1,2,36| |  | (1) |
where A and Ea are the apparent values of Arrhenius preexponential factor and activation energy, respectively, and f(α) is the kinetic model function, which describes physico-chemical and physico-geometrical reaction mechanism. By extending this relationship to a partially overlapping multistep reaction process, the overall reaction rate (dα/dt) is expressed by the weighed sum of the normalized reaction rates of the component reaction steps by considering the contribution χ of each reaction step i:14,37| |  | (2) |
where n is the total number of component reaction steps.
When applying the general rate expression of eqn (2) to experimentally resolved kinetic behavior using thermal analysis, care must be taken because the value of the overall reaction rate depends on physical quantities measured using different thermoanalytical techniques. A simple example is seen for a partially overlapping two-step process composed of successive mass-loss steps accompanied by exothermic and endothermic effects. The ratios between the mass-loss values of Δm1 and Δm2 and between the thermal effects Q1 and Q2 during the first and second reaction steps are different. Therefore, two different equations are derived from eqn (2) when analyzing the kinetics on the basis of derivative TG (DTG) and DSC curves:9
| |  | (3) |
| |  | (4) |
where
η and
γ are the contributions of the first reaction step determined on the basis of DTG and DSC curves, respectively:
η = Δ
m1/(Δ
m1 + Δ
m2) and
γ =
Q1/(
Q1 +
Q2).
Schmid et al.24 used these relationships to analyze the consecutive endothermic evaporation and subsequent exothermic vapor decomposition of isopropylammonium nitrate using TG and DSC measurements by combining eqn (3) and (4):24
| |  | (5) |
The proportionality
P can be a function of
T when the reaction is monitored under linearly increasing temperature conditions. If the overlap of the two reaction steps is limited, the contribution of the second reaction step can be ignored at the initial stage of the overall reaction,
i.e., (d
α2/d
t) = 0. Thus, the
P(
T) value corresponds to the ratio of
γ and
η,
i.e.,
P(
T) =
γ/
η. Similarly, the contribution of the first reaction step is ignored at the final stage of the overall reaction,
i.e., (d
α1/d
t) = 0, and thus
P(
T) = (1 –
γ)/(1 –
η). By knowing
P(
T) values at the initial and final stages of the overall reaction, the values of
η and
γ may be determined. Then, the normalized reaction rate of each component process at different temperature can be calculated by:
| |  | (6) |
| |  | (7) |
The series of (d
α1/d
t,
T) and (d
α2/d
t,
T) data calculated using
eqn (6) and (7) can be used as the kinetic data for the first and second reaction steps.
3. Experimental
Fairly uniformly dispersed spherical ammonium dinitramide (ADN; >99.5% purity) particles were used without further purification. The scanning electron microscopy images and the particle size distribution of the material are shown in Fig. S1 and S2 in the ESI.† The ADN sample was loaded into sealed aluminum pans (5.5 mm in diameter) with pierced lids. Due to the energetic nature of the compound, a small sample mass, i.e., 1.1 ± 0.1 mg, was used for the measurements to avoid the self-heating effect,38 although this results in a noisy DTG signal. Simultaneous TG–DSC measurements for the thermal decomposition of ADN were performed at β values of 1, 2, 5, and 10 K min−1 under an argon flow of 70 cm3 min−1 using a Netzsch STA 449 F3 instrument. It is acknowledged that temperature and enthalpy change have been calibrated using melting of pure metals (>99.99%, In, Sn, Pb, and Zn). The mass change value in TG was calibrated using automatic calibration mode of the balance system at room temperature and the reproducibility at higher temperatures was confirmed by the measurement of the thermal dehydration and decomposition of calcium oxalate monohydrate as recommended elsewhere. All the TG–DSC measurements for calibrating the instruments were performed under the same measurement conditions for the sample. The measurements were repeated for each value of β at least two times to confirm the repeatability of the TG–DSC analysis and the systematic changes in the TG–DSC curves with β. Kinetic calculations for the experimental TG–DSC curves were performed using THINKS program developed by ourselves, which is available online with all the kinetic data used for the calculation.39
4. Results and discussion
4.1 Deconvolution of exothermic and endothermic reaction steps
Fig. 2 shows typical TG/DTG–DSC curves for ADN heated at 10 K min−1 under flowing argon. The DSC curve indicates that melting point of ADN is 366 K. The subsequent thermal decomposition of the molten ADN occurs at a higher temperature as a partially overlapping two-step mass-loss process, as is clearly seen from the DTG curve. The entire sample is converted to product gases by the overall reaction, as indicated by the approximately 100% mass loss in the TG curves (experimental error <3%). The TG–DSC curves systematically shift to higher temperatures with increasing β (Fig. S3 in the ESI†). It must be noted that the two mass-loss steps indicate exothermic and endothermic effects, respectively, as seen from the DSC curves. The total thermal effect, i.e., the sum of the exothermic and the endothermic effects, is calculated to be 1690 ± 140 J (g ADN)−1. The first step of the overall thermal decomposition of ADN involves many consecutive, concurrent, and competitive processes, which produce a certain amount of AN. The second mass-loss step, which is endothermic, is considered to be the evaporation/decomposition of AN.31 Examining the two distinguishable peaks in the DTG curve and the exothermic and endothermic peaks in the DSC curve (Fig. 1), the overlap of the two reaction steps is not so significant in the initial and final parts of the TG–DSC curves; thus, the kinetic information for the first and second reaction steps are reflected in the respective parts. This expectation was roughly examined by applying a differential isoconversional method, i.e. the Friedman method,40 to the series of TG curves at different β values.| |  | (8) |
Fig. 3 shows Ea values calculated from ln(dα/dt) versus T−1 plots at different α. Similar decreasing Ea variation behavior as the reaction advances has been reported for the thermal decomposition of ADN elsewhere.26 The present results indicate different constant Ea values in the initial and final parts of the overall mass-loss process (ca. 190 kJ mol−1 for α < 0.2 and ca. 75 kJ mol−1 for α > 0.8). Because both a linear relationship between ln(dα/dt) and T−1 at constant α and a constant Ea at different α are observed when the isoconversional method is applied to a single step reaction,2 the initial and final parts of the overall thermal decomposition of ADN, which indicates respective constant Ea values, are approximately satisfied by the conditions for a single step reaction. This observation indicates that the influence of the other component reaction step can be neglected for the initial and final parts of the overall mass-loss process; hence, the initial and final parts of the overall kinetic data correspond approximately to the first and second reaction steps, respectively.
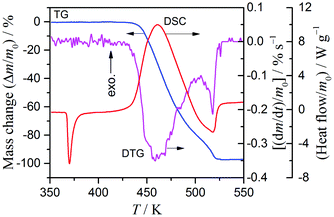 |
| | Fig. 2 Typical TG/DTG–DSC curves for the thermal decomposition of ADN at β = 10 K min−1 under flowing argon. | |
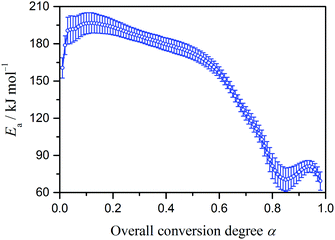 |
| | Fig. 3
E
a values at different α calculated using the Friedman method. | |
For the overlapping features of the thermal decomposition of ADN, it is found that separation of the component steps using combined analysis of the DTG and DSC data, i.e., eqn (5)–(7), is one of the most rigorous methods for characterizing the kinetics of the multistep reaction. Fig. 4 illustrates the changes in P value calculated according to eqn (5) with T. The values of P at the beginning and the end of the process are calculated to be 1.8 and −1.2, respectively, which allows us to estimate the contributions of the first reaction step to mass loss and thermal effect as η ≈ 0.7 and γ ≈ 1.3, respectively.
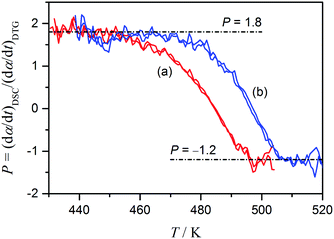 |
| | Fig. 4 Dependence of P value on T for the thermal decomposition of ADN evaluated using simultaneous TG/DTG–DSC curves recorded at (a) β = 5 K min−1 and (b) 10 K min−1 under flowing argon. Duplicate runs are presented. | |
Applying the results of P value analysis shown in Fig. 4 to eqn (6) and (7), the overall kinetic data can be deconvoluted into two reaction steps characterized as the exothermic and endothermic processes, respectively. Fig. 5 shows the kinetic data at different β separated by the combined analysis of kinetic data derived from DTG and DSC curves. The separated kinetic data indicate the different apparent shapes of the reaction steps, and that they shift systematically to higher temperature with increasing β. Note that the second reaction step becomes apparent at a higher temperature than the melting point of AN (443 K) and the reaction rate increases as the reaction proceeds and the sample temperature increases. The shape of the kinetic data for the second reaction step is similar to those reported for the thermal decomposition of AN.41 As stated before, the deconvolution of the kinetic data by the combined use of DTG and DSC is applicable to partially overlapping two-step processes when the initial and final parts of the overall reaction are attributed to the first and second reaction steps, respectively. This procedure also assumes that the DTG and DSC data reflect the same component reactions and their sequence. If the conditions are fulfilled, the partially overlapping two-step reactions can be deconvoluted using simultaneously measured DTG and DSC data without any assumption of the possible interactions between the component reaction steps. It must be noted that, whether there is interaction between the reaction steps or not, the separated kinetic curves indicate the net kinetic behaviors of each reaction step at a particular value of β.
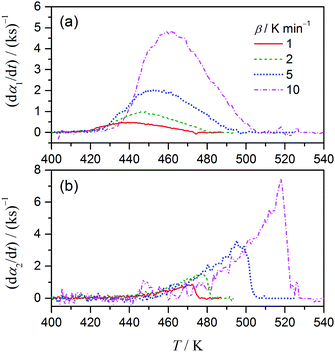 |
| | Fig. 5 Differential kinetic data for the first (a) and second (b) reaction steps of the thermal decomposition of ADN. | |
4.2 Kinetic analysis of the separated reaction steps
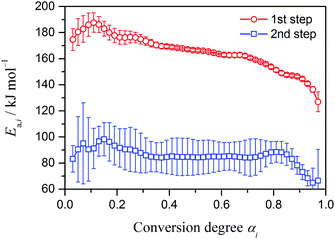
It is expected that, for the separated kinetic data shown in Fig. 5, the kinetic analysis based on the single-step assumption is more applicable than for the original kinetic data before deconvolution. Fig. 6 shows Ea,i values for each reaction step i determined at different αi from the slopes of the Friedman plots (eqn (8)). The Ea,1 values for the first reaction step present a small initial peak (0 < α1 ≤ 0.3) and stabilize between 175–160 kJ mol−1 in the main reaction stage (0.3 ≤ α1 ≤ 0.7) with an average Ea,1 of 166.6 ± 3.4 kJ mol−1, followed by a gradual decrease in the latter reaction stage (α1 > 0.7). For the second reaction step, a larger standard deviation of Ea,2 is observed irrespective of α2 in comparison with that of Ea,1 in the first reaction step, resulting from the larger noise in the derivative kinetic data because of the smaller contribution of the second reaction step to the overall process. The Ea,2 values are approximately constant in a wide α2 region (0 < α2 ≤ 0.85) with a small peak in the early stage of the reaction step (α2 ≤ 0.3) and systematically decrease in the final stage of the reaction step (α2 ≥ 0.85). The variations of Ea,i in the final part of the first reaction step and the initial part of the second reaction step probably indicate the region where the other reaction step contributes significantly. Considering the complex reaction schemes of the first reaction step, which comprises different chemical processes as illustrated in Fig. 1, the Ea,1 variation with a small peak in the early reaction stage and with the slightly decreasing trend observed in the main reaction stage (0.3 ≤ α1 ≤ 0.7) may be interpreted as resulting from the concurrent and/or consecutive reaction processes taking place simultaneously, which may be further complicated by possible interactions. Because the second reaction step (the endothermic process) is considered as the thermally induced evaporation/decomposition of AN, the influence of the reaction setup, which employed sealed aluminum cells with pin holes should also be considered in the interpretation of the systematic decrease in Ea,2 in the final stage of the reaction step. Under such measurement conditions, the experimental mass-loss data is significantly influenced by the diffusional removal of product gases from the sample cell, especially in the final stage of the reaction step.
 |
| | Fig. 6
E
a,i values at different αi of each separated reaction step i calculated using the Friedman method. | |
Although the above isoconversional analysis (i.e., the Friedman method) for the separated kinetic data indicates the necessity of further detailed kinetic analysis, especially for the first reaction step, the kinetic modeling of the overall reaction process by separation into exothermic and endothermic reaction steps has significance for examining the energy yield of the overall reaction. Therefore, based on the approximately constant Ea,i in the main reaction stages of each reaction step, kinetic modeling as a two-step exothermic–endothermic reaction was further examined. To confirm the validity of the single step approximation for each separated reaction step and those at different β, the combined kinetic analysis (CKA) of Perez-Maqueda et al.42 was applied using the Šesták–Berggren model with two kinetic exponents,43–45f(α) = cαm(1 – α)n, as the empirical kinetic model function:
| |  | (9) |
Fig. 7 shows the best linear correlation of ln[(d
αi/d
t)/
αm(i)i(1 –
αi)
n(i)]
versus T−1 for each reaction step including all the kinetic data recorded at different
β, determined through simultaneously optimizing the values of
mi,
ni,
ciAi, and
Ea,i. The optimized kinetic parameters are listed in
Table 1. The ln[(d
αi/d
t)/
αm(i)i(1 –
αi)
n(i)]
versus T−1 plots present acceptable linearity among the data points at different
β, especially for the first reaction step (the correlation coefficients are indicated in
Fig. 7). For the first reaction step, the
Ea,1 value (165.3 ± 1.9 kJ mol
−1) evaluated by CKA corresponds closely to the average
Ea,1 (166.6 ± 3.4 kJ mol
−1) over the main reaction stage (0.3 ≤
α1 ≤ 0.7) determined by the Friedman method. The value of
Ea,2 (91.2 ± 3.5 kJ mol
−1) determined by CKA is slightly higher than the average
Ea,2 (84.8 ± 0.5 kJ mol
−1) over the main reaction stage of the second reaction step (0.3 ≤
α2 ≤ 0.7) in
Fig. 6. The deviation likely results from the larger noise in the kinetic data for the second reaction step that manifests both in the larger standard deviation of the
Ea,2 value determined using the Friedman method and of the linear correlation in CKA.
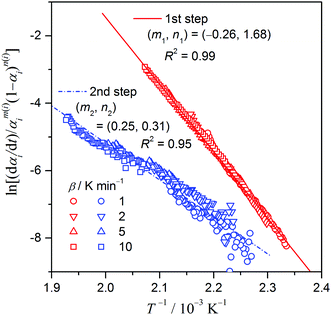 |
| | Fig. 7 The best linear correlations of ln[(dαi/dt)/αm(i)i(1 – αi)n(i)] versus T−1 plots for each reaction step including all the kinetic data recorded at different β, determined through simultaneously optimizing the values of mi, ni, ciAi, and Ea,i. | |
Table 1 Kinetic results for the separated exothermic (i =1) and endothermic (i = 2) reaction steps determined by combined kinetic analysis (CKA) and kinetic deconvolution analysis (KDA)
| Calculation method |
η
|
γ
|
Reaction step, i |
E
a,i/kJ mol−1 |
ln(ciAi/s−1) |
m
i
|
n
i
|
Determination coefficient |
|
Determined by P value analysis (Fig. 3, eqn (5)).
c
i
= 1.
Fixed values in computation.
|
| CKA (eqn (9)) |
0.7a |
1.3a |
1 |
165.3 ± 1.9 |
38.3 ± 0.5 |
−0.26 ± 0.05 |
1.68 ± 0.05 |
R
2 = 0.997 |
| 2 |
91.2 ± 3.5 |
16.8 ± 0.9 |
0.25 ± 0.13 |
0.31 ± 0.13 |
R
2 = 0.946 |
| KDA (eqn (10) and (11)) |
0.79 ± 0.01 |
1.41 ± 0.01 |
1 |
181.7 ± 2.3 |
43.3 ± 0.6 |
0.01 ± 0.01 |
2.57 ± 0.04 |
RSS = 9.7 × 10⁻¹² |
| 2 |
91.8 ± 1.0 |
16.9 ± 0.3 |
0.25c |
0.32 ± 0.02 |
|
| KDA (eqn (12) and (13)) |
0.78 ± 0.01 |
1.40 ± 0.01 |
1 |
184.7 ± 0.9 |
44.1 ± 0.3b |
0c |
2.5c |
RSS = 1.4 × 10⁻¹¹ |
| 2 |
101.7 ± 1.7 |
18.8 ± 0.5b |
0c |
0c |
4.3 Optimization of kinetic parameters
The overall kinetic data derived from DTG and DSC can be reproduced by the weighted sum of the separated kinetic curves of the first and second reaction steps with respective contributions expressed using η or γ.| |  | (10) |
| |  | (11) |
In eqn (10) and (11), a total of ten kinetic parameters (η, γ, c1A1, Ea,1, c2A2, Ea,2, m1, n1, m2, and n2) for describing the kinetic rate behavior of the reaction are included, which have been determined previously through P value analysis and CKA (Table 1). The values of η and γ have been determined by P value analysis with reference to only the initial and final parts of the TG–DSC curves, and the other kinetic parameters were determined for the kinetic data separated using thus determined η and γ values. Therefore, it is preferable to refine all the kinetic parameters including the η and γ values. Nonlinear least squares analysis for fitting the overall kinetic data derived from DTG and DSC by eqn (10) and (11) with variation of the kinetic parameters is one possible procedure for optimizing the kinetic parameters, as is used for kinetic deconvolution analysis (KDA).14,37 Optimization was conducted using the Levenberg–Marquardt nonlinear least-squares algorithm.46 In the present case, the optimization procedure is more reliable than the previously reported KDA for the multistep processes, because the overall kinetic data derived from DTG and DSC are treated simultaneously; thus, it is termed “combined KDA”.
During the optimization runs, which were performed after setting the initial parameters determined by P value analysis and CKA, deviations of the calculated curves from the experimental kinetic curves are observed for the final stage of the reaction, probably due to the rate of second reaction step increasing towards the end of the reaction, as seen in Fig. 5. To avoid this deviation and to obtain better fitting in the final stage of the reaction, m2 was fixed to 0.25, as determined by CKA. Fig. 8 shows the results of this combined KDA as the fits of the calculated curves to the experimental kinetic curves derived from TG and DSC. Irrespective of β, nearly perfect fits to the experimental TG and DSC kinetic curves are obtained by eqn (10) and (11) with the optimized kinetic parameters listed in Table 1. In comparison with the initial kinetic parameters determined by P value analysis and CKA, the kinetic parameters optimized through KDA are slightly larger. The refinement of η and γ values through KDA is crucial for evaluating the separated exothermic and endothermic features of the reaction. Note that the increase in Ea,i through optimization by KDA is also accompanied by a parallel increase in Ai values. Accordingly, the rate constant at a certain temperature calculated using the Arrhenius parameters before and after optimization does not significantly change within the practical reaction temperature region. This phenomenon is known as the apparent kinetic compensation effect (KCE).47–52
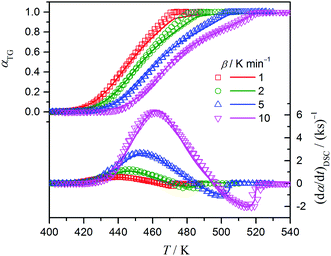 |
| | Fig. 8 The best fits of the TG and DSC kinetic curves with eqn (10) and (11), respectively, obtained through combined KDA. | |
The experimental master plots of fi(αi)/fi(0.5) versus αi for each reaction step were drawn using fi(αi) determined by KDA (eqn (10) and (11))53,54 and compared with several selected theoretical kinetic models, as shown in Fig. 9. The experimental master plot of the first reaction step is positioned in the middle of the empirical second-order reaction (F2) and third-order reaction (F3) models, f(α) = (1 – α)n with n = 2 and n = 3, respectively. As expected from the reaction scheme of the first step (Fig. 1) and the variation in Ea,1 observed by the analysis using the Friedman method (Fig. 6), further detailed kinetic analysis considering a possible multistep process is necessary for understanding the physico-chemical mechanism of this step. The experimental master plot characterized by intermediate behavior between the F2 and F3 models should be interpreted as the apparent rate behavior when assuming the single-step reaction with a constant Ea value. Conversely, when the kinetic behavior of the overall thermal decomposition of ADN is interpreted by separation into exothermic and endothermic reaction steps, the apparent rate behavior between F2 and F3 has a practical meaning in conjunction with the apparent Ea,1 value determined by KDA (eqn (10) and (11)).
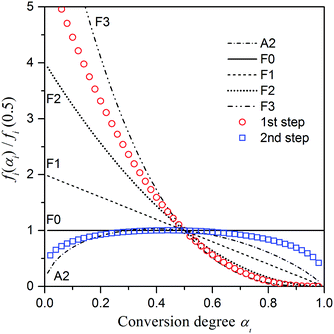 |
| | Fig. 9 Comparison of the experimental master plots of fi(αi)/fi(0.5) versus αi of each reaction step i with the theoretical kinetic models A2, F0, F1, F2, and F3. | |
The experimental master plot of the second reaction step presents a trapezoidal shape and does not fit to any simple theoretical kinetic model. However, the main part of the second reaction step closely corresponds to the zero-order reaction model (F0), f(α) = 1, where the α2 region corresponds to the constant Ea,2 (84.8 ± 0.5 kJ mol−1) region determined by the Friedman method (Fig. 6). The zero-order reaction model for the mass-loss behavior of the molten salts can be interpreted as the evaporation/decomposition at the top surface of the reacting liquid with a constant top surface area during the course of the reaction, as has been illustrated for the thermally induced mass-loss process of molten AN.41,55 When this evaporation is the predominant process of the mass-loss phenomena, the kinetic equation can be replaced by a thermodynamic equation based on Langmuir and Clausius–Clapeyron equations that has the functional form similar to that of the Arrhenius-type kinetic equation55–60 (Section S3, ESI†). However, the ideal situation is not easily observed in the experimentally resolved kinetic curves recorded using thermoanalytical methods, because the changes in the top surface are of the molten salt as the reaction advances. The idealization is further difficult for the second reaction step in the thermal decomposition of ADN. The changes in the concentration of AN in the reacting liquid, the surface area of the reacting liquid, and the transfer phenomena of the evolved gases as the second reaction step advances should be considered when describing the deviation of the experimental master plot from the theoretical F0 model. The deviation in the initial part of the second reaction step is related to the amount of AN formed and rate of its formation during the first reaction step, and it reflects the possible kinetic interaction with this first reaction step. At the same time, because the initial part of the second reaction step overlaps with the maximum rate region of the first reaction step, the transfer phenomena of the gases evolved by the second reaction step is significantly influenced by the gases released (mass transfer phenomena) and exothermic thermal effect (heat transfer phenomena) in the first reaction step. In the final stage of the second reaction step, the reacting liquid may not be uniformly spread on the bottom of the sample cell, and the surface area of the reacting liquid may not be constant. Accordingly, the rate behavior, especially in the α2 region that closely corresponds to the zero-order reaction, is expected to change significantly depending on sampling and TG–DSC measurement conditions. The empirical kinetic model, f2(α2) = α0.25(1 – α)0.32, determined by the combined KDA for the second reaction step reflects both the chemical nature of the second reaction step and the experimental variability of the kinetic data. Thus, the F0 model may be adopted as an idealized model for describing the endothermic reaction step in the overall thermal decomposition of ADN.
4.4 Simplified kinetic modeling with fixed reaction types
Considering the aforementioned kinetic behavior, a simplified kinetic modeling with fixed reaction types may have practical utility for evaluating the changes in reaction pathway and the kinetics of the component reaction steps by investigating the apparent changes in the Arrhenius parameters. From the comparison of the experimental master plots with theoretical kinetic models (Fig. 9), the two partially overlapping reaction steps regulated by the F2.5 and F0 models were selected as candidates for the simplified kinetic modeling. Then, eqn (10) and (11) were simplified and the number of kinetic parameters to be optimized was reduced to six parameters (η, γ, A1, Ea,1, A2, Ea,2).| |  | (12) |
| |  | (13) |
The results of KDA based on eqn (12) and (13) are shown in Fig. S4 (ESI†) as the best fits to the experimental TG and DSC kinetic curves. The optimized kinetic parameters are listed in Table 1. The fits by eqn (12) and (13) are acceptable but inferior to those by eqn (10) and (11). The optimized η and γ values did not change significantly, but the Arrhenius parameters (A1, Ea,1, A2, and Ea,2) all increase slightly from the respective values optimized based on eqn (10) and (11). The distinguishable changes in the Arrhenius parameters may be caused by the deviation of the actual rate behavior from the assumed kinetic model as a simple mathematical consequence.61–64
4.5 Significance of the kinetic results
The important result of the present kinetic approach of separating the exothermic and endothermic reaction steps of the thermal decomposition of ADN is that the net thermal effects of each reaction step, Q1 and Q2, and the relationship of these net thermal effects to the gross thermal effect, QΣ, of the overall reaction process can be estimated using the kinetic parameters optimized by KDA. Fig. 10 shows the kinetic curves separated into exothermic and endothermic reaction steps for DSC and the first and second mass-loss steps for DTG using the optimized kinetic parameters via KDA (eqn (10) and (11)), in which the positions of each net thermal effect on the temperature coordinate and the overlapping features are clearly seen, as well as the magnitude relations (Fig. 10a). In this study, the total thermal effect for the overall thermal decomposition of ADN was determined from DSC curves at different β with the averaged value of QΣ = 1690 ± 140 J (g ADN)−1, which agrees with previously reported values.31,33 Using the contribution γ of Q1 to QΣ, the net thermal effect of the respective reaction steps can be estimated as follows:| | | Q1 = γ·QΣ = 2380 ± 200 J (g ADN)−1 | (14) |
| | | Q2 = (1 − γ)·QΣ = −690 ± 60 J (g ADN)−1 | (15) |
The gross thermal effect of the thermal decomposition of ADN has been reported to be almost independent of pressure up to 5 MPa,31,33 but increases as pressure rises further.31 The Q1 value obtained in this study corresponds to the reported QΣ value at around 6–10 MPa, as illustrated in Fig. 11. It is expected that the increase in QΣ with environmental pressure is related to changes in the formation ratio of AN during the course of the overall reaction and the shift of AN evaporation/decomposition to higher temperatures. For this connection, the present KDA results provide direct information concerning the formation ratio of AN as the contribution of the second mass-loss step to the overall mass loss, (1 – η), as determined to be 0.21 in this study (Fig. 10b). If we assume that the vaporization of AN is a dominant reaction during the second reaction step, approximately 0.33 mol AN is to be produced from 1 mol ADN under the present sample and reaction conditions. Thus, the net endothermic effect determined for the second reaction step, Q2 = −690 ± 60 J (g ADN)−1, is recalculated as −267 ± 23 kJ (mol AN)−1, which is much larger than that reported as the gross thermal effect during the dissociative evaporation of pure AN, −198 ± 16 kJ (mol AN)−1.41 A quantitative comparison of the reaction heats for the second reaction step of ADN decomposition and the dissociative evaporation of pure AN is difficult because of the more complex reaction scheme of the former. As can be seen in Fig. 10a, the entire endothermic process is overlapping with the exothermic process, and the gross endothermic effect observed by experimental DSC is much smaller than the net endothermic effect calculated through kinetic analysis. The larger value of the net endothermic effect is explained by this relationship, and indicates that the second mass-loss step of the thermal decomposition of ADN probably includes reaction components with exothermic effect. In addition to the information on the reaction stoichiometry of the overall reaction revealed by the values of η and γ, the relationship between mass loss and thermal effect in each reaction step and the overlap of the two reaction steps are characterized by the kinetic parameters, involving the Arrhenius parameters and model function, evaluated for each reaction step.
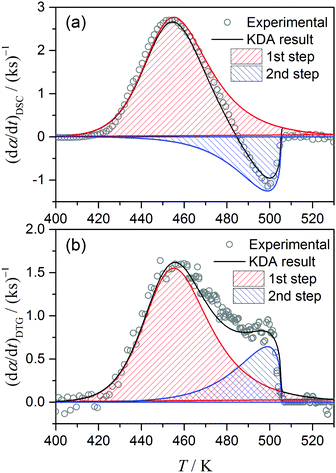 |
| | Fig. 10 Kinetic curves (β = 5 K min−1) separated into exothermic (1st) and endothermic (2nd) reaction steps using the kinetic parameters optimized via KDA based on eqn (10) and (11): (a) DSC and (b) DTG kinetic curves. | |
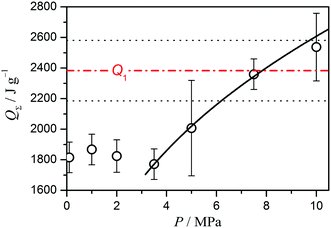 |
| | Fig. 11 Comparison of Q1 determined in this study with reported QΣ values under different pressures.31 | |
An opportunity for further detailed kinetic interpretation of the exothermic and endothermic reaction steps is also gained by deconvolution analysis, although more detailed experimental and theoretical approaches for examining the possible kinetic interaction between the two reaction steps are required. However, rigorous kinetic modeling for a reaction process as complex that shown in Fig. 1 is extremely difficult, and an empirical kinetic modeling for describing the apparent feature of the rate behavior is unavoidable when the TG–DSC curves are considered as the kinetic data. In addition to the chemical scheme of the reaction, the formation of gaseous products in a viscous liquid and removal of those gases from the reaction system accompanied by the decrease in the reactant liquid volume significantly influence the experimentally resolved shape and position of the thermoanalytical curves, as is sometimes observed for the thermal degradation of polymeric materials.65,66 Even allowing for the empirical kinetic modeling for the overall rate behavior, the first reaction step involves at least three distinguishable α1 regions with different Ea,1 values, and these involve changing behaviors as evaluated from the isoconversional method (Fig. 6). In CKA and KDA that forces a constant Ea,1 for the course of the reaction, such variations in Ea,1 observed by the isoconversional method are accommodated in the empirical kinetic model function αm(1)1(1 – α1)n(1). When the F2.5 model is assumed, both the Ea,1 and A1 values increase. These changes are interpreted as being caused by the deviation of the actual rate behavior from F2.5.61–64 Largely dispersed sets of (Ea, A) values for the overall thermal decomposition of ADN have been reported in the literature. The variation of the (Ea, A) data is due to different factors, such as sample properties, reaction conditions, measurement conditions, calculation methods, and assumed kinetic models. However, an empirical linear correlation between Ea and ln![[thin space (1/6-em)]](https://www.rsc.org/images/entities/char_2009.gif) A among those (Ea, A) data sets is evident, as shown in Fig. 12. The (Ea,1, A1) for the first reaction step determined by CKA and KDA lies on the linear regression line. The variation of (Ea,1, A1) caused by the introduction of the simplified F2.5 model for the first reaction step in KDA also occurs along the regression line. Besides such apparent KCE, the kinetic treatment of all the previous studies included in Fig. 12 was on the basis of simplified kinetic modeling that attempted to describe the multistep chemical process by a phenomenological single-step reaction characterized by a set of (Ea, A, f(α)). As is seen in Fig. 7 and 9, the (Ea,1, A1, f1(α1)) determined in this study reproduces the kinetic rate behavior of the first reaction step at an acceptable level depending on the appropriateness of f1(α1) employed to calculate (Ea,1, A1), but has a similar empirical meaning in this respect. When comparing the kinetic rate behavior of the first reaction step under different reaction conditions, the deviation of the actual rate behavior from F2.5 may change depending on the reaction conditions. Then the change in the deviation is reflected by the changes in (Ea,1, A1). Therefore, it must be noted that a single Ea,1 value does not predict the thermal stability and reactivity of the studied material, and the results can have practical significance when considered as a kinetic triplet (Ea,1, A1, f1(α1)).
A among those (Ea, A) data sets is evident, as shown in Fig. 12. The (Ea,1, A1) for the first reaction step determined by CKA and KDA lies on the linear regression line. The variation of (Ea,1, A1) caused by the introduction of the simplified F2.5 model for the first reaction step in KDA also occurs along the regression line. Besides such apparent KCE, the kinetic treatment of all the previous studies included in Fig. 12 was on the basis of simplified kinetic modeling that attempted to describe the multistep chemical process by a phenomenological single-step reaction characterized by a set of (Ea, A, f(α)). As is seen in Fig. 7 and 9, the (Ea,1, A1, f1(α1)) determined in this study reproduces the kinetic rate behavior of the first reaction step at an acceptable level depending on the appropriateness of f1(α1) employed to calculate (Ea,1, A1), but has a similar empirical meaning in this respect. When comparing the kinetic rate behavior of the first reaction step under different reaction conditions, the deviation of the actual rate behavior from F2.5 may change depending on the reaction conditions. Then the change in the deviation is reflected by the changes in (Ea,1, A1). Therefore, it must be noted that a single Ea,1 value does not predict the thermal stability and reactivity of the studied material, and the results can have practical significance when considered as a kinetic triplet (Ea,1, A1, f1(α1)).
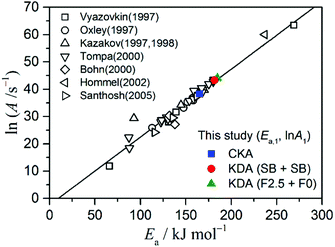 |
| | Fig. 12 Linear correlation among the literature values for (Ea, ln![[thin space (1/6-em)]](https://www.rsc.org/images/entities/char_2009.gif) A) reported for the overall thermal decomposition of ADN26–28,35,67–70 and the correspondence of (Ea,1, ln A) reported for the overall thermal decomposition of ADN26–28,35,67–70 and the correspondence of (Ea,1, ln![[thin space (1/6-em)]](https://www.rsc.org/images/entities/char_2009.gif) A1) values determined in this study for the first reaction step to the linear regression line. A1) values determined in this study for the first reaction step to the linear regression line. | |
Although the rate behavior of the second reaction step, i.e., evaporation/decomposition of AN, deviates slightly from the ideal zero-order model owing to the possible interaction with the first reaction step and the physico-geometrical factors related to the reacting system, the Ea,2 value determined in this study is close to the reported values for the thermally induced evaporation/decomposition of pure AN, i.e., 83–89 kJ mol−1,55 92 kJ mol−1,41 90–98 kJ mol−1.58 It was shown by Vyazovkin41 that the kinetic parameters for the thermal decomposition of pure AN reported by different authors indicated an apparent KCE. The (Ea,2, A2) values determined in this study (Table 1) also lie on the linear regression line of the KCE (Fig. S5, ESI†). As in the case of the first reaction step, variation of (Ea,2, A2) caused by the introduction of simplified kinetic model F0 occurs along the linear regression line of the KCE. Because the experimentally resolved rate behavior of the second reaction step may change with sample and measurement conditions, possible variation of (Ea,2, A2) caused by the change in the deviation of F0 from the actual rate behavior should be considered when interpreting the apparent kinetic parameters. It has also been suggested that one of the possible causes for the apparent KCE is the apparent sample mass effect for the zero-order reaction, which results from the mathematical relationship concerning the definition of α.55 Therefore, if a change in the formation ratio of AN during the reaction occurs owing to the effect of sample and measurement conditions, an apparent change in (Ea,2, A2) is also expected.
Physico-chemical insight into the kinetic behavior of the thermal decomposition of ADN and other energetic materials is the final purpose of kinetic analysis of the reactions. However, considering the heterogeneous nature of the reactions, i.e., gaseous formation in a viscous liquid, and the macroscopic nature of the experimentally resolved kinetic data recorded using thermal analysis, the direct physico-chemical approach to the kinetic data on the basis of complex reaction schemes is not always possible. The present kinetic analysis based on separation of the overall reaction into exothermic and endothermic reaction steps is a phenomenological approach to the kinetic behavior of the reaction, but provides important insights into the reaction, including the contributions of the two reaction steps to the overall process and the relative kinetic features of those reaction steps. In addition, the kinetic analysis of the separated rate data provides the opportunity to find further detailed kinetic features of the overall reaction. We believe that such phenomenological kinetic characterization as has been developed in the field of thermal analysis1,2 does not contradict physico-chemical kinetic understanding, but is a necessary step before challenging the physico-chemical kinetic characterization of complex and heterogeneous reaction processes.
5. Conclusion
Superimposed exothermic and endothermic reaction steps in a multistep process are a specific type of complex heterogeneous reaction in view of thermodynamics and kinetics. Thermal decomposition of molten ADN is an example, comprising the exothermic thermolysis of ADN and the endothermic evaporation/decomposition of in situ generated AN. When the overlap of the exothermic and endothermic reaction steps was limited, and the initial and final parts of the overall reaction solely reflected the initial exothermic reaction step and subsequent endothermic reaction step, respectively, the overall reaction process could be separated into the net exothermic reaction step and endothermic process by P value analysis using simultaneously recorded TG–DSC curves without any assumption of the interaction of those two reaction steps. By P value analysis, the contributions of each reaction step to the overall thermal effect and mass loss can be estimated, and kinetic curves separated into the exothermic and endothermic reaction steps can be obtained. The separated kinetic curves are analyzed kinetically by assuming single-step reactions using available kinetic computation techniques including isoconversional methods, CKA, and the master plot method. The kinetic data for the overall reaction process can be reproduced by the sum of the kinetic equations for the exothermic and endothermic reaction steps weighted by their contributions. The contributions and kinetic parameters can be further optimized by KDA.
For the thermal decomposition of molten ADN, the contributions of the exothermic and endothermic reaction steps in the TG and DSC kinetic data, (η, 1 − η) and (γ, 1 − γ), were evaluated to be (0.79, 0.21) and (1.41, −0.41), respectively. The kinetic parameters of the first (exothermic) and second (endothermic) reaction steps (Ea,i kJ mol−1, Ai s−1, fi(αi)) were determined to be (181.7, 43.3, SB(0.01, 2.57)) and (91.8, 16.9, SB(0.25, 0.32)), respectively. The results of phenomenological kinetic modeling of the overall reaction process of the thermal decomposition of molten ADN as partially overlapping exothermic and endothermic reaction steps revealed the net exothermic and endothermic effects to be Q1 = 2380 ± 200 and Q2 = −690 ± 60 J (g ADN)−1 with reference to the gross thermal effect QΣ = 1690 ± 140 J (g ADN)−1, as well as the relative positions of exothermic and endothermic effects along the temperature coordinate. In addition, a simplified kinetic model with fixed reaction types for the first and second reaction steps can be derived for practical use. Conversely, the kinetic data separated into two reaction steps can be the source for further detailed kinetic analysis of each reaction step.
On the basis of theoretical construction of kinetic analysis procedure and its application to the thermal decomposition of ADN, it is concluded that the present procedure for phenomenological kinetic modeling of a multistep process composed of exothermic and endothermic reaction steps is useful for evaluating the variation of the reaction process of the thermal decomposition of molten ADN with sample and reaction conditions, and is also applicable to similar types of complex reactions found in various fields of material sciences.
Acknowledgements
N. V. M. acknowledges Russian Foundation for Basic Research for a financial support of the kinetic part of the study (project 16-33-60162 mol_a_dk). The mechanistic investigations of ADN decomposition was supported by the Program of Basic Research No 31 of the Presidium RAS (to A. N. P.).
References
-
N. Koga, J. Šesták and P. Šimon, in Thermal analysis of Micro, Nano- and Non-Crystalline Materials, ed. J. Šesták and P. Šimon, Springer, Netherlands, Dordrecht, 2012, vol. 9, pp. 1–28 Search PubMed.
- N. Koga, J. Therm. Anal. Calorim., 2013, 113, 1527–1541 CrossRef CAS.
-
A. K. Galwey and M. E. Brown, Thermal Decomposition of Ionic Solids: Chemical Properties and Reactivities of Ionic Crystalline Phases, Elsevier, Burlington, 1999 Search PubMed.
- A. K. Galwey, Thermochim. Acta, 2000, 355, 181–238 CrossRef CAS.
- N. Koga and H. Tanaka, Thermochim. Acta, 2002, 388, 41–61 CrossRef CAS.
- N. V. Muravyev, K. A. Monogarov, A. F. Asachenko, M. S. Nechaev, I. V. Ananyev, I. V. Fomenkov, V. G. Kiselev and A. N. Pivkina, Phys. Chem. Chem. Phys., 2017, 19, 436–449 RSC.
- C. García-Garrido, P. E. Sánchez-Jiménez, L. A. Pérez-Maqueda, A. Perejón and J. M. Criado, Phys. Chem. Chem. Phys., 2016, 18, 29348–29360 RSC.
- S. V. Vyazovkin, V. I. Goryachko and A. I. Lesnikovich, Thermochim. Acta, 1992, 197, 41–51 CrossRef CAS.
- S. Vyazovkin, Thermochim. Acta, 1994, 236, 1–13 CrossRef CAS.
- S. V. Vyazovkin and A. I. Lesnikovich, Thermochim. Acta, 1990, 165, 273–280 CrossRef CAS.
- J. Cai, W. Wu and R. Liu, Ind. Eng. Chem. Res., 2012, 51, 16157–16161 CrossRef CAS.
- A. K. Burnham, J. Therm. Anal. Calorim., 2000, 60, 895–908 CrossRef CAS.
-
NETZSCH Thermokinetics Software 3. 1, NETZSCH Corporation, Selb, Germany, 2014 Search PubMed.
- P. E. Sánchez-Jiménez, A. Perejón, J. M. Criado, M. J. Diánez and L. A. Pérez-Maqueda, Polymer, 2010, 51, 3998–4007 CrossRef.
- N. Koga, Y. Suzuki and T. Tatsuoka, J. Phys. Chem. B, 2012, 116, 14477–14486 CrossRef CAS PubMed.
- P. E. Sánchez-Jiménez, L. A. Pérez-Maqueda, A. Perejón and J. M. Criado, J. Phys. Chem. C, 2012, 116, 11797–11807 Search PubMed.
- N. Koga, S. Yamada and T. Kimura, J. Phys. Chem. C, 2013, 117, 326–336 CAS.
- M. Nakano, T. Fujiwara and N. Koga, J. Phys. Chem. C, 2016, 120, 8841–8854 CAS.
- T. Fujiwara, M. Yoshikawa and N. Koga, Thermochim. Acta, 2016, 644, 50–60 CrossRef CAS.
- Y. Noda and N. Koga, J. Phys. Chem. C, 2014, 118, 5424–5436 CAS.
- S. Kitabayashi and N. Koga, J. Phys. Chem. C, 2014, 118, 17847–17861 CAS.
- S. Kitabayashi and N. Koga, J. Phys. Chem. C, 2015, 119, 16188–16199 CAS.
- M. Nakano, T. Wada and N. Koga, J. Phys. Chem. A, 2015, 119, 9761–9769 CrossRef CAS PubMed.
- H. Schmid, N. Eisenreich, C. Krause and A. Pfeil, J. Therm. Anal., 1989, 35, 569–576 CrossRef CAS.
- D. Skala, M. Sokić, J. Tomić and H. Kopsch, J. Therm. Anal., 1989, 35, 1441–1458 CrossRef CAS.
- S. Vyazovkin and C. A. Wight, J. Phys. Chem. A, 1997, 101, 5653–5658 CrossRef CAS.
- A. I. Kazakov, Y. I. Rubtsov, L. P. Andrienko and G. B. Manelis, Russ. Chem. Bull., 1998, 47, 379–385 CrossRef CAS.
-
M. A. Bohn, in Proceedings of 27th International Pyrotechnics Seminar, Grand Junction, Colorado USA, 2000, pp. 751–770.
- Y. Izato, M. Koshi, A. Miyake and H. Habu, J. Therm. Anal. Calorim., 2016 DOI:10.1007/s10973-016-5703-4.
- R. Yang, P. Thakre and V. Yang, Combust., Explos. Shock Waves, 2005, 41, 657–679 CrossRef.
- N. V. Muravyev, K. A. Monogarov, A. A. Bragin, I. V. Fomenkov and A. N. Pivkina, Thermochim. Acta, 2016, 631, 1–7 CrossRef CAS.
- S. Vyazovkin and C. A. Wight, J. Phys. Chem. A, 1997, 101, 7217–7221 CrossRef CAS.
- H. Matsunaga, H. Habu and A. Miyake, J. Therm. Anal. Calorim., 2014, 116, 1227–1232 CrossRef CAS.
- S. Löbbecke, H. H. Krause and A. Pfeil, Propellants, Explos., Pyrotech., 1997, 22, 184–188 CrossRef.
- J. C. Oxley, J. L. Smith, W. Zheng, E. Rogers and M. D. Coburn, J. Phys. Chem. A, 1997, 101, 5646–5652 CrossRef CAS.
- S. Vyazovkin, A. K. Burnham, J. M. Criado, L. A. Pérez-Maqueda, C. Popescu and N. Sbirrazzuoli, Thermochim. Acta, 2011, 520, 1–19 CrossRef CAS.
- N. Koga, Y. Goshi, S. Yamada and L. A. Pérez-Maqueda, J. Therm. Anal. Calorim., 2013, 111, 1463–1474 CrossRef CAS.
- S. Vyazovkin, K. Chrissafis, M. L. Di Lorenzo, N. Koga, M. Pijolat, B. Roduit, N. Sbirrazzuoli and J. J. Suñol, Thermochim. Acta, 2014, 590, 1–23 CrossRef CAS.
-
N. V. Muravyev, THINKS – thermokinetic software, Moscow, 2016. Results for ADN are available: http://https://muravyevnikita.shinyapps.io/AmmoniumDinitramide/ Search PubMed.
- H. L. Friedman, J. Polym. Sci., Part C: Polym. Symp., 1964, 6, 183–195 CrossRef.
- S. Vyazovkin, J. S. Clawson and C. A. Wight, Chem. Mater., 2001, 13, 960–966 CrossRef CAS.
- L. A. Pérez-Maqueda, J. M. Criado and P. E. Sánchez-Jiménez, J. Phys. Chem. A, 2006, 110, 12456–12462 CrossRef PubMed.
- J. Šesták and G. Berggren, Thermochim. Acta, 1971, 3, 1–12 CrossRef.
- J. Šesták, J. Therm. Anal., 1990, 36, 1997–2007 CrossRef.
- J. Šesták, J. Therm. Anal. Calorim., 2012, 110, 5–16 CrossRef.
-
T. V. Elzhov, K. M. Mullen, A.-N. Spiess and B. Bolker, minpack.lm: R Interface to the Levenberg–Marquardt Nonlinear Least-Squares Algorithm Found in MINPACK, Plus Support for Bounds, 2015 Search PubMed.
- P. D. Garn, J. Therm. Anal., 1975, 7, 475–478 CrossRef CAS.
- R. K. Agrawal, J. Therm. Anal., 1986, 31, 73–86 CrossRef CAS.
- N. Koga, Thermochim. Acta, 1994, 244, 1–20 CrossRef CAS.
- N. Koga and J. Šesták, Thermochim. Acta, 1991, 182, 201–208 CrossRef CAS.
- M. E. Brown and A. K. Galwey, Thermochim. Acta, 2002, 387, 173–183 CrossRef CAS.
- S. Vyazovkin and W. Linert, Int. Rev. Phys. Chem., 1995, 14, 355–369 CrossRef CAS.
- F. J. Gotor, J. M. Criado, J. Málek and N. Koga, J. Phys. Chem. A, 2000, 104, 10777–10782 CrossRef CAS.
- J. M. Criado, L. A. Pérez-Maqueda, F. J. Gotor, J. Málek and N. Koga, J. Therm. Anal. Calorim., 2003, 72, 901–906 CrossRef CAS.
- N. Koga and H. Tanaka, Thermochim. Acta, 1992, 209, 127–134 CrossRef CAS.
- I. Langmuir, Phys. Rev., 1913, 2, 329–342 CrossRef.
- N. Koga and H. Tanaka, J. Therm. Anal., 1993, 40, 1173–1179 CrossRef CAS.
- N. Koga and H. Tanaka, Thermochim. Acta, 1994, 240, 141–151 CrossRef CAS.
- I. Langmuir, Phys. Rev., 1918, 12, 368–370 CrossRef CAS.
- F. Barontini and V. Cozzani, Thermochim. Acta, 2007, 460, 15–21 CrossRef CAS.
- N. Koga, J. Šesták and J. Málek, Thermochim. Acta, 1991, 188, 333–336 CrossRef CAS.
- N. Koga and J. Šesták, J. Therm. Anal., 1991, 37, 1103–1108 CrossRef.
- S. V. Vyazovkin and A. I. Lesnikovich, Thermochim. Acta, 1990, 165, 11–15 CrossRef CAS.
- J. Málek and J. M. Criado, Thermochim. Acta, 1992, 203, 25–30 CrossRef.
- M. Yoshikawa, Y. Goshi, S. Yamada and N. Koga, J. Phys. Chem. B, 2014, 118, 11397–11405 CrossRef CAS PubMed.
- N. Kameno, S. Yamada, T. Amimoto, K. Amimoto, H. Ikeda and N. Koga, Polym. Degrad. Stab., 2016, 134, 284–295 CrossRef CAS.
- A. S. Tompa, Thermochim. Acta, 2000, 357–358, 177–193 CrossRef CAS.
-
J. Hommel and J.-F. Trubert, in Proceedings of the 33th International Annual Conference of the Fraunhofer ICT, Fraunhofer ICT, Pfinztal, 2002, pp. 10.1–10.17.
- A. I. Kazakov, Y. I. Rubtsov, G. B. Manelis and L. P. Andrienko, Russ. Chem. Bull., 1997, 46, 2015–2020 CrossRef CAS.
-
G. Santhosh, PhD thesis, Mahatma Gandhi University, India, 2005.
Footnote |
| † Electronic supplementary information (ESI) available: The ESI includes characterization of ADN powder; experimental TG–DSC curves used for kinetic calculation; discussion on the interpretation of the zero-order reaction model; results of the simplified kinetic modeling using fixed reaction types of F2.5 and F0; graphical representation of the kinetic compensation effect for the thermal decomposition of AN. See DOI: 10.1039/c6cp08218a |
|
| This journal is © the Owner Societies 2017 |
Click here to see how this site uses Cookies. View our privacy policy here.  Open Access Article
 *a,
Nobuyoshi
Koga
 b,
Dmitry B.
Meerov
a and
Alla N.
Pivkina
a


![[thin space (1/6-em)]](https://www.rsc.org/images/entities/char_2009.gif) A among those (Ea, A) data sets is evident, as shown in Fig. 12. The (Ea,1, A1) for the first reaction step determined by CKA and KDA lies on the linear regression line. The variation of (Ea,1, A1) caused by the introduction of the simplified F2.5 model for the first reaction step in KDA also occurs along the regression line. Besides such apparent KCE, the kinetic treatment of all the previous studies included in Fig. 12 was on the basis of simplified kinetic modeling that attempted to describe the multistep chemical process by a phenomenological single-step reaction characterized by a set of (Ea, A, f(α)). As is seen in Fig. 7 and 9, the (Ea,1, A1, f1(α1)) determined in this study reproduces the kinetic rate behavior of the first reaction step at an acceptable level depending on the appropriateness of f1(α1) employed to calculate (Ea,1, A1), but has a similar empirical meaning in this respect. When comparing the kinetic rate behavior of the first reaction step under different reaction conditions, the deviation of the actual rate behavior from F2.5 may change depending on the reaction conditions. Then the change in the deviation is reflected by the changes in (Ea,1, A1). Therefore, it must be noted that a single Ea,1 value does not predict the thermal stability and reactivity of the studied material, and the results can have practical significance when considered as a kinetic triplet (Ea,1, A1, f1(α1)).
A among those (Ea, A) data sets is evident, as shown in Fig. 12. The (Ea,1, A1) for the first reaction step determined by CKA and KDA lies on the linear regression line. The variation of (Ea,1, A1) caused by the introduction of the simplified F2.5 model for the first reaction step in KDA also occurs along the regression line. Besides such apparent KCE, the kinetic treatment of all the previous studies included in Fig. 12 was on the basis of simplified kinetic modeling that attempted to describe the multistep chemical process by a phenomenological single-step reaction characterized by a set of (Ea, A, f(α)). As is seen in Fig. 7 and 9, the (Ea,1, A1, f1(α1)) determined in this study reproduces the kinetic rate behavior of the first reaction step at an acceptable level depending on the appropriateness of f1(α1) employed to calculate (Ea,1, A1), but has a similar empirical meaning in this respect. When comparing the kinetic rate behavior of the first reaction step under different reaction conditions, the deviation of the actual rate behavior from F2.5 may change depending on the reaction conditions. Then the change in the deviation is reflected by the changes in (Ea,1, A1). Therefore, it must be noted that a single Ea,1 value does not predict the thermal stability and reactivity of the studied material, and the results can have practical significance when considered as a kinetic triplet (Ea,1, A1, f1(α1)).
![[thin space (1/6-em)]](https://www.rsc.org/images/entities/char_2009.gif) A) reported for the overall thermal decomposition of ADN26–28,35,67–70 and the correspondence of (Ea,1, ln
A) reported for the overall thermal decomposition of ADN26–28,35,67–70 and the correspondence of (Ea,1, ln![[thin space (1/6-em)]](https://www.rsc.org/images/entities/char_2009.gif) A1) values determined in this study for the first reaction step to the linear regression line.
A1) values determined in this study for the first reaction step to the linear regression line.


