
 Open Access Article
 This Open Access Article is licensed under a
 Creative Commons Attribution 3.0 Unported Licence
In situ studies of NO reduction by H2 over Pt using surface X-ray diffraction and transmission electron microscopy†
S. B.
Roobol‡
a,
W. G.
Onderwaater
ab,
M. A.
van Spronsen§
 a,
F.
Carla
b,
O.
Balmes¶
b,
V.
Navarro||
a,
S.
Vendelbo
c,
P. J.
Kooyman**
c,
C. F.
Elkjær
d,
S.
Helveg
d,
R.
Felici
b,
J. W. M.
Frenken††
a and
I. M. N.
Groot
*ae
a,
F.
Carla
b,
O.
Balmes¶
b,
V.
Navarro||
a,
S.
Vendelbo
c,
P. J.
Kooyman**
c,
C. F.
Elkjær
d,
S.
Helveg
d,
R.
Felici
b,
J. W. M.
Frenken††
a and
I. M. N.
Groot
*ae
aHuygens-Kamerlingh Onnes Laboratory, Leiden University, P.O. Box 9504, 2300 RA Leiden, The Netherlands
bEuropean Synchrotron Radiation Facility, BP 220, F-38043 Grenoble Cedex 9, France
cCatalysis Engineering, Chemical Engineering Department, Delft University of Technology, Julianalaan 136, 2628 BL Delft, The Netherlands
dHaldor Topsøe A/S, Haldor Topsøes Allé 1, DK-2800 Kgs. Lyngby, Denmark
eGorlaeus Laboratories, Leiden University, P. O. Box 9502, 2300 RA Leiden, The Netherlands. E-mail: i.m.n.groot@lic.leidenuniv.nl
First published on 7th March 2017
Abstract
In situ surface X-ray diffraction and transmission electron microscopy at 1 bar show massive material transport of platinum during high-temperature NO reduction with H2. A Pt(110) single-crystal surface shows a wide variety of surface reconstructions and extensive faceting of the surface. Pt nanoparticles change their morphology depending on the gas composition: They are faceted in hydrogen-rich environments, but are more spherical in NO-rich environments, indicating the formation of vicinal surfaces. We conclude that high coverage of NO combined with sufficient mobility of platinum surface atoms is the driving force for the formation of steps on both flat surfaces and nanoparticles. Since the steps that are introduced provide strongly coordinating adsorption sites with potential catalytic benefits, this may be of direct practical relevance for the performance of catalytic nanoparticles under high-pressure conditions.
1 Introduction
The catalytic conversion of nitrogen oxides (NOx) is one of the three processes taking place in the three-way car catalyst.1,2 The major pollutants of car exhausts are incompletely combusted hydrocarbons, CO, and NOx. The NOx is formed during the very high temperature (>1500 °C) combustion process, resulting in thermal fixation of the nitrogen in air forming NOx.3 The emission of NOx into the air, combined with sunlight, results in the formation of ozone, a major component of smog. It was estimated that by the year 2000, over 800 million tons of combined pollutants of hydrocarbons, CO, and NOx had been abated using automotive catalysts.4In an automotive catalyst, the following reduction reactions take place:
| 2NO + 2CO → N2 + 2CO2 | (1) |
| 2NO + 2H2 → N2 + 2H2O | (2) |
| NO + CxHy → CO2 + H2O + N2 (not balanced) | (3) |
Hydrogen is present in exhaust gas due to its production via cracking of hydrocarbons, via steam reforming of unburnt hydrocarbons, and via the water-gas shift reaction.
In this paper we discuss the reaction between NO and H2 over platinum, which is one of the components of an automotive catalyst. This reaction, however, has a very low selectivity on platinum,5 and the reactions leading to the formation of ammonia (NH3) and nitrous dioxide (N2O) are dominant. For application as a car catalyst these products need to be avoided, and typically rhodium is added to enhance selectivity towards N2 production.6
Many ultrahigh vacuum (UHV) studies have been performed on the NO/H2/Pt system. NO adsorbs molecularly on platinum surfaces with the nitrogen atom bound to the surface.7 The (100) surface binds NO more strongly than the (111) and (110) facets, and is also more active for dissociation of NO.8 On the (110) surface, NO lifts the missing-row reconstruction7 that is observed for clean surfaces under UHV conditions.9 The same was observed in high-pressure studies.10,11 NO preferentially adsorbs on the bridge sites at low coverage and moves to the top sites at higher coverage.12–14 Hydrogen dissociatively adsorbs on the bridge sites.15 On the (100) surface, co-adsorption of H2 and NO results in lifting of the quasi-hexagonal reconstruction of the clean surface, depending on NO coverage.16 In combination with the difference in turnover rate between the reconstructed and non-reconstructed surfaces, this can give rise to kinetic oscillations under certain conditions.17,18
Although UHV studies on heterogeneously catalyzed chemical reactions can be enlightening, these conditions differ significantly from those of practical catalysis. The reason for this discrepancy stems from the fact that most characterization techniques, suitable for obtaining accurate results at the atomic scale, cannot perform under the typical working conditions of industrial catalysis (i.e. high pressures and high temperatures). Nowadays, more and more examples are found where this “pressure gap” fundamentally changes the reaction mechanisms.19–24 Therefore, it is informative to study catalysis at higher pressures of 1 bar, but without compromising the sensitivity to the details on the atomic and molecular scale. In this paper, we use high-pressure surface X-ray diffraction (SXRD) to investigate NO reduction on Pt(110) under near-industrial conditions. This surface orientation of Pt easily reconstructs, and we have observed several new reconstructions under high-pressure conditions. Similar reconstructions have also been observed on this surface under high pressure using scanning tunneling microscopy (STM).10,11 In addition, after prolonged exposure to NO/H2 mixtures, the flat surface started faceting into vicinal orientations close to the (320) orientation. As many catalytic reactions take place predominantly on step sites, it is extremely relevant to understand when and how a catalyst could be forming steps actively. The mechanism for the step formation can be related to the surface stress of the Pt(110) surface,25 which is dramatically altered by the high coverage of adsorbed NO molecules due to their repulsive interaction,26 or to the adsorption energies of the adsorbates at different sites.27,28 The adsorbate-induced stress is a true “pressure gap” effect: The high NO coverage, combined with sufficient mobility of the metal atoms on the surface to reorder on this scale, can only be obtained under high-temperature, high-pressure conditions.
However, the difference between laboratory studies and chemical industry in terms of pressure and temperature is not the only gap in heterogeneous catalysis research. Also the nature of the catalyst used is very different. In academic studies the catalyst is often simplified to a model system, usually consisting of a single-crystal metal surface, as opposed to industrial catalysts, which generally consist of metal nanoparticles deposited on oxidic, nanoporous supports and are accompanied by additional elements such as promoters, fillers, and binders. This discrepancy is commonly known as the “materials gap”, although there also exist academic studies on technological catalysts.29–31 Two reasons exist for the use of highly simplified model systems such as single crystals. The first is that not all characterization techniques, suitable for investigating catalysis at the atomic level, are able to study metal nanoparticles. The second is that currently density functional theory is not suitable for the simulation of real nanoparticle surfaces. Due to the lack of symmetry in nanoparticles, periodic boundary conditions cannot be used, and therefore the number of electrons required to calculate the potential becomes increasingly large, making the simulation infeasible. Nevertheless, the next step bringing academic catalysis research closer to the reality of industrial catalysis, is to study metal nanoparticles. To investigate whether the surface restructuring that we observed on flat surfaces is actually relevant for real catalysis, we studied the same chemical reaction on platinum nanoparticles. For these studies, we used transmission electron microscopy (TEM) in combination with nanoreactors, specially designed for in situ catalysis studies.32–34 In general, the equilibrium shape of a nanoparticle is dictated by the relative free energies of all interfaces between the particle, the support, and the gas environment. We observed that initially faceted particles became more rounded under the influence of NO, i.e. the flat, low-index facets broke up into vicinal surfaces. The observation that Pt nanoparticles form vicinal surfaces when exposed to (near-)atmospheric pressures of NO corresponds well to our observation for a Pt(110) single-crystal surface under similar reaction conditions. Therefore, using two different characterization techniques for two types of model catalysts, but under similar reaction conditions, we are able to correlate the observations. We conclude that high coverage of NO combined with sufficient mobility of platinum surface atoms is the driving force for the formation of steps on both flat surfaces and nanoparticles. Since the steps that are introduced provide strongly coordinating adsorption sites with potential catalytic benefits, this may be of direct practical relevance for the performance of catalytic nanoparticles under high-pressure conditions.
2 Experimental
2.1 High-pressure surface X-ray diffraction
The surface X-ray diffraction (SXRD) experiments were performed at the ID03 beam line of the European Synchrotron Radiation Facility (ESRF) with 18 keV X-rays using the high-pressure SXRD flow reactor.35 This set-up allows ultrahigh vacuum (UHV) sample preparation followed by in situ high-pressure, high-temperature gas exposure, during SXRD or grazing-incidence small-angle X-ray scattering (GISAXS) experiments with simultaneous reactivity measurements via gas product analysis with a quadrupole mass spectrometer.The Pt(110) sample, which was spark cut and polished to 0.1° from the (110) plane (Surface Preparation Laboratory), was cleaned by repeated cycles of argon ion bombardment and annealing in UHV, resulting in a (1 × 3) missing-row36 reconstructed surface, exposing narrow (111) facets. The (1 × 3) structure could be stabilized by carbon segregated from the bulk,37 which was not removed completely during cleaning cycles as the sample was not annealed in oxygen.
During high-pressure exposure with a total pressure of 1 bar, the sample was heated at constant power, resulting in a temperature of 300–400 °C depending on the H2 and NO gas composition. At these temperatures, the ammonia production is high, with the ammonia signal in the mass spectrometer rising to values corresponding to tens of mbar in the reactor. Due to the low pumping speed for ammonia molecules, it was not possible to keep their partial pressures at a constant and low level throughout the experiment. Since these molecules also affected the leak rate of gas from the reactor to the mass spectrometer, and eventually completely inhibited the leak, their presence could not be monitored with any accuracy during the experiment. In addition, as the experiment progressed, the UHV pressure deteriorated, at some stage making it impossible to perform further sputter/anneal cycles to regain a clean sample.
2.2 High-pressure transmission electron microscopy
Our transmission electron microscopy (TEM) experiments have been performed using an FEI Titan microscope with an electron beam energy of 300 keV and an electron illumination of 300 e Å−2 s−1. To ensure that beam effects had only a minor role in the observations, nanoparticles that had not been monitored during the actual measurements were briefly sampled after exposure to the H2–NO–H2 cycles in an evacuated nanoreactor. For these nanoparticles the same shape changes were observed. The experiments have been performed using a surface micromachined nanoreactor.32,33 We have employed the latest generation of these devices, integrated on a single die.34 Full details are given in the ESI.† The nanoreactor is operated in a flow configuration, as used by Vendelbo et al.38 The present set-up is outlined in Fig. S2 of the ESI† and full details are given there.A platinum nanoparticle catalyst is prepared directly inside the nanoreactor by loading a solution of tetraamineplatinum nitrate (Pt(NH3)4(NO3)2) in water or ethanol, which is left to dry in air, followed by calcination and reduction38. In this process, the salt decomposes and the resulting Pt ions are reduced to a dispersion of platinum nanoparticles with sizes ranging from 5 to 50 nm, inhomogeneously distributed in clusters along the entire nanoreactor gas channel.
To analyze possible shape changes depending on different gas environments, we employ an automated image analysis method that uses a least-squares fit to extract the particle shape and determine its roundness. Further details and an illustration (Fig. S3) are given in the ESI.†
3 Results and discussion
3.1 Surface X-ray diffraction
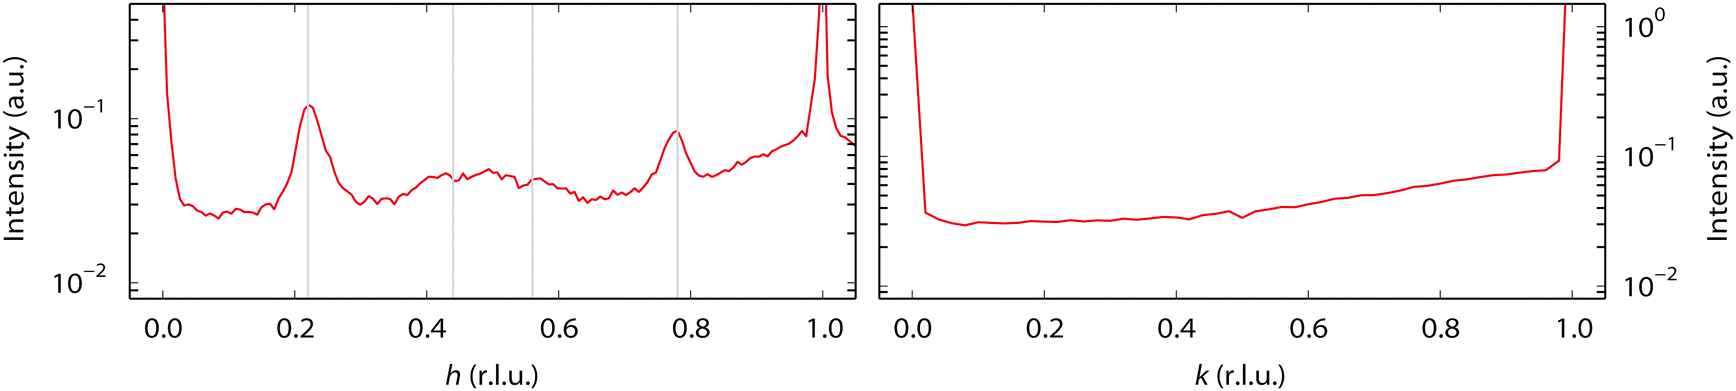
During our SXRD experiments, many different surface structures have been observed on the platinum surface depending on the conditions. These can be classified into two groups: surface reconstructions, requiring modest rearrangement of platinum atoms, and faceting, corresponding to massive material transport over the platinum surface.When the partial pressures of NO and H2 are varied, several reconstructions of the Pt(110) surface are observed at 1 bar total pressure between 300–400 °C. Fig. 1 shows an overview of the specific partial pressures and temperature conditions at which the various reconstructions were observed. The (1 × 3), (3 × 3), and (4 × 3) periodicities plus some variations are shown in Fig. 2. One reconstruction was observed at a lower surface temperature, i.e. the “0.22” reconstruction with reflections at 0.22 reciprocal lattice units (r.l.u.) along the k-direction, which was observed at approximately 100–150 °C (see Fig. 3). The faceting always coincided with the presence of the (in)commensurate (4 × 3) reconstruction and is analyzed in detail in Fig. 6 and 7.
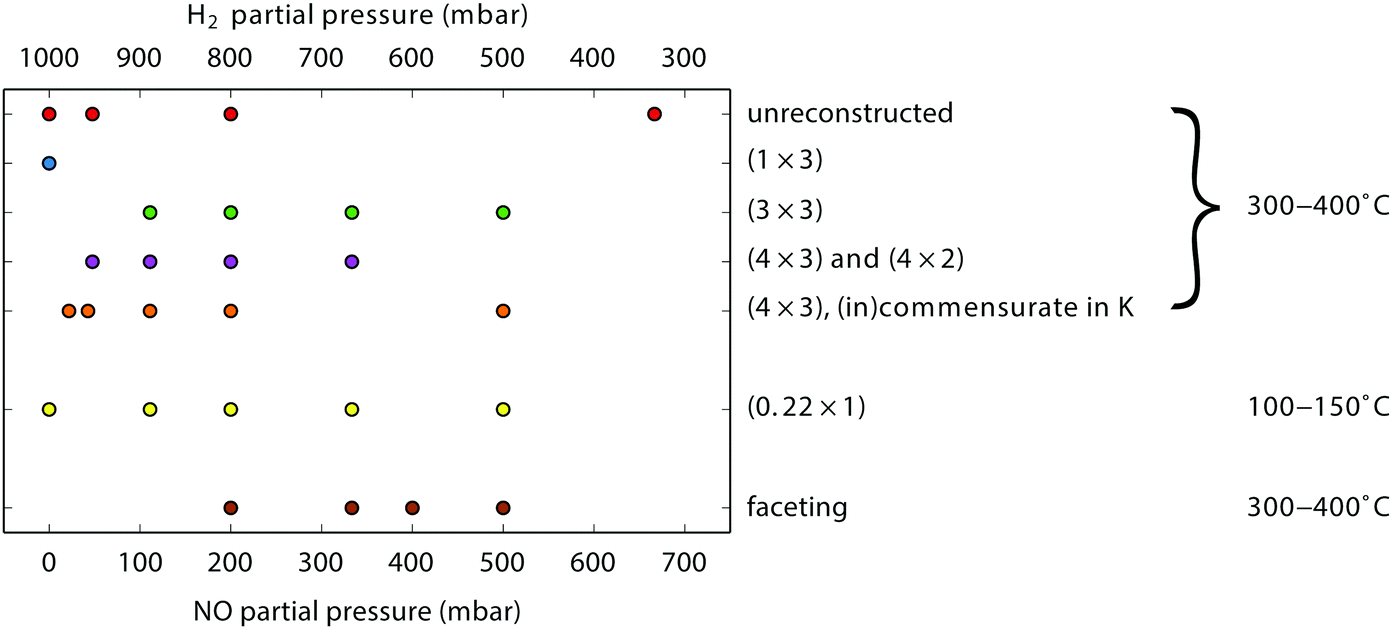 | ||
| Fig. 1 Observed reconstructions (periodicities) on Pt(110) as a function of gas composition (mixture of NO and H2 at 1 bar total pressure). The sample temperature was in the range 300–400 °C, except for the “0.22” reconstruction which was observed at approximately 100–150 °C. | ||
 | ||
| Fig. 2 Observed reconstructions of the Pt(110) single-crystal surface. See Fig. 1 for the conditions. The left-hand column shows scans along [h 0 0.5] in reciprocal lattice units (r.l.u.), the right-hand column along [−1 k 0.3]. The y-axes show intensity in arbitrary units. The solid vertical lines indicate the periodicity of the pattern. The lower right-hand panel shows an incommensurate periodicity (red) that becomes commensurate (4 × 3) with time (blue). The dotted vertical lines mark k = 0.25 and k = 0.75. | ||
 | ||
| Fig. 3 The “0.22” reconstruction observed at 100–150 °C. The left-hand panel contains a scan along [h 1 0.3], the right-hand panel along [−1 k 0.3]. There are reflections at 0.22 r.l.u. from the Bragg reflections along the h-direction, and a hint of the second order reflections as well, as indicated by the vertical lines in the left-hand panel. | ||
The (1 × 3) reconstruction observed in H2 is probably the same missing-row reconstruction as observed in vacuum on the freshly prepared sample, with periodicities in l similar to those reported for the (1 × 3) missing row reconstruction by Robinson and co-workers.37 However, none of the other reconstructions that we observe in this work have been identified before in UHV studies. The presence of such a variety of reconstructions can be explained taking into account the higher mobility of surface atoms at ambient pressure and the presence of adsorbed species, which under ambient pressure conditions may form different adsorbate structures. Some hypotheses on the origin of the structural complexity of the surface can be proposed considering similar systems.
A few (n × 2) and (n × 3) reconstructions of (110) surfaces, formed under the influence of adsorbates at low pressures, have been reported, however, they differ considerably in character from those observed in our experiments. The H-induced (5 × 2) structure on Ni(110) consists of a zigzag pattern formed by short (2 atoms long) alternating pairings of the atom rows.39 The O-induced c(6 × 2) structure on Cu(110) consists of a checkerboard-pattern of isolated copper atoms decorated by oxygen.40 In this structure, the occupancy of metal atoms in the two upper layers is much lower than in the unreconstructed surface and there are no closed-packed rows. Finally, two N-induced (2 × 3) structures on Cu(110) are of the missing-row type,41 one of every three atom rows missing in the upper layer. The latter two structures differ in the number and position of the nitrogen atoms in the (2 × 3) unit cell. Comparing the l-scans along the superstructure rods of the (3 × 3) reconstruction observed in our experiments (Fig. 4) with data from Robinson37 suggests that this is a variation on the (1 × 3) missing-row structure, with additional periodicity along the atom rows. The data, however, do not allow for speculation concerning the mechanism of formation of the observed reconstruction.
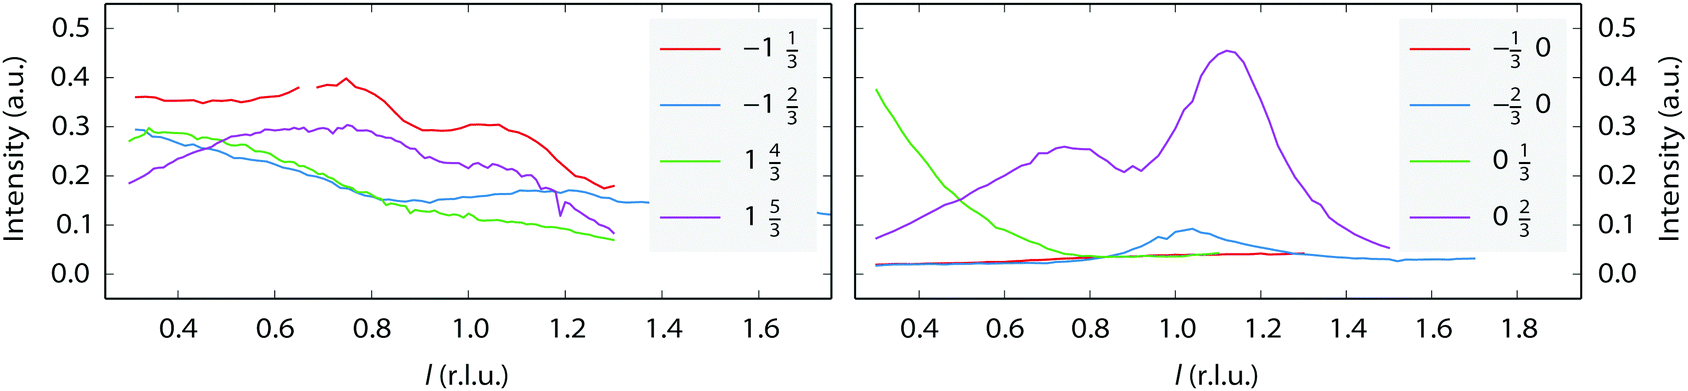 | ||
| Fig. 4 l-Scans along some superstructure rods. The legends show the h and k values of each scan. The left-hand panel shows the (1 × 3) reconstruction in UHV. The right-hand panel shows the (3 × 3) reconstruction in a mixture of 200 mbar NO and 800 mbar H2 at 320 °C. | ||
An incommensurate (4 × 3) structure was observed. However, the structure is not stable and it always transformed into a commensurate (4 × 3) structure over time. Thus, the presence of the incommensurate (4 × 3) structure is related to the speed of the transformation. The incommensurability could be due to mixtures of (4 × 4) and (4 × 3) structures. Similar effects have been reported for variable fractions of (1 × 2), (1 × 3), and (1 × 5) missing-row reconstructions on Pt(110) induced by C segregation42, and also for mixtures of (1 × 2) and (1 × 3) missing-row reconstructions of H- or Au-covered Pd surfaces.43,44 No l-scans have been obtained for the (4 × 3)-related structures. However, we suggest it could also be a variation on the (1 × 3) missing row. The “0.22” reconstruction, which is also incommensurate, seems to be completely different. It appears to be stable over time. Since the intensity of the l-scans (Fig. 5) strongly peaks at integer l values, meaning that the periodicity matches that of the bulk Pt lattice, this suggests that it derives from a significant restructuring of the Pt surface rather than an adsorbate overlayer pattern. However, a more detailed structure analysis has not been performed.
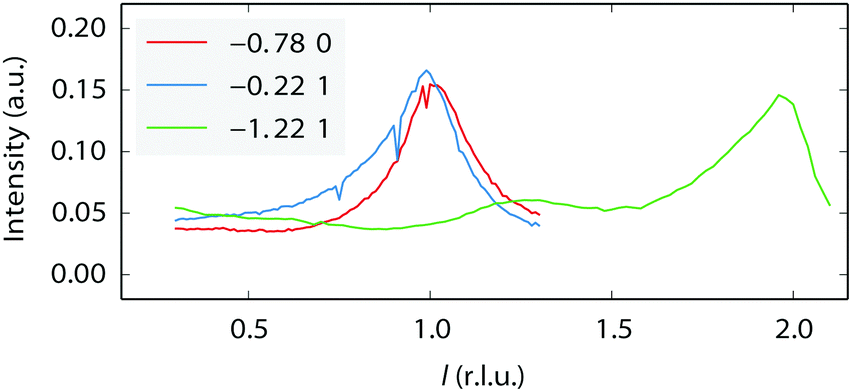 | ||
| Fig. 5 l-Scans along the superstructure rods for the “0.22” reconstruction, taken at 150 °C in pure NO at a total pressure of 200 mbar. The legend shows the h and k values of each scan. | ||
As Fig. 1 indicates, there is no clear separation between the different structures as a function of gas composition. For the clean Pt(110) surface it is known that the free energies of the various (1 × n) missing-row reconstructions are very similar,45 with the consequence that small changes in conditions (for example the presence of small amounts of adsorbates from the gas phase, or segregated impurities from the bulk, or roughness) can easily push the system from one phase into another. A similar mechanism could be at play for the variety of reconstructions observed here, under high-pressure, high-temperature conditions.
Near the end of the experiment, under conditions already probed before, the surface started faceting (see Fig. 1 for the conditions). This was observed by taking two-dimensional cuts perpendicular through a crystal truncation rod (CTR). A CTR is a scan along l connecting Bragg peaks of the crystal. Its shape is defined by the crystal termination, i.e. the precise configuration of atoms in the transition from the regular lattice in the crystal bulk to the dilute phase above it (vacuum or gas phase).46 The profile of a cut through the CTR contains information on the height variations of the surface. In our case, the two-dimensional cuts were constructed from a collection of continuous scans along the diffractometer angle ω47 that were stitched together using BINoculars.48 The cuts in Fig. 6 reveal the appearance of satellite reflections, whose distance to the main reflection is proportional to the distance Δl to the nearest Bragg reflection. In other words, the extra reflections correspond to extra CTRs, tilted with respect to the [110] normal of the average surface. Indeed, sufficiently well-defined facets will give rise to an extra set of tilted truncation rods through every Bragg reflection, as explained in Fig. S4 of the ESI.† The angle of these facet rods directly corresponds to that of the surface normal of the facet. The full width at half maximum (FWHM) gives a measure for the definition of the facet. The faceting angle was determined by a fitting procedure (see Fig. S5 of the ESI†) of which the combined results are shown in Fig. 7. The panels on the left represent fit parameters as a function of gas composition (NO and H2 mixtures at a total pressure of 1 bar), the panels on the right show the same parameters as a function of measurement number with the fractional gas composition indicated by the shades of gray in the background. The upper panels contain the angle of the surface normal of the facets and the corresponding terrace width (right-hand axis), which is calculated from the position of the satellite peaks. The central panels correspond to the full width at half maximum (FWHM) of the main rod, while the lower panels show the FWHM of the facet rods, both in reciprocal lattice units (r.l.u.). For the satellite peaks the FWHM has been converted into the apparent domain size (right-hand axis). This calculation is only valid in the unlikely case that no other effects contribute to the FWHM and must therefore be considered a lower bound for the domain size.
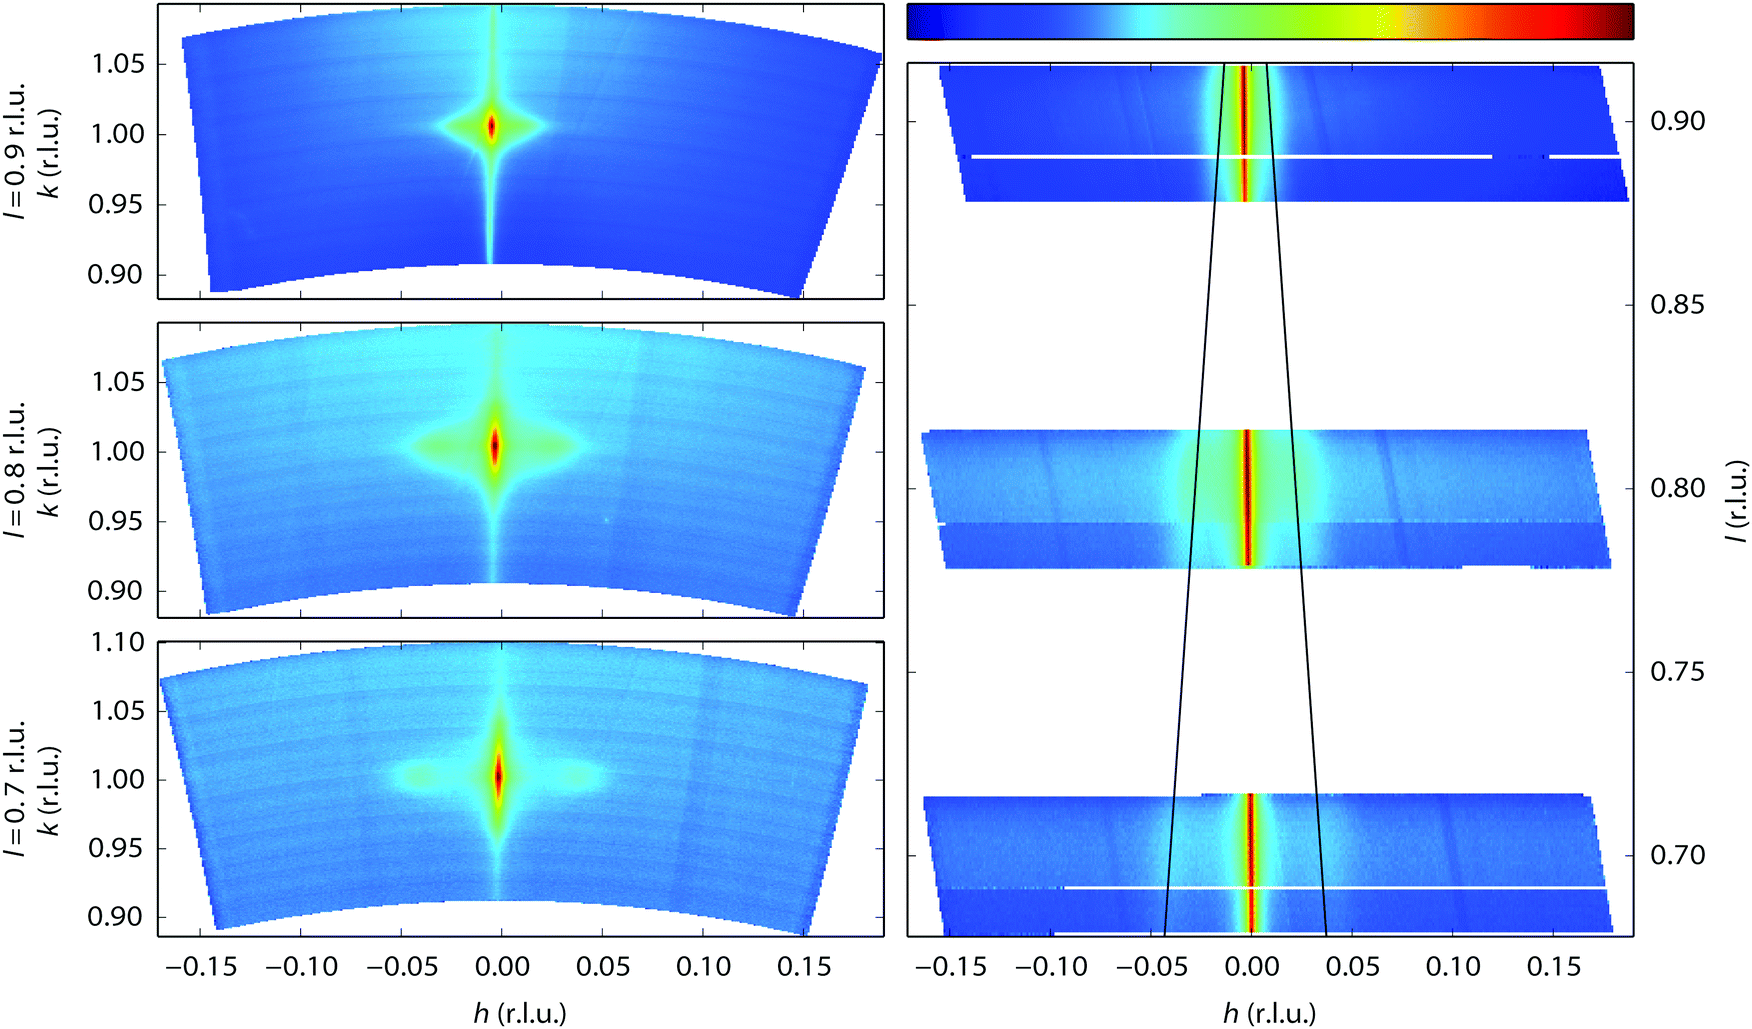 | ||
| Fig. 6 The left-hand panels show three (hk)-cuts at constant l, intersecting the (1 0 l) CTR at three values of l, obtained during exposure to a mixture of 400 mbar NO and 600 mbar H2 at 350 °C. The right-hand panel is a projection of a subset of these data onto the hl plane. The intensity ranges corresponding to the logarithmic color scale (shown above the right-hand panel) are for the left-hand panels, from top to bottom, [9.4 × 10⁻⁶, 1.7 × 10⁻¹], [3.0 × 10⁻⁶, 1.8 × 10⁻²], [2.6 × 10⁻⁶, 5.1 × 10⁻³], and for the right-hand panel, from top to bottom, [3.1 × 10⁻⁵, 2.4 × 10⁻²], [6.7 × 10⁻⁶, 4.4 × 10⁻³], [5.7 × 10⁻⁶, 1.9 × 10⁻³]. | ||
 | ||
| Fig. 7 Combined results of the fitting procedure described in Fig. S5 of the ESI.† The panels on the left represent fit parameters as a function of gas composition (NO and H2 mixtures at a total pressure of 1 bar), the panels on the right show the same parameters as a function of measurement number with the fractional gas composition indicated by the shades of gray in the background. | ||
The facets are tilted by 8 to 12 degrees away from the (110) surface in the [![[1 with combining macron]](https://www.rsc.org/images/entities/char_0031_0304.gif) 10] direction. The facet angle seems to be negatively correlated to the NO partial pressure, with higher NO pressures resulting in smaller angles. Fig. 7 also suggests that not all data points have been obtained with the system in equilibrium. Especially for NO partial pressures above 300 mbar, the right panels indicate the response to be slow, on the time scale of the measurements. The FWHM of the CTR is a measure for the roughness of the crystal surface, and this shows, as expected, a clear correlation with the faceting angle. After setting the experimental conditions, the FWHM of the facet rods did not immediately reach a constant value. It took approximately four hours for the system to reach a stable state, indicating that the facets were growing in average size.
10] direction. The facet angle seems to be negatively correlated to the NO partial pressure, with higher NO pressures resulting in smaller angles. Fig. 7 also suggests that not all data points have been obtained with the system in equilibrium. Especially for NO partial pressures above 300 mbar, the right panels indicate the response to be slow, on the time scale of the measurements. The FWHM of the CTR is a measure for the roughness of the crystal surface, and this shows, as expected, a clear correlation with the faceting angle. After setting the experimental conditions, the FWHM of the facet rods did not immediately reach a constant value. It took approximately four hours for the system to reach a stable state, indicating that the facets were growing in average size.
The tilt of approximately 10° implies that the facets typically have the (320) structure (see Fig. S6 of the ESI†), a crystal plane that makes an 11.3° angle with the (110) plane. The higher index orientations (430) and (540), having a structure similar to (320) but with 4 and 5 atoms per terrace and tilts of 8.1 and 6.3°, respectively, are likely to be present as well, especially at higher NO pressures.
Faceting of the Pt(110) into mainly (320) has been observed with CO and O2 exposure in the 10−4 mbar regime.49,50 In this case, the presence of both reactants is required to create the facets. The mechanism is suggested to be related to the strong binding of oxygen on step sites, and to material transport induced by switching between the (1 × 2) missing-row reconstruction and the unreconstructed surface due to CO coverage fluctuations. The reactivity of the (320) plane is higher than that of the (110) plane and under some conditions this gives rise to kinetic oscillations.51
In the case of NO and H2 exposure, a comparable mechanism could be responsible for the faceting, causing the free energy of the (320) and similar orientations to reach a lower value than the free energy of the (110) surface. As in the case of CO and O2 exposure, it could be due to an adsorbate binding strongly to the steps, and in this case NO, H2O, NH3, or atomic oxygen are likely candidates.
However, another aspect in the relative surface free energy of these different surfaces could be the adsorbate-induced stress. This is supported by preliminary DFT calculations by Reuter and co-workers.26 They show that the surface stress of a Pt(110) surface is dramatically influenced by adsorbed NO molecules due to the strong repulsive interaction between NO molecules at higher coverages. The surface stress in the [10]-direction changes from 3.0 N m−1 (tensile) for the clean surface to −3.0 N m−1 (compressive) for a 1 ML coverage of NO. The change along the [001]-direction is less dramatic, the surface stress being −0.2 N m−1 for the clean surface and 1.4 N m−1 for the NO-covered surface. Within the accuracy of the DFT calculations, the chemical potential required for 1 ML NO coverage matches that of the high-pressure, high-temperature NO exposure described in this work. The faceting in the [10]-direction could be a way for the surface to cope with a large change in surface stress in this direction, as is also observed by Hanesch and co-workers.25 They report morphology changes on mesoscopic length scales of Pt(110) surfaces induced by surface stress. Adsorbate-induced surface stress has been measured on Ni surfaces, in particular for CO on Ni(100) and (111),52 and for various atomic species on Ni(100).53 Given the fact that the DFT calculations show a large change in stress in the direction where the faceting occurs, we suggest that the NO-induced surface stress could be important to explain the faceting, in addition to the enhanced adsorption at steps.27,28
3.2 Transmission electron microscopy
Fig. 8–10 show an ensemble of Pt particles that we followed during its first exposure to NO after sample preparation. In Fig. 8, three particles, indicated with red, blue and green rectangles, are analyzed in more detail in Fig. 10. When scrutinizing these images, sintering is observed to take place between the first and second panels (purple rectangle), which is shown in more detail in Fig. 9. All experiments were performed with an electron beam energy of 300 keV and an electron illumination of 300 e Å−2 s−1. Starting from 1 bar pure H2 at 150 °C, the inlet gas composition was first changed to NO. As explained in Section 2.2, the low refresh rate of the gas in the capillary leading to the nanoreactor inlet translated to a gas composition change in the reactor starting after a delay of 2 minutes and with a transition time of another 2 minutes. Two dramatic effects are immediately visible in the TEM images. The number of nanoparticles has decreased and the remaining particles have become rounded in the NO atmosphere.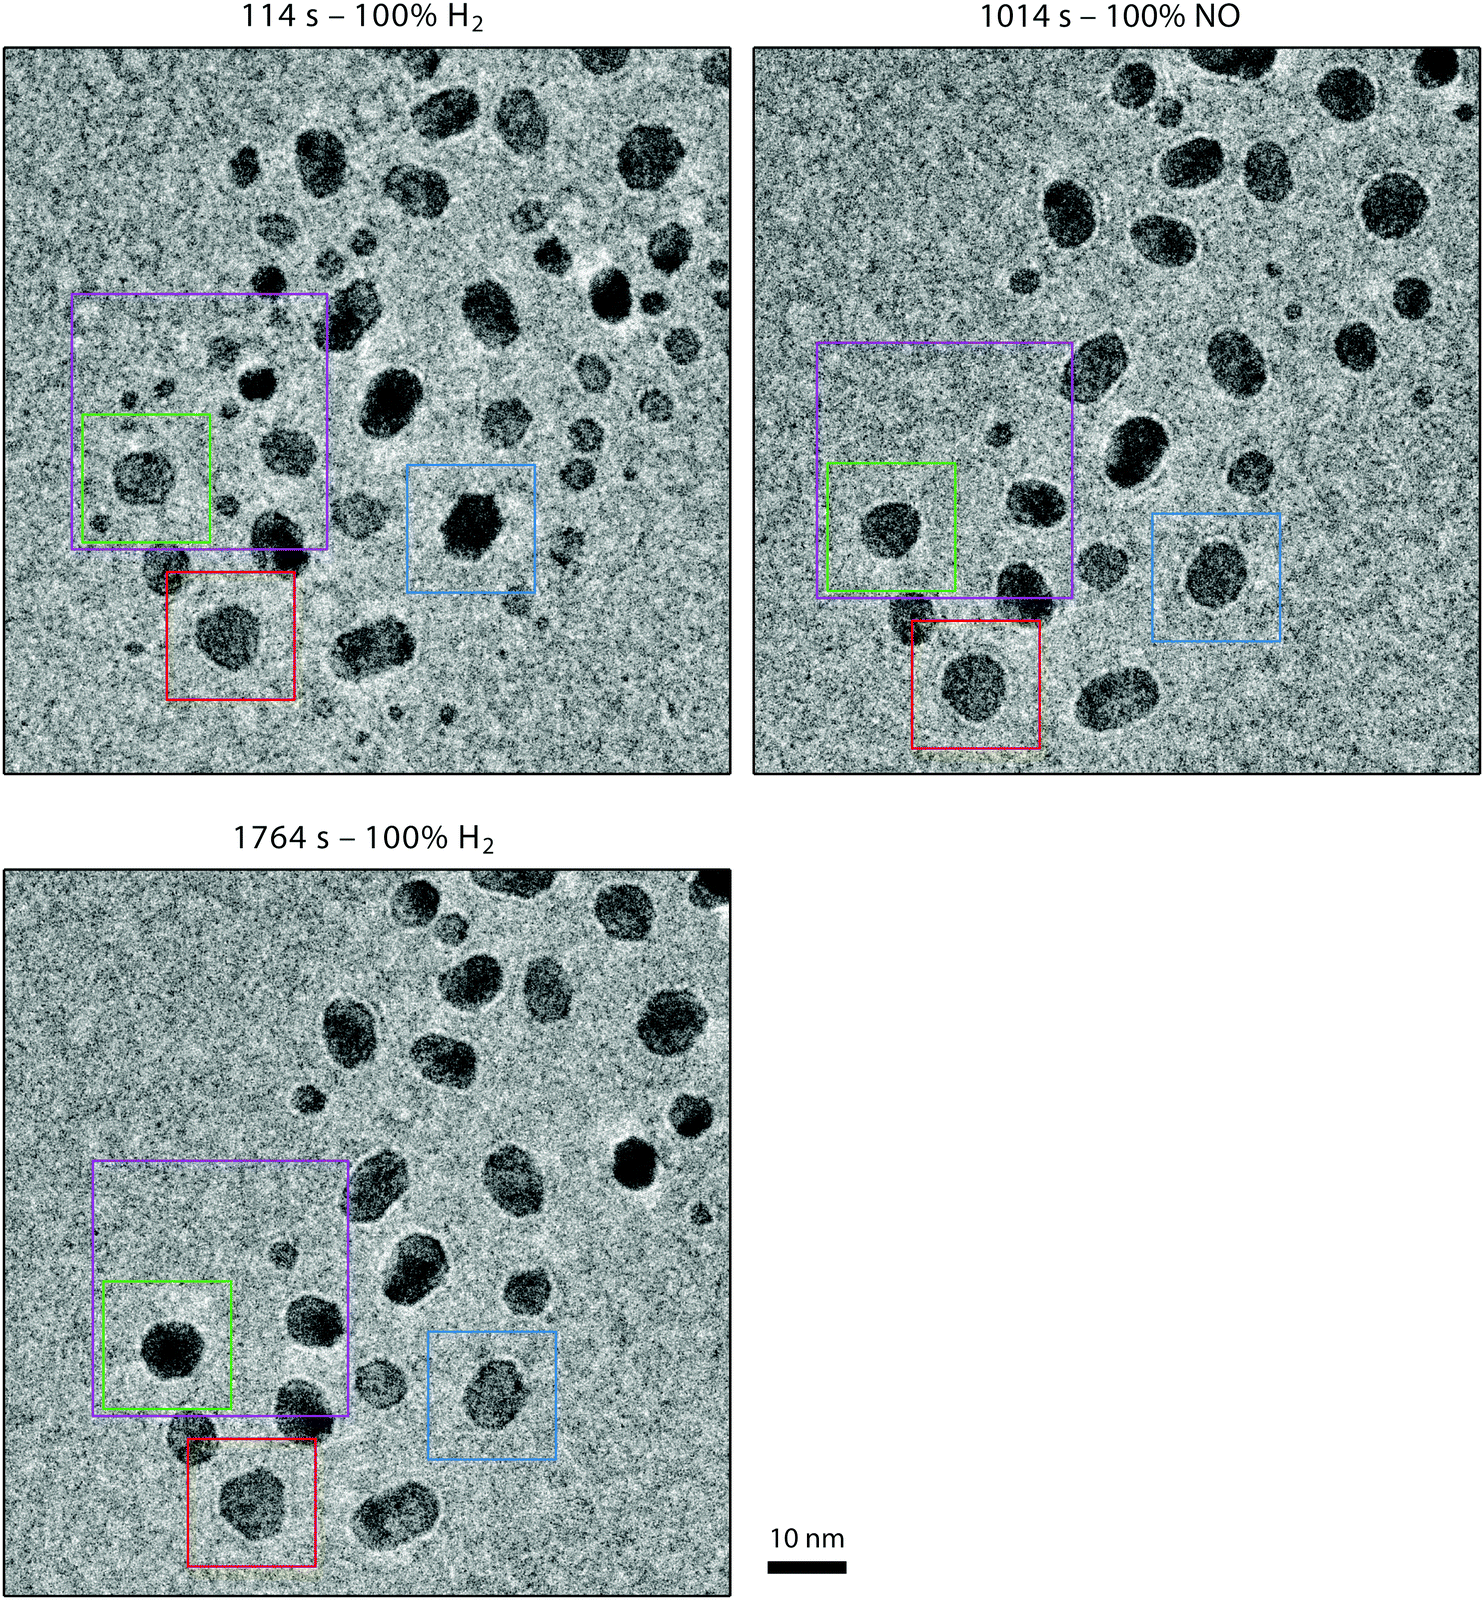 | ||
| Fig. 8 Shape variations of Pt particles while the gas composition was varied from pure H2 (upper left panel) to pure NO (right panel) and back (lower panel), at 1 bar and 150 °C. An ensemble of particles has been imaged every 3 seconds with an acquisition time of 1 second per frame. The size of the images is 92 × 92 nm2. | ||
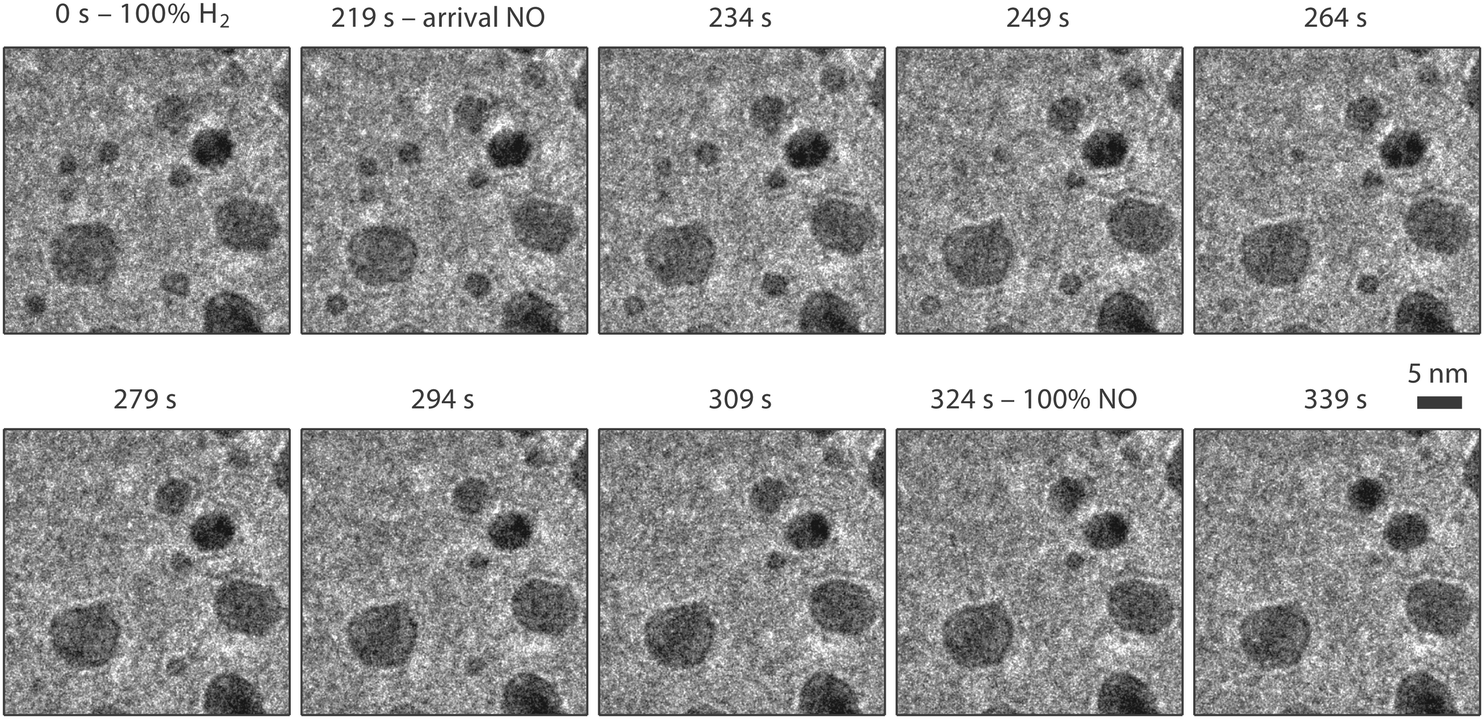 | ||
| Fig. 9 Close-up of the sintering process. The images correspond to 32 × 32 nm2 cutouts of the larger images, such as those in Fig. 8. | ||
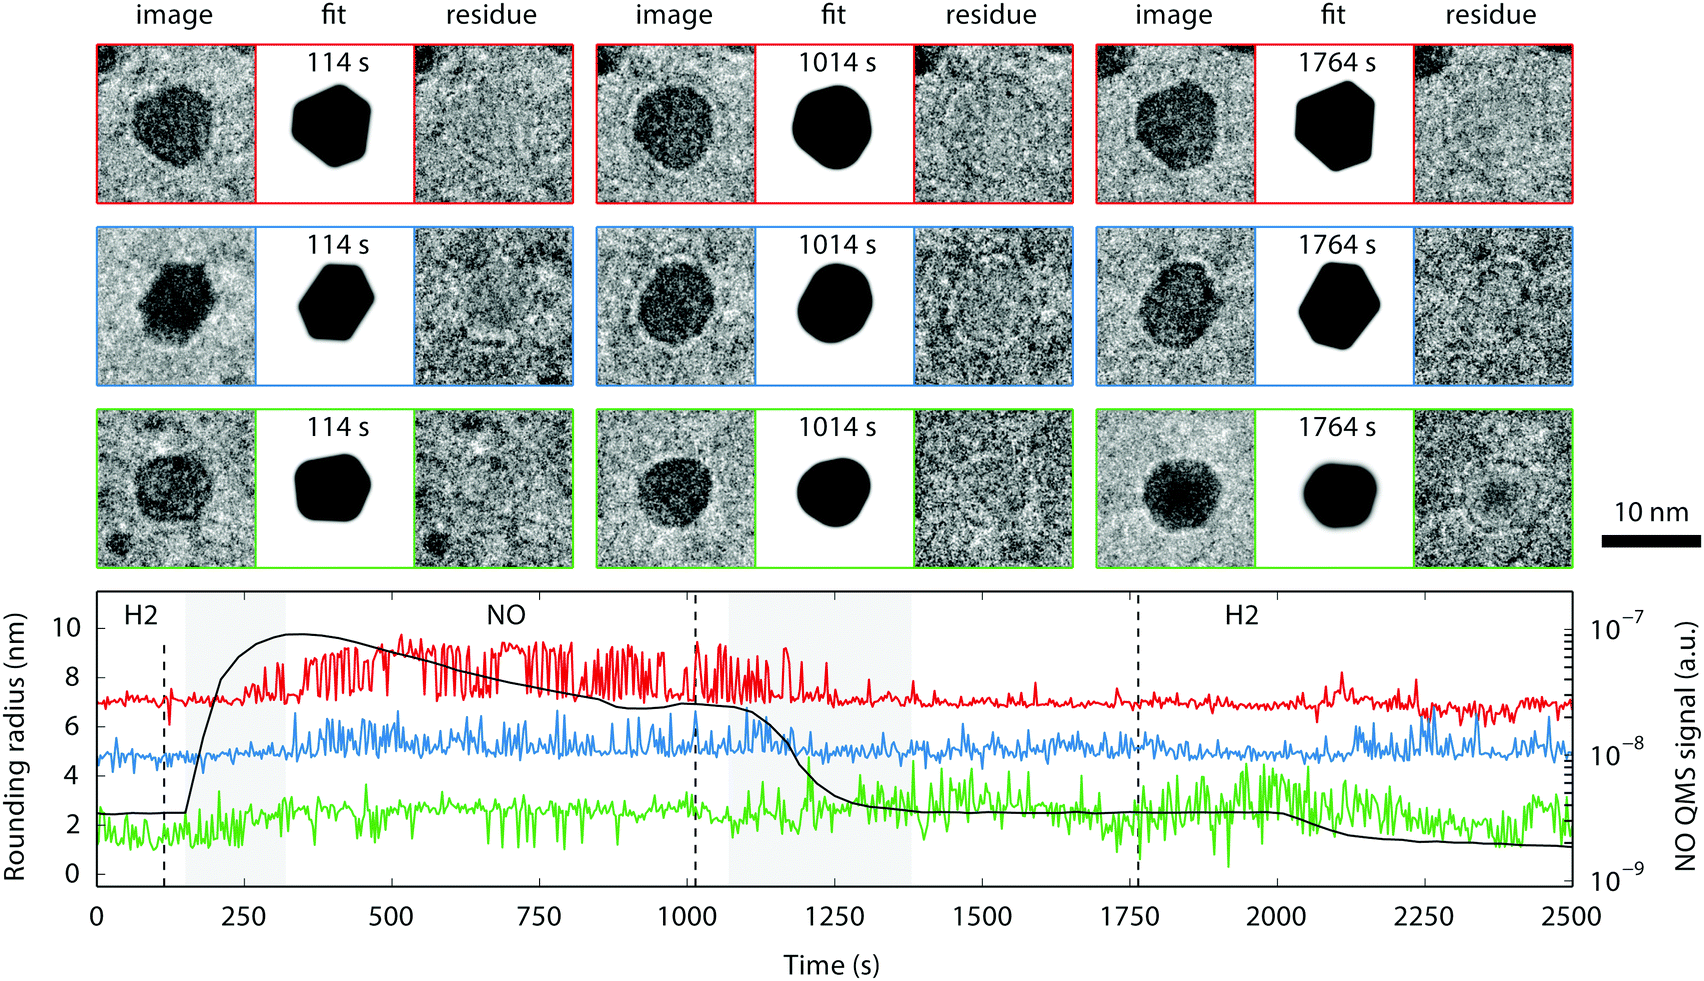 | ||
| Fig. 10 Three particles from the ensemble of Fig. 8 that have been analyzed with the fitting procedure (upper panel/red, middle panel/blue, and lower panel/green), each image corresponds to 16 × 16 nm2. The graph in the lower panel shows the rounding radius of the corners, as determined by the fit (offset from zero by 6 and 4 nm for red and blue, respectively). This figure is an enhanced version of a figure made using Spacetime. | ||
The number of Pt particles started decreasing as soon as the NO partial pressure in the reactor was increasing (Fig. 9) at a temperature of 150 °C. The initial hydrogen atmosphere did not result in any noticeable evolution, but once the NO partial pressure started increasing (from t = 219 s), the particles changed in size.
The TEM images obtained during the next two minutes show that small particles were shrinking and eventually disappearing on a time scale of tens of seconds, and that the larger particles maintained a constant projected size and shape. This dynamic behavior points towards a ripening process in which the larger particles accommodate the platinum from the smaller particles. This is insufficient to cause a detectable size increase for the larger particles, indicating Ostwald ripening. The dramatic increase of the ripening rate of Pt particles induced by NO has been reported by Lööf and co-workers.54 They found that the effect of NO is stronger than that observed for O2, which already enhanced the ripening compared to H2 and Ar. They suggest that an NO-containing Pt complex is the mobile species responsible for the fast ripening. If beam effects would have contributed to the observed sintering, that sintering would have occurred already during the first 219 s of imaging in hydrogen.
The second effect observed in the experiment is the reversible change in the particle shape depending on the gas composition, an effect that has been observed before for nanoparticles in a gas environment.29,55–60 This effect could be reproduced repeatedly in two different nanoreactors loaded with Pt particles. In order to substantiate our visual impression of systematic variations in particle shape with gas composition, we have quantitatively analyzed the shapes of some of the larger particles in the ensemble using the fitting procedure described in Section 2.2 and in the ESI.†Fig. 10 shows the result. The lower panel displays the best-fit values of the corner rounding radius as function of time, as determined by the fit (offset from zero by 6 and 4 nm for red and blue, respectively). The gas composition is indicated by the labels and the black curve in the lower panel; the two gray sections correspond to transitions from one gas to another. Note that the sensitivity of the quadrupole mass spectrometer (QMS) to NO reduced in time, due to the gain of the electron multiplier being affected by the gas in the QMS chamber.
For each particle, the raw data, the fit as determined by the least-squares optimization and the residue (raw image minus fit) are shown at three different points in time, corresponding to the vertical dashed lines in the graph. The model does not incorporate the Fresnel scattering on the edges of the particles and this causes the boundaries of the particles to remain visible in the residue. Although the data obtained for the rounding radius are noisy, a correlation with the NO partial pressure is visible. There are two reasons for the noise in these data. One is the low contrast between particle and background, resulting from the necessity to work with a low electron dose. The other is the spatial inhomogeneity of the amorphous SiN nanoreactor windows, which adds an amorphous component to the background. As a result, the fitting procedure did not always converge reliably. For some parameters, especially the rounding radius, the final value strongly depends on the initial values. The binary character of the rounding radius is caused by the upper limit of the rounding radius (approximately the particle radius) that was enforced by the fitting procedure.
Higher NO pressures correspond to more rounded particles and higher H2 pressures correspond to more facetted particles. To the best of our knowledge, the morphology of platinum nanoparticles exposed to atmospheric pressures of NO has not been studied before. However, morphology studies on Pt nanoparticles in a few mbars of H2 and O2 are available.61,62 Those studies invariably show that in H2 the Pt nanoparticles are faceted and in O2 they are more rounded. Our observations of the Pt nanoparticle morphology, although obtained at much higher pressures than what has been published so far, are in line with these previous mbar pressure results.
4 Conclusions
We investigated the NO reduction reaction on Pt catalysts under industrial conditions using in situ SXRD and in situ TEM. We observed structural changes of the surface induced by the presence of the gas-phase molecules. For both the flat Pt(110) single-crystal surface and for the more industrially-relevant nanoparticles, we observed the formation of vicinal surfaces due to the (near-)atmospheric pressure of NO and the elevated temperature. These reconstructions and the faceting can be caused by enhanced NO adsorption at the steps or by NO-induced surface stress. For the Pt(110) single-crystal surface, SXRD showed the appearance of a wide variety of surface reconstructions and extensive faceting of the surface (step formation). TEM observations showed a reversible change in the particle shape depending on the gas composition. The presence of NO induces a rounding of the nanoparticle shape, while the presence of H2 induces faceting of the Pt nanoparticles. The NO-induced rounding can be viewed as the nanoparticle analogue of the break-up of the Pt(110) surface into vicinal orientations. The mechanism that induces the formation of a high density of steps, could also be at play for other surface orientations, thus reducing the size of all facets and introducing the rounded corners on the nanoparticles. Since the steps that are introduced provide strongly coordinating adsorption sites with potential catalytic benefits, this may be of direct practical relevance for the performance of catalytic nanoparticles under high-pressure conditions.Acknowledgements
The staff of beamline ID03, ESRF, Grenoble, is gratefully acknowledged for their support during the beam time, in particular Thomas Dufrane and Helena Isern. This work is financially supported by NanoNextNL, a micro- and nanotechnology consortium of the Government of the Netherlands and 130 partners, and by a SmartMix grant and the NIMIC partner organizations through NIMIC, a public-private program. IMNG and VN acknowledge the support of STW, which is financially supported by the Netherlands Organization for Scientific Research (NWO), through a Veni grant.References
- R. M. Heck and R. J. Farrauto, Appl. Catal., A, 2001, 221, 443 CrossRef CAS.
- M. Shelef, Catal. Rev.: Sci. Eng., 1975, 11, 1 CAS.
- J. Zeldovich, Acta Physiochimica USSR, 1946, 21, 577 Search PubMed.
- R. M. Heck and R. J. Farrauto, Automotive Engineering, 1996, p. 93 Search PubMed.
- B. E. Nieuwenhuys, Adv. Catal., 1999, 44, 259 CAS.
- R. M. Heck and R. J. Farrauto, Catalytic Air Pollution Control, Wiley, New York, 2002 Search PubMed.
- C. M. Comrie, W. H. Weinberg and R. M. Lambert, Surf. Sci., 1976, 57, 619 CrossRef CAS.
- R. J. Gorte, L. D. Schmidt and J. L. Gland, Surf. Sci., 1981, 109, 367 CrossRef CAS.
- K. M. Ho and K. P. Bohnen, Phys. Rev. Lett., 1987, 59, 1833 CrossRef CAS PubMed.
- M. A. van Spronsen, G. J. C. van Baarle, C. T. Herbschleb, J. W. M. Frenken and I. M. N. Groot, Catal. Today, 2015, 244, 85 CrossRef CAS.
- M. A. van Spronsen, G. J. C. van Baarle, C. T. Herbschleb, J. W. M. Frenken and I. M. N. Groot, Catal. Today, 2015, 256, 384 CrossRef CAS.
- R. J. Gorte and J. L. Gland, Surf. Sci., 1981, 102, 348 CrossRef CAS.
- W. A. Brown, Q. Ge, R. K. Sharma and D. A. King, Chem. Phys. Lett., 1999, 299, 253 CrossRef CAS.
- W. A. Brown, R. K. Sharma and D. A. King, J. Phys. Chem. B, 1998, 102, 5303 CrossRef CAS.
- M. Minca, S. Penner, T. Loerting, A. Menzel, E. Bertel, R. Zucca and J. Redinger, Top. Catal., 2007, 46, 161 CrossRef CAS.
- P. Gardner, M. Tüshaus, R. Martin and A. M. Bradshaw, Surf. Sci., 1990, 240, 112 CrossRef CAS.
- J. Siera, P. Cobden, K. Tanaka and B. E. Nieuwenhuys, Catal. Lett., 1991, 10, 335 CrossRef CAS.
- A. G. Makeev and B. E. Nieuwenhuys, J. Chem. Phys., 1998, 108, 3740 CrossRef CAS.
- X. Su, P. S. Cremer, Y. R. Shen and G. A. Somorjai, J. Am. Chem. Soc., 1997, 119, 3994 CrossRef CAS.
- H. Over, Y. D. Kim, A. P. Seitsonen, S. Wendt, E. Lundgren, M. Schmid, P. Varga, A. Morgante and G. Ertl, Science, 2000, 287, 1474 CrossRef CAS PubMed.
- B. L. M. Hendriksen and J. W. M. Frenken, Phys. Rev. Lett., 2002, 89, 046101 CrossRef CAS PubMed.
- H. Over and M. Muhler, Prog. Surf. Sci., 2003, 72, 3 CrossRef CAS.
- M. D. Ackermann, T. M. Pedersen, B. L. M. Hendriksen, O. Robach, S. C. Bobaru, I. Popa, C. Quiros, H. Kim, B. Hammer and S. Ferrer, et al. , Phys. Rev. Lett., 2005, 95, 25505 CrossRef PubMed.
- R. Westerström, J. Gustafson, A. Resta, A. Mikkelsen, J. N. Andersen, E. Lundgren, N. Seriani, F. Mittendorfer, M. Schmid and J. Klikovits, et al. , Phys. Rev. B: Condens. Matter Mater. Phys., 2007, 76, 155410 CrossRef.
- P. Hanesch and E. Bertel, Phys. Rev. Lett., 1997, 79, 1523 CrossRef CAS.
- K. Reuter, personal communication.
- P. Thostrup, E. Christoffersen, H. T. Lorensen, K. W. Jacobsen, F. Besenbacher and J. K. Norskov, Phys. Rev. Lett., 2001, 87, 126102 CrossRef CAS PubMed.
- B. Hammer, J. Catal., 2001, 199, 171 CrossRef CAS.
- P. L. Gai, K. Yoshida, M. R. Ward, M. Walsh, R. T. Baker, L. van de Water, M. J. Watson and E. D. Boyes, Catal. Sci. Technol., 2016, 6, 2214 CAS.
- A. H. Janssen, A. J. Koster and K. P. de Jong, J. Phys. Chem. B, 2002, 106, 11905 CrossRef CAS.
- R. Burch, Phys. Chem. Chem. Phys., 2006, 8, 5483 RSC.
- J. F. Creemer, S. Helveg, G. H. Hoveling, S. Ullmann, A. M. Molenbroek, P. M. Sarro and H. W. Zandbergen, Ultramicroscopy, 2008, 108, 993 CrossRef CAS PubMed.
- J. F. Creemer, S. Helveg, P. J. Kooyman, A. M. Molenbroek, H. W. Zandbergen and P. M. Sarro, J. Microelectromech. Syst., 2010, 19, 254 CrossRef CAS.
- J. F. Creemer, F. Santagata, B. Morana, L. Mele, T. Alan, E. Iervolino, G. Pandraud and P. M. Sarro, Proceedings of the IEEE 24th International Conference on Micro Electro Mechanical Systems, 2011, p. 1103 Search PubMed.
- R. van Rijn, M. Ackermann, O. Balmes, T. Dufrane, A. Geluk, H. Gonzalez, H. Isern, E. de Kuyper, L. Petit and V. A. Sole, et al. , Rev. Sci. Instrum., 2010, 81, 014101 CrossRef CAS PubMed.
- P. Fery, W. Moritz and D. Wolf, Phys. Rev. B: Condens. Matter Mater. Phys., 1988, 38, 7275 CrossRef CAS.
- I. K. Robinson, P. J. Eng, C. Romainczyk and K. Kern, Phys. Rev. B: Condens. Matter Mater. Phys., 1993, 47, 1070 Search PubMed.
- S. B. Vendelbo, C. F. Elkjær, H. Falsig, I. Puspitasari, P. Dona, L. Mele, B. Morana, B. J. Nelissen, R. van Rijn and J. F. Creemer, et al. , Nat. Mater., 2014, 13, 884 CrossRef CAS PubMed.
- Y. Kuk, P. J. Silverman and H. Q. Nguyen, Phys. Rev. Lett., 1987, 59, 1452 CrossRef CAS PubMed.
- R. Feidenhans'l, F. Grey, R. L. Johnson and M. Nielsen, Phys. Rev. B: Condens. Matter Mater. Phys., 1991, 44, 1875 CrossRef.
- F. M. Leibsle, R. Davis and A. W. Robinson, Phys. Rev. B: Condens. Matter Mater. Phys., 1994, 49, 8290 CrossRef CAS.
- I. K. Robinson, P. J. Eng, C. Romainczyk and K. Kern, Surf. Sci., 1996, 367, 105 CrossRef CAS.
- E. Kampshoff, N. Waelchli, A. Menck and K. Kern, Surf. Sci., 1996, 360, 55 CrossRef CAS.
- P. J. Schmitz, W. Leung, H. C. Kang and P. A. Thiel, Phys. Rev. B: Condens. Matter Mater. Phys., 1991, 43, 8834 CrossRef CAS.
- S. M. Foiles, Surf. Sci. Lett., 1987, 191, L779 CAS.
- R. Feidenhans'l, Surf. Sci. Rep., 1989, 10, 105 CrossRef.
- E. Vlieg, J. Appl. Crystallogr., 1997, 30, 532 CrossRef CAS.
- S. B. Roobol, W. G. Onderwaater, J. Drnec, R. Felici and J. W. M. Frenken, J. Appl. Crystallogr., 2015, 48, 1324 CrossRef CAS PubMed.
- S. Ladas, R. Imbihl and G. Ertl, Surf. Sci., 1988, 197, 153 CrossRef CAS.
- M. Sander and R. Imbihl, Surf. Sci., 1991, 255, 61 CrossRef CAS.
- S. Ladas, R. Imbihl and G. Ertl, Surf. Sci., 1988, 198, 42 CrossRef CAS.
- A. Grossmann, W. Erley and H. Ibach, Surf. Sci., 1994, 313, 209 CrossRef CAS.
- D. Sander, U. Linke and H. Ibach, Surf. Sci., 1992, 272, 318 CrossRef CAS.
- P. Lööf, B. Stenbom, H. Norden and B. Kasemo, J. Catal., 1993, 144, 60 CrossRef.
- R.-J. Liu, P. A. Crozier, C. M. Smith, D. A. Hucul, J. Blackson and G. Salaita, Microsc. Microanal., 2004, 10, 77 CrossRef CAS PubMed.
- P. L. Gai, E. D. Boyes, S. Helveg, P. L. Hansen, S. Giorgio and C. R. Henry, MRS Bull., 2007, 32, 1044 CrossRef CAS.
- E. D. Boyes, M. R. Ward, L. Lari and P. L. Gai, Ann. Phys., 2013, 525, 423 CrossRef CAS.
- K. M. Bratlie, H. Lee, K. Komvopoulos, P. Yang and G. A. Somorjai, Nano Lett., 2007, 7, 3097 CrossRef CAS PubMed.
- E. Boyes and P. Gai, Ultramicroscopy, 1997, 67, 219 CrossRef CAS.
- S. Chenna, R. Banerjee and P. A. Crozier, ChemCatChem, 2011, 3, 1051 CrossRef CAS.
- M. Cabié, S. Giorgio, C. R. Henry, M. R. Axet, K. Philippot and B. Chaudret, J. Phys. Chem. C, 2010, 114, 2160 Search PubMed.
- F. Behafarid, S. Pandey, R. Diaz, E. A. Stach and B. R. Cuenya, Phys. Chem. Chem. Phys., 2014, 16, 18176 RSC.
Footnotes |
| † Electronic supplementary information (ESI) available. See DOI: 10.1039/c6cp08041c |
| ‡ Current address: ASML Netherlands B.V., De Run 6501, 5504 DR, Veldhoven, The Netherlands. |
| § Current address: Department of Chemistry and Chemical Biology, Harvard University, Cambridge, Massachusetts 02138, USA. |
| ¶ Current address: MAX IV Laboratory, S-22594 Lund, Sweden. |
| || Current address: TNO, P.O. Box 155, 2600 AD Delft, The Netherlands. |
| ** Current address: Department of Chemical Engineering, University of Cape Town, Private Bag X3, Rondebosch 7701, South Africa. |
| †† Current address: Advanced Research Center for Nanolithography, P.O. Box 93019, 1090 BA Amsterdam, The Netherlands. |
| This journal is © the Owner Societies 2017 |