Direct electron irradiation of DNA in a fully aqueous environment. Damage determination in combination with Monte Carlo simulations
Received
10th November 2016
, Accepted 14th December 2016
First published on 14th December 2016
1 Introduction
The understanding of the mechanisms of radiation causing damage to DNA is of uttermost importance for the development of new cancer therapies and effective radiosensitizers. It was believed for a long time that oxidizing hydroxyl radicals produced by ionizing radiation (e.g. gamma-, X-rays, UV-radiation) are the prevailing lethal species. However, over the last years experimental evidence was accumulated that the low energy electrons (LEEs)1 and prehydrated electrons2–4 can cause a significant, if not dominant amount of DNA damage. The LEEs are produced in a copious amount by high energy radiation, together with OH-radicals and ions.5,6 They can damage DNA directly by ionization or dissociative electron attachment (DEA).7 While traversing the liquid environment the LEEs undergo various inelastic scattering events before they reach a prehydrated state. From there they can damage DNA by a reductive mechanism via direct electron transfer (DET).3 For these prehydrated electrons some studies8 have come to the conclusion that the probability to induce a DNA strand break is twice as high as for an OH-radical. The mechanism is proposed whereby the de-excited electrons localize rapidly on solvated nucleobases due to their high electron affinity, causing subsequently electronic restructuring and finally strand breaks in DNA.9
However, the quantitative contributions of the various species, as well as the protecting or enhancing effects of the liquid10,11 are presently unresolved and under debate. This is mostly for the reason that the evidence in support of the LEE damage is largely based on electron irradiation of biomolecules in vacuo with low energy sources,12–14 under a humid atmosphere with X-rays on metallic surfaces15 or in liquid with two-photon processes as the primary radiation source.3,8 Other studies using linear accelerators to generate electrons in the MeV range focus on the production of multiple DSBs16,17 and are not concerned with disentanglement of the action of secondary species. In this work, we present a method for direct irradiation of biological samples in a fully aqueous environment with electrons as primary particles. This is achieved by using a sample holder incorporating a nanomembrane for the separation of the liquid sample and the vacuum of the electron microscope. Electrons as primary particles have the advantage that complex damage such as cyclobutyl pyrimidine dimers (intrastrand crosslinks), as induced by UV light,18,19 can be neglected. Furthermore, in contrast to the experiments with DNA deposited on surfaces, our irradiation set-up opens up the possibility to investigate the effects of changes in environmental parameters such as the pH value, salinity, and the presence of proteins or other biomolecules. In addition, the influence of surface–DNA and DNA–DNA interactions due to high surface coverages can be ruled out. In combination with Monte-Carlo simulations of electron–water scattering processes and DNA diffusion within the liquid, damage–dosage relations can be precisely determined. In particular, the irradiation of pUC19 plasmid DNA in water with electrons and the occurrence of SSBs and DSBs as a function of the microscopic energy deposit will be presented and discussed in this work.
2 Materials and methods
2.1 Experimental setup
2.1.1 Sample holder.
DNA samples were irradiated in aqueous solutions by electrons of well-defined primary energy within an environmental scanning electron microscope (ESEM). To make this possible, a sample holder incorporating a silicon chip (Fig. 1 part 1C) with a 100 nm thick Si3N4 membrane (Silson, UK) was developed. A drawing is displayed in Fig. 1. The membrane (0.5 × 0.5 mm) separates vacuum and liquid even at a pressure difference of 1 bar, but it is essentially transparent to high energy electrons of 30 keV as determined experimentally (92 ± 3% transmission). On the liquid side of the membrane, a 10 nm silicon dioxide layer exists which makes it also usable for experiments with surface attached biomolecules.13,20–23 The DNA sample holder (Fig. 1 part 1B) is made from a chemically inert material (Kel-F/polychlorotrifluoroethylene). It has an inner cylindrical shape container with a conical ending (radius = 1.6 mm and height = 1 mm) of about 4 μL volume. To provide the sealing, a Viton O-ring the outside of the Kel-F container (Fig. 1 part 1A) is used. This material can be autoclaved and cleaned by acids and ethanol to remove contamination. The outer parts (Fig. 1 part 1D and 1E) are made from brass to prevent charging or the induction of magnetic stray fields influencing the electron trajectories. To enclose the liquid, a screw is used to press the Kel-F container against the O-ring and the membrane, as displayed in part 5 of Fig. 1.
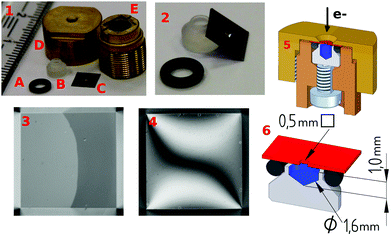 |
| | Fig. 1 Sample holder: (1) O-ring (A), Kel-F liquid container (B), silicon chip (5 × 5 mm) with a 100 nm thick Si3N4 membrane (0.5 × 0.5 mm) (C), outer cap (D) and under-part (E). (2) Magnified inner-parts of the setup: silicon chip, liquid container, Viton O-ring. Optical image of the nanomembrane of a mounted chip without (3) and with applied pressure (4). (5) Cut through the sample holder with the outer cap (yellow), O-ring (black), silicon chip with the nanomembrane (red), inner liquid container (gray), liquid (blue), the under-part (brown), and the pressure screw (silver). (6) Dimensions of the inner parts. | |
2.1.2 Sample preparation.
The plasmid (pUC19 with 2686 bp and mpUC19 = 2.9 × 10⁻²¹ kg) was isolated using a QIAprep Spin Miniprep Kit (Qiagen) from Escherichia coli TOP10 and eluted with ultrapure water (conductance 0.055 μS cm−1). The sample holder was cleaned by ethanol and autoclaved. A volume of 4 μL with a plasmid concentration of 50 ng μL−1 in ultrapure water was used for irradiation.
2.1.3 Irradiation procedure.
All irradiation experiments were performed within a FEI XL30 environmental scanning electron microscope (ESEM) with a LaB6 cathode. The samples were placed in the ESEM and irradiated at a pressure below 1 × 10⁻⁶ mbar. The irradiation was performed with a primary electron energy of 30 keV and SE-detector voltage of 0 V. The membrane was irradiated with an ESEM scan size of 350 × 265 μm2. Currents of 5.6–9.6 nA and irradiation times of 30–600 s were used. Before and after each irradiation the electron current was measured using a Faraday cup and a picoammeter (Keithley 6485). After irradiation, the samples were stored at 4 °C until they were analyzed by gel electrophoresis.
2.1.4 Damage determination.
The irradiated samples were analyzed by gel electrophoresis (50 ng per lane, 100 V, 40 min, 1% agarose gel and GelRed). Intensity profiles were extracted from the gel-images. After a linear background subtraction, a Gaussian multi-peak fit was performed using the Fityk software24 by a Levenberg–Marquardt algorithm. The undamaged plasmids exist in a topological constrained form and are supercoiled. After a single-strand break (SSB) occurs, energy gets released and they relax to a circular form. In the case of a double-strand break (DSB) the plasmids relax further to a linear conformation. Therefore, we distinguish between these three possible plasmid conformations: undamaged (supercoiled), SSB (circular) and DSB (linear), which are separated due to their different electrophoretic mobility within the gel. The results were normalized with respect to the total intensity of the respective gel-lane. The position of the band containing the linear conformation, which partly overlaps with the supercoiled band, was determined by comparison with lanes of plasmids linearized by the restriction enzyme HindIII.
2.2 Monte-Carlo simulations
2.2.1 Electron scattering simulations.
In water, electron energy deposit, electron energy spectra, ionization events and other inelastic scattering processes are difficult to measure due to the short inelastic mean free path of electrons. To understand the damaging processes in detail, this information has to be set in relation to the amount and types of damage measured in DNA. For that reason, Monte Carlo simulations (MCSs) of the scattering processes at the membrane and within water were performed. The Geant4 MCS framework (10.01.p01)25 together with the DNA-extension26 for the interaction of low energy particles in water was used. Simulations were performed for a system in vacuum with a 100 nm Si3N4-membrane and a surface layer of 10 nm SiO2 on the sample side as defined by the experiment. For this region the G4emPenelope models27 optimized for charged particles with energies below 1 GeV were used. The transmission of 30 keV electrons through the membrane without water was simulated and also measured using a Faraday cup. The experimental and simulated transmission (92 ± 3%) were found to be equal within the range of the measurement uncertainty. In order to investigate the energy deposit in the liquid sample further simulations were performed. Within the water region the optimized G4EmDNAPhysics models of the DNA-extension26 were applied. These were designed to simulate radiation induced damage to biomolecules in the sub-micrometer scale.28 During the simulation, the following processes for electron–water interaction were activated, the implementation is given in brackets: elastic scattering (Champion elastic model), electronic excitation (Born excitation model), ionization (Born ionisation model), vibrational excitation (Sanche excitation model) and electron attachment (Melton attachment model). From the simulations, it can be concluded that within our irradiation setup every primary electron (EKin0 = 30 keV) produces within its track on average 446 secondary electrons.
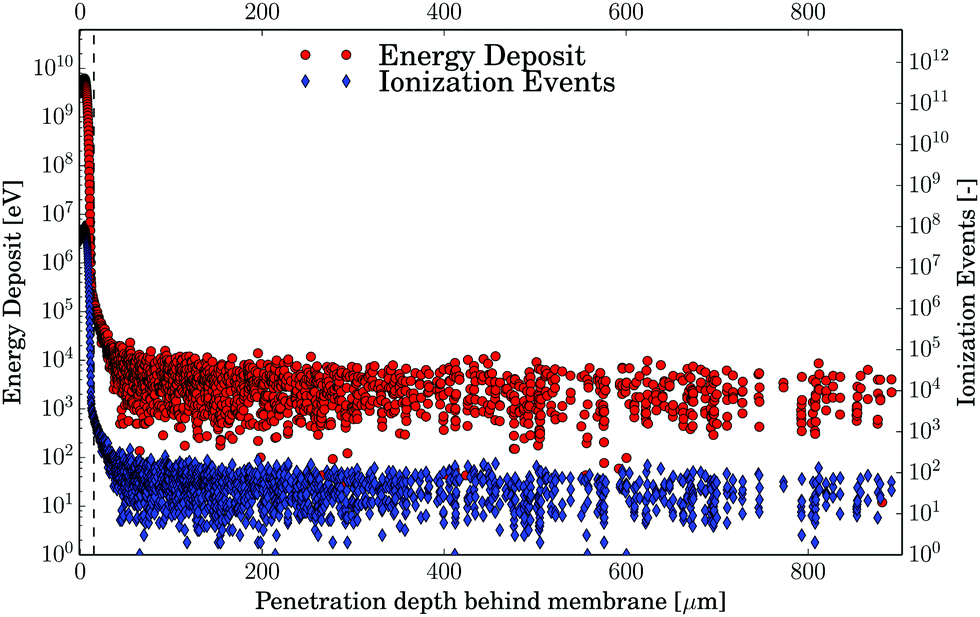
An important aspect of this work is the derivation of proper dosage–damage relationships. In order to achieve this, we have to define regions of different radiation exposure as described as follows. The first very narrow region, called the high intensity (HI) region comprises the first 12.5 μm of water directly behind the membrane where over 99.99% of the electron energy is deposited as shown in Fig. 2. The region beyond this up to the end of the sample holder at 1000 μm depth will be called the low-intensity (LI) region. The average energy deposited and the number of ionization events in the LI region are shown in Fig. 2, for 1 × 10⁷ simulated primary electrons (nsim) per bin of 132 nm in the z-direction (two times the gyration radius of the plasmid pUC1929). It is worth pointing out, that in the LI region the density of the ionization events and the energy deposit vary about only 1–2 orders of magnitude, compared to the 6–7 orders of magnitude in the HI region (Fig. 2). Within the LI region, the normalized kinetic energy distribution of the electrons is independent of the depth as shown in Fig. 3. There, we find about 40% of the electrons with kinetic energies in the range 20–40 eV, followed by about 25% in the range 0–20 eV, about 10% in the range 40–60 eV and less than 1% above 1 keV. The average energy of the electrons up to 1 keV is ∼50 eV. According to the simulations, the number of electron–water inelastic scattering events which dominate the production of secondary products within the LI region are ionization (93%) and excitation (6%). Attachment processes play a minor role (<1%) being confined to the electron energy range of (4–13) eV. This is due to the fact that most of the electrons have kinetic energies above 20 eV where ionization dominates the scattering events.6
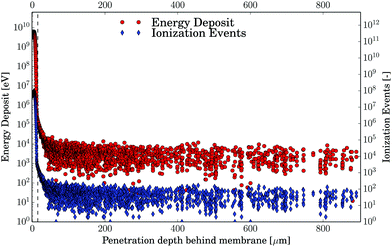 |
| | Fig. 2 The results of the Monte-Carlo-Simulations performed using Geant4-DNA for 1 × 10⁷ primary electrons with 30 keV. Energy deposit (red) and ionization events (blue) are displayed for a bin size that is two times the plasmid gyration radius, rg. Note the exponential scaling of the y-axis. | |
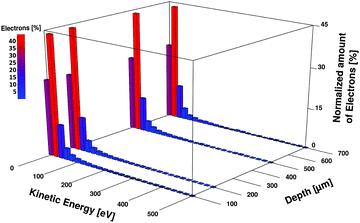 |
| | Fig. 3 Histogram of the simulated kinetic energy distribution (0–500 eV) of the electrons at 100 μm, 200 μm, 500 μm and 700 μm behind the nanomembrane. The normalized energy distributions are independent of the depth, with about 40% of the electrons with energies in the range of 20–40 eV, followed by about 25% in the range of 0–20 eV and about 10% in the range of 40–60 eV. Less than 1% of the electrons have energies in the keV range (not shown). | |
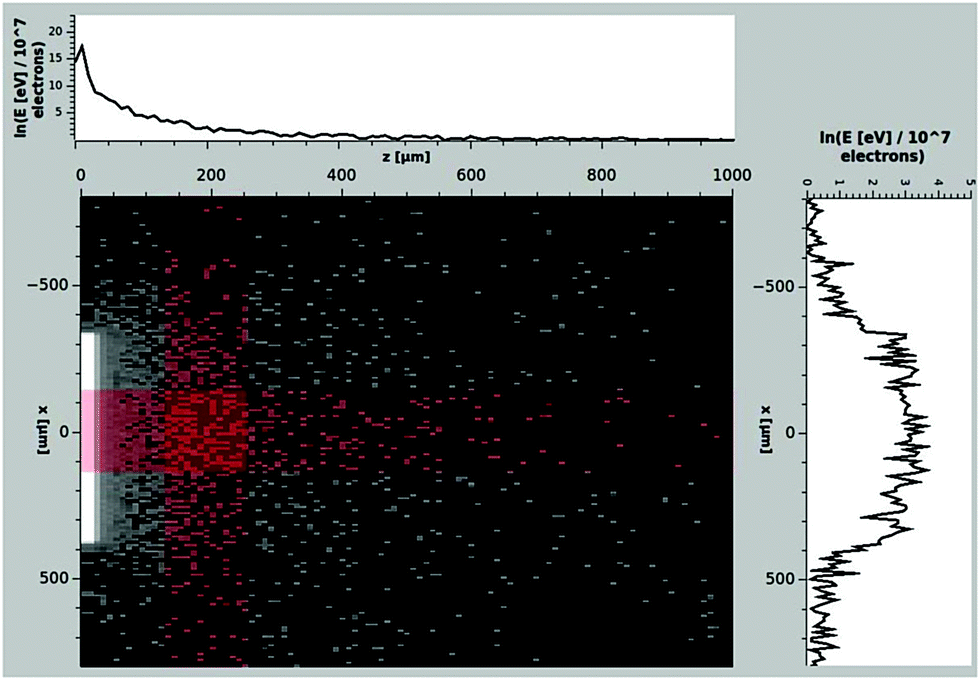
For the calculation of the dosage–damage relationship two other effects have to be addressed properly. The first one concerns the spreading of primary electrons due to scattering. This was simulated down to the validated limits of each scattering process below 11 eV26 for 1 × 10⁷ electrons of 30 kV energy impacting within the ESEM scan size of 350 × 265 μm2. The obtained data were projected onto the xz-plane as displayed in Fig. 4. From this, the beam broadening in the x and y directions, containing more than 99.9% of the events was found to be the ESEM scan size ±311μm. Therefore, we calculate the irradiated area projected onto the xy-plane as Airr = 0.863 mm2 which corresponds to the electron beam scan size plus electron beam broadening. The other effect concerns the DNA diffusion and is presented below.
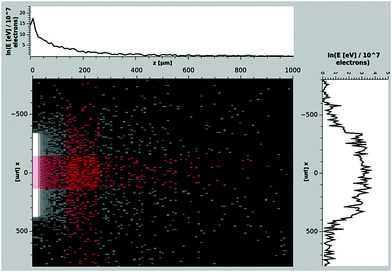 |
| | Fig. 4 Projection of the total energy deposit of 1 × 10⁷ primary electrons with 30 keV incident energy on the xz-plane in water behind the membrane. The projected data on the x- and z-axes are averaged over the region indicated by the red stripes. The initial position of the simulated electrons was chosen randomly between x = ±175 μm, y = ±132 μm and momentum perpendicular to the xy-plane. | |
2.2.2 Diffusion simulation.
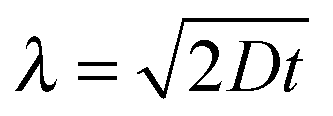
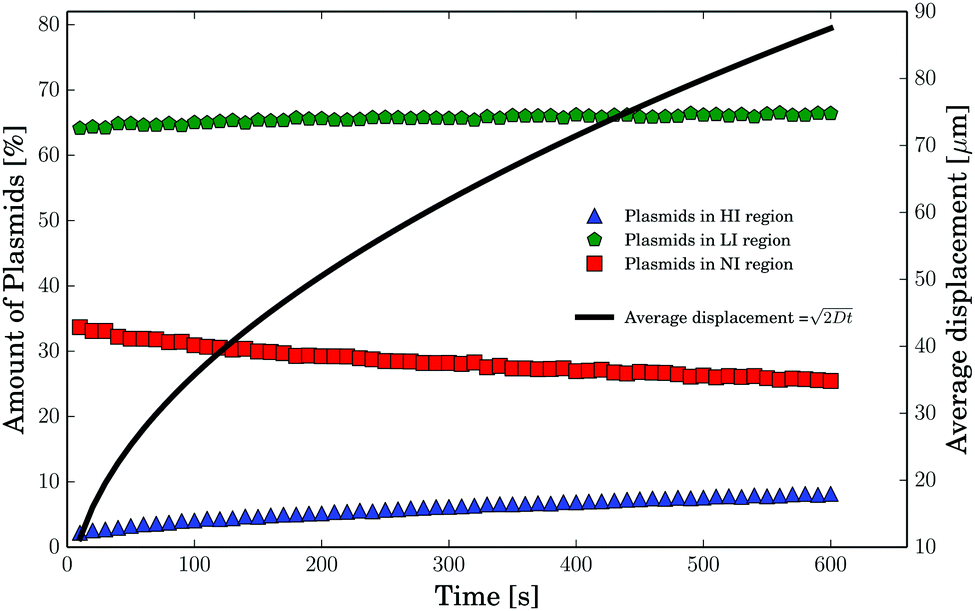
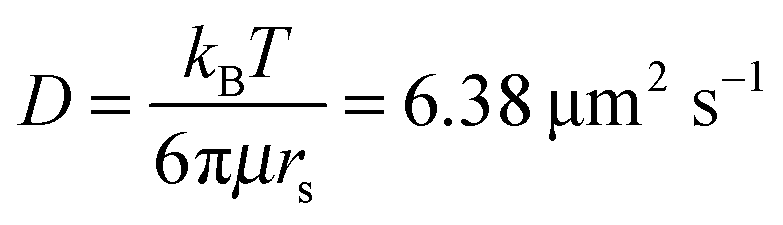
To determine the percentage of plasmids residing within the HI and LI regions, a three-dimensional random walk was simulated. Starting positions for 105 plasmids within the inner sample holder volume with the geometry of a cylinder of 1 mm length and 0.8 mm radius were chosen randomly. The length of an elementary cell was set to two times the gyration radius (rg) of pUC1929 which resulted in a time resolution of 1.35 ms. The diffusion constant (D) is calculated as 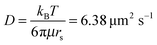 with kB being the Boltzmann's constant, the temperature T = 303 K, the viscosity of water at 303 K μ = 0.797 gm−1 s−1 and the Stokes radius of pUC19 rs = 43.6 nm.29 The average displacement in one dimension (λ) is obtained by the following relation30 as:
| |  | (1) |
The results are displayed in Table 1 and Fig. 5. From these results, it can be concluded that even for the longest irradiation times of 600 s, the total amount of plasmids residing in the HI region never exceeds 6% and the percentage of all irradiated plasmids increases during that time from about 67% to about 75% (compare Table 1). For the irradiation times relevant to the formation of SSBs (100 s) only about 2–3% of all plasmids are located within the HI region. Furthermore, a significant amount of plasmids do not get irradiated on the time scale of the experiment. These plasmids reside in the non-irradiated (NI) region of the sample beyond the electron beam scan and broadening as described above and do not manage to diffuse into the irradiated area (HI and LI regions). In essence, on the time scale of the irradiation plasmid diffusion can be considered a minor factor influencing the overall DNA damage.
Table 1 Time dependence of the plasmid average displacement (λ) and the populations of irradiated and non-irradiated plasmids. The values for the plasmids in the respective regions (HI + LI, HI-only or NI region) are given relative to all plasmids in the liquid
|
t (s) |
λ (μm) |
HI + LI (%) |
HI only (%) |
NI only (%) |
| 30 |
19.6 |
66.9 |
1.8 |
33.1 |
| 100 |
35.7 |
69.1 |
2.8 |
30.9 |
| 300 |
61.9 |
71.8 |
4.4 |
28.2 |
| 600 |
87.5 |
74.6 |
6.0 |
25.4 |
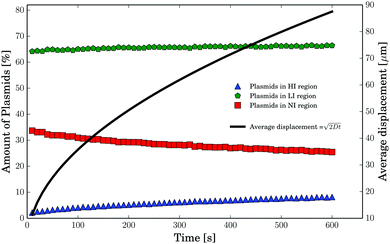 |
| | Fig. 5 The results of the plasmid diffusion simulation. The percentage of plasmids residing at least partly in the HI, LI and NI regions are shown. In addition, the average displacement (black curve) of the plasmids is displayed as calculated by formula 1 (note the different y-axis). | |
3 Results
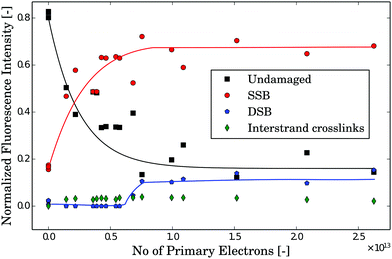
The dependence of the amount of undamaged DNA and DNA with SSBs or DSBs on the number of primary electrons is shown in Fig. 6. The amount of undamaged plasmids decreases rapidly to about 50% at ∼2 × 10¹² primary electrons. A saturation in undamaged plasmids is reached at ∼10 × 1012 primary electrons. The competitive formation of DSBs starts to appear at around 6 × 10¹² primary electrons. Throughout the whole irradiation, no interstrand crosslinks were detected. To estimate the damage dependence of the DNA on the microscopic energy deposit instead of the number of primary electrons we have to apply our simulation results as discussed in the last section. According to the diffusion simulations less than 3% of all plasmids experience the exposure in the HI region for an irradiation time of 100 s. Therefore, these plasmids are neglected in the following analysis. This means that the trend in Fig. 6 is nearly solely due to the damage occurring in the low intensity (LI) region. In addition, the contribution of the plasmids in the NI (INI) region to the signal of undamaged plasmids has to be considered. For irradiation times shorter than 100 s (corresponding to less than 6 × 10¹² primary electrons) 31% of the plasmids do not get irradiated (Table 1). To determine the dosage–damage relationship, we assume the validity of a single-hit-single-target model31 for the survival rate from target theory.32 Thereby, the decrease in the number of undamaged plasmids (survival rate as revealed through the corresponding gel-electrophoresis data) can be described by a differential equation33| | 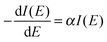 | (2) |
with the solution:This yields| | | Iexp(E) = ILI·e−αE + INI = ILI·e−αnexpβ + INI, | (4) |
where Iexp is the amount of undamaged plasmids, represented by the relative gel-electrophoretic intensity of the corresponding lane, ILI and INI are the contributions from the respective regions, α is the dose coefficient, nexp is the number of primary electrons and E is the microscopic average energy deposit into the volume corresponding to one plasmid and its first hydration shell34 (VpUC19 = 6.12 × 10⁻⁶ μm3). The energy deposit in the plasmid volume per primary electron is found to be β = 1.205 × 10⁻¹⁴ eV.
 |
| | Fig. 6 Change in the plasmid conformation and related damage dependent on the number of primary electrons with 30 keV incident energy. Supercoiled (black squares), circular (red circles), linear (blue pentagons) and interstrand crosslinked (green diamonds) plasmids are shown. The first SSBs occur immediately even after very low exposure with less than 2 × 10¹² electrons. Significant amounts of DSBs appear at dosages about one order of magnitude higher (at about 6 × 10¹² electrons). The lines are guides to the eye. | |
After subtraction of INI and normalization, the linearization of eqn (4) leads to:
| | | ln(I(E)) = −α·E = −α·nexpβ | (5) |
To these linearized data, we have performed linear regression using a Levenberg–Marquardt algorithm (
R2 = 0.84).
Eqn (5) leads to
α. The median lethal energy (
E1/2) needed to damage 50% of the plasmids can be determined from
eqn (5):
| |  | (6) |
The linearized data and fitting results are displayed in
Fig. 7. The resulting values are:
and
| | | E1/2 = (0.030 ± 0.005) eV | (8) |
with the errors obtained from the fitting algorithm. For a better comparison with the literature data
35 the damage can also be expressed as the SSB yield per eV per four base pairs:
| |  | (9) |
Taking into account the plasmid mass (
mpUC19 = 2.9 × 10
−21 kg) the median lethal dose (
D) is obtained from
eqn (8) as
| | | D1/2 = (1.7 ± 0.3) Gy, | (10) |
and the
G value for SSBs:
| | | GdirectSSB = (170 ± 30) × 103 nmol J−1 | (11) |
The first significant amount of DSBs (≈10%) appears after a microscopic dose of (5 ± 2) Gy within the plasmid volume (
VpUC19). This results in the
G value for DSBs:
| | | GdirectDSB = (12 ± 3) × 103 nmol J−1 | (12) |
The DSB yield per eV per four base pairs is calculated as:
| |  | (13) |
Thereby, it is to be noted that for the production of a significant amount (>10%) of DSBs about one order of magnitude higher primary electron dosages are required than for the occurrence of the first SSBs. The ratio of the SSB/DSB damaging yields per four base pairs per energy deposit can be calculated as:
| |  | (14) |
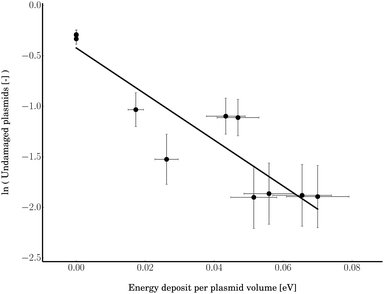 |
| | Fig. 7 The dependence of the amount of undamaged plasmids on the microscopic energy deposit. To determine α, a linear fit (R2 = 0.81) according to eqn (5) was performed. The data pertain to the region before the first DSBs occur (below 6 × 10¹² primary electrons). | |
4 Discussion
We used electrons with a primary kinetic energy of 30 keV to irradiate DNA in water. The observed DNA damage in the form of SSBs and DSBs originates from DNA interaction with the primary radiation and the secondary products of the electron–water interaction. The direct effects of the primary high energy electrons (30 keV) can be estimated by taking into account the results of Folkard et al.12 for dry DNA irradiated by electrons with energies between 25 eV and 4 keV. They determined a dose coefficient α4kV = (100 ± 17) × 10−5 Gy−1, which can be converted into the median lethal dose by eqn (6) leading to a value of D4keV1/2 = (690 ± 120) Gy. This represents about three orders of magnitude smaller damage sensitivity than that found in this work, showing that the direct irradiation of high energy electrons is less efficient in terms of damaging probability than the diverse processes involved in the in-water irradiation. Therefore, we can safely attribute over 95% of the in-water damage to the secondary particles.6 In the experiment carried out in vacuum, Folkards et al. found the maximum damaging efficiency for the electrons with 50 eV (D50eV1/2 = (120 ± 20) Gy), still two orders of magnitude less efficient than the values we obtained in water. In our experiments, the median lethal energy per plasmid including its first hydration shell was obtained as E1/2 = (0.030 ± 0.005) eV. It is the average energy deposit from all inelastic scattering events within that volume. On the other hand, 17.5 eV have to be deposited within the sugar-phosphate backbone to introduce a SSB by direct energy deposit.36 This is 583 times higher than our median lethal energy. Therefore, the production of SSBs by direct energy deposit can be neglected. Thus, the indirect effects of secondary particles, produced in the surrounding of the DNA, have to be responsible for the majority of the SSBs. These species are OH-radicals, ions and low energy electrons (LEEs). The latter react further with water, producing additional OH˙, H˙ and H+ increasing the indirect damage yield.1 LEEs lose energy due to further inelastic scattering until they can get trapped in a prehydrated state (E < 0 eV) before becoming finally hydrated.1 For our experimental conditions, ionization is the dominant inelastic process (93%). This is due to the kinetic energy distribution of the electrons (Fig. 3) having a maximum around 30 eV favoring ionization events, as shown in the Simulations section. Therefore, the species being produced are given by the net ionization reaction:1
| e1− + 2H2O → H3O+ + OH˙ + e1′− + e2− |
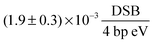
Here, the OH-radical37 and the secondary electrons1 are the most lethal agents. In the Simulations section (Fig. 3), we have shown that over 90% of the electrons have energies below 100 eV. Thereby, one has to consider that between 15 and 100 eV non-resonant processes have the highest inelastic cross-sections.38 The contribution of the electrons to the DNA damage by direct, non-resonant processes is negligible, as already shown above. Below 15 eV, dissociative electron attachment (DEA)6 and dissociative electron transfer (DET)3 dominate the damaging mechanisms. DEA is a resonant process for electron attachment in the range of 0–15 eV.6 The known resonances are determined by vacuum studies. Rezaee et al.35 have found for irradiation of dry DNA with 10 eV electrons, a value of Y10eV4bp = 3.6 × 10⁻³ SSB (4 bp eV)−1, a much higher damage efficiency than for non-resonant processes. In this case, only the LEEs are involved in the damage of the dry DNA-films via the resonance around 10 eV. We note here the high effectiveness of the resonance processes observed for electron irradiation under vacuum conditions.38 Interestingly, our results obtained in water show still higher damage efficiency. Even by considering the contribution of OH-radicals, a relatively high amount of processes involving LEEs has to be present. This can be explained by considering the resonances near 0 eV, which in a polar medium like water might be enhanced3,39,40 and shifted from positive values in the gas phase to values below 0 eV in water. This way, the type of damaging process would change from DEA to DET.3 This opens an additional effective way for the prehydrated electrons to cause molecular bond breaks in DNA.3,8 As being an intermediate species between LEEs and hydrated electrons this species exist in abundant quantities. However, to separate LEEs and radical contributions, radical scavengers will be introduced in future experiments as will discussed below.
In the following section, we will discuss our experimentally determined DSB/SSB ratio (1![[thin space (1/6-em)]](https://www.rsc.org/images/entities/char_2009.gif) :12) in regard to the experimental and simulational results obtained by other groups. Using PARTRAC, an advanced suite of Monte Carlo codes, including target models for DNA damage, electron tracks in the energy range around 50 eV were simulated.41,42 This way, Friedland et al. obtained a DSB/SSB ratio of about 1:25.41,42 Therefore, we can conclude that the PARTRAC electron scattering results and their DNA damaging models are consistent with our combination of Geant4 electron scattering simulations and the measured DNA damage. On the other hand, when we compare our DSB/SSB ratio with the results for fully hydrated DNA from Alizadeh et al. (1:88)15 our ratio is 7.3 times higher. Their values for hydrated DNA are based on electron emission from a Ta-substrate induced by X-rays. There, approximately 96% of the electrons have energies below 30 eV, with an average energy of 6 eV.15 The different damaging ratios are likely to have their origin in the dramatic difference in the amount of surrounding water, as well as the electron kinetic energies12,42 and the possible difference in the production of positive ions. A strong argument for the influence of water is that the G-values obtained by Alizadeh et al.15 for the loss of undamaged plasmids increased by a factor of 1.6 between dry and hydrated DNA with two hydration layers present. After adding water beyond the second hydration layer, the DSB yield stayed constant, while the SSB yield increased again by a factor of 4.5. But even compared to this fully hydrated DNA, our G-value is about two orders of magnitudes higher for the induction of SSBs than the values obtained by Alizadeh et al.15 This is continuing their measured trend which showed an increase of the SSBs with the level of hydration. Our G-value for the production of DSBs is even increased by a factor of 570 compared to their fully hydrated DNA.
:12) in regard to the experimental and simulational results obtained by other groups. Using PARTRAC, an advanced suite of Monte Carlo codes, including target models for DNA damage, electron tracks in the energy range around 50 eV were simulated.41,42 This way, Friedland et al. obtained a DSB/SSB ratio of about 1:25.41,42 Therefore, we can conclude that the PARTRAC electron scattering results and their DNA damaging models are consistent with our combination of Geant4 electron scattering simulations and the measured DNA damage. On the other hand, when we compare our DSB/SSB ratio with the results for fully hydrated DNA from Alizadeh et al. (1:88)15 our ratio is 7.3 times higher. Their values for hydrated DNA are based on electron emission from a Ta-substrate induced by X-rays. There, approximately 96% of the electrons have energies below 30 eV, with an average energy of 6 eV.15 The different damaging ratios are likely to have their origin in the dramatic difference in the amount of surrounding water, as well as the electron kinetic energies12,42 and the possible difference in the production of positive ions. A strong argument for the influence of water is that the G-values obtained by Alizadeh et al.15 for the loss of undamaged plasmids increased by a factor of 1.6 between dry and hydrated DNA with two hydration layers present. After adding water beyond the second hydration layer, the DSB yield stayed constant, while the SSB yield increased again by a factor of 4.5. But even compared to this fully hydrated DNA, our G-value is about two orders of magnitudes higher for the induction of SSBs than the values obtained by Alizadeh et al.15 This is continuing their measured trend which showed an increase of the SSBs with the level of hydration. Our G-value for the production of DSBs is even increased by a factor of 570 compared to their fully hydrated DNA.
A possible explanation of the difference for the data obtained for hydrated DNA and DNA in a fully aqueous environment may concern the processes proposed by Orlando et al.43,44 They suggested that new reaction and decay channels emerge after the formation of DNA–water complexes. After excitation, these complexes may produce excited water products and LEEs by autoionization. These two reactive species are each supposed to lead to SSBs near each other, increasing the probability of DSB occurrence. Therefore, the difference in the DNA water environment (∼3 water layers on one side vs. bulk water) can cause an increase in the amount of SSBs and DSBs and the DSB/SSB ratio. This is because secondary particles due to water radiolysis can reach the DNA by diffusion even from distances of ∼4 nm45 and cause damage. Our results demonstrate the higher efficiency of the DNA damaging processes in the fully aqueous environment as compared to just hydrated DNA.
Another process which increases the general damage yield in liquid takes predominantly place in weakly bound clusters of light atoms44 (e.g. water cluster) is the intermolecular columbic decay (ICD).46 This Auger-like process happens in adjacent molecules. A first molecule gets ionized, emitting an electron from a core level. The refilling process of the core–shell emits a characteristic photon which interacts with a valence electron of a molecule nearby. This was proposed to be an efficient source of low energy electron production in water clusters.46 This is likely to differ in liquid and hydrated samples, highlighting again the importance of performing in-liquid experiments to cover all types of damaging channels and the diverse structural states of biomolecules.
On the experimental side, the damage contributions of the different secondary damaging particles have to be properly separated as well. A viable approach for future experiments is to suppress radicals by applying a radical scavenger, such as isopropanol or dimethyl sulfoxide (DMSO), which is effective in scavenging OH radicals.8,47Vice versa, it is complementarily possible to scavenge prehydrated electrons by KNO3.8,47 Applying isopropanol or DMSO makes it possible to measure the pure electron contribution to the DNA damage without involvement of OH-radicals. Also, the method opens a possibility to investigate the effect of radiation on DNA of different structures (ssDNA and dsDNA), provided the diffusion of these species is properly accounted for, and of different sequences.
5 Conclusions
In conclusion, we have presented a combined experimental and simulational approach to irradiate and analyze the damage to biomolecules by electrons under natural conditions. First experiments were performed with plasmid DNA in water and the dependence of the occurrence of SSBs and DSBs on the primary electrons was observed. In combination with electron scattering and plasmid diffusion simulations, the microscopic energy deposit per plasmid was determined. The microscopic median-lethal dose for pUC19 DNA under electron irradiation was determined as 1.7 ± 0.3 Gy. This value is lower than the reported value for biological tissue48 due to the fact that our calculations were performed on the molecular level excluding the bulk water and other components of the tissue. As is well known from radiation chemistry, these results show that most of the damage has to be attributed to indirect damage by secondary particles. The results are summarized in Table 2. Moreover, we investigated the DNA damage over a wide energy region and found a substantial amount of DSBs occurring after an average microscopic dose of 5.0 ± 0.8 Gy. No interstrand crosslinks could be detected by gel-electrophoresis data over the whole dosage range. The ratio of double-strand breaks to single strand-breaks DSBs/SSBs = 1/12 was found to be much higher in liquid than in humid or dry samples as reported by other authors. This was attributed to the difference in the kinetic energy spectra of the LEEs, the higher amount of surrounding water and the opening of new damaging channels for solvated DNA. To improve the accuracy of the reported values, more detailed diffusion models for plasmids and secondary products should be considered taking into account microscopic attachment probabilities to different DNA sites, production rates, lifetimes and plasmid structures. The next step would be to separate electron and radical contributions by the introduction of scavengers. This approach would give quantitative answers to the open questions of the contributions of the various species involved in damaging DNA in water. On the experimental side, the presented method can be used to irradiate different biomolecules or even cells under various conditions, such as varying pH or salt concentrations.
Table 2 An overview of the damage-energy (E) and damage-dose (D) relations, the G value, the damaging yield per four base pairs (Y) and the corresponding fitting coefficient (α). The SSB values result from the fit for the median lethal dose. The DSB values result from the first data point with more than 10% of DSBs. See the text for details
| Type |
SSB |
Type |
DSB |
|
α
E
|
(27 ± 4) eV−1 |
α
E
|
— |
|
E
1/2
|
(0.030 ± 0.005) eV |
E
1/10
|
(0.09 ± 0.02) eV |
|
α
D
|
(0.41 ± 0.06) Gy−1 |
α
D
|
— |
|
D
1/2
|
(1.7 ± 0.3) Gy |
D
1/10
|
(5.0 ± 0.8) Gy |
|
G
SSB
|
(170 ± 30) × 103 nmol J−1 |
G
DSB
|
(12 ± 3) × 103 nmol J−1 |
|
Y
E4bp
|
|
Y
E4bp
|
|
Acknowledgements
This work was supported by the German Science Foundation (DFG) under contract number STU 245/4-1 and BI 536/3-1.
References
- E. Alizadeh, A. G. Sanz, G. Garcia and L. Sanche, J. Phys. Chem. Lett., 2013, 4, 820–825 CrossRef CAS PubMed.
- C.-R. Wang and Q.-B. Lu, Angew. Chem., Int. Ed., 2007, 46, 6316–6320 CrossRef CAS PubMed.
- C.-R. Wang, J. Nguyen and Q.-B. Lu, J. Am. Chem. Soc., 2009, 131, 11320–11322 CrossRef CAS PubMed.
- B. Abel, U. Buck, A. L. Sobolewski and W. Domcke, Phys. Chem. Chem. Phys., 2011, 14, 22–34 RSC.
- S. M. Pimblott and J. A. LaVerne, Radiat. Phys. Chem., 2007, 76, 1244–1247 CrossRef CAS.
- E. Alizadeh and L. Sanche, Chem. Rev., 2012, 112, 5578–5602 CrossRef CAS PubMed.
- F. Martin, P. D. Burrow, Z. Cai, P. Cloutier, D. Hunting and L. Sanche, Phys. Rev. Lett., 2004, 93, 068101 CrossRef PubMed.
- J. Nguyen, Y. Ma, T. Luo, R. G. Bristow, D. A. Jaffray and Q.-B. Lu, Proc. Natl. Acad. Sci. U. S. A., 2011, 108, 11778–11783 CrossRef CAS PubMed.
- M. Smyth and J. Kohanoff, Phys. Rev. Lett., 2011, 106, 238108 CrossRef PubMed.
- M. P. Gaigeot, P. Lopez-Tarifa, F. Martin, M. Alcami, R. Vuilleumier, I. Tavernelli, M. A. Hervé du Penhoat and M. F. Politis, Mutat. Res., Rev. Mutat. Res., 2010, 704, 45–53 CrossRef CAS PubMed.
- B. Liu, S. B. Nielsen, P. Hvelplund, H. Zettergren, H. Cederquist, B. Manil and B. A. Huber, Phys. Rev. Lett., 2006, 97, 133401 CrossRef CAS PubMed.
- M. Folkard, K. Prise, B. Vojnovic, S. Davies, M. Roper and B. Michael, Int. J. Radiat. Biol., 1993, 64, 651–658 CrossRef CAS PubMed.
- T. Solomun, H. Seitz and H. Sturm, J. Phys. Chem. B, 2009, 113, 11557–11559 CrossRef CAS PubMed.
- W. Chen, S. Chen, Y. Dong, P. Cloutier, Y. Zheng and L. Sanche, Phys. Chem. Chem. Phys., 2016, 18, 32762–32771 RSC.
- E. Alizadeh and L. Sanche, Eur. Phys. J. D, 2014, 68, 1–13 CrossRef CAS.
- D. Pang, J. E. Rodgers, B. L. Berman, S. Chasovskikh and A. Dritschilo, Radiat. Res., 2005, 164, 755–765 CrossRef CAS PubMed.
- L. N. González, J. D. T. Arruda-Neto, M. A. Cotta, H. Carrer, F. Garcia, R. A. S. Silva, A. L. D. Moreau, H. Righi and G. C. Genofre, J. Biol. Phys., 2012, 38, 531–542 CrossRef PubMed.
- J. M. Song, J. R. Milligan and B. M. Sutherland, Biochemistry, 2002, 41, 8683–8688 CrossRef CAS PubMed.
- Y. Jiang, M. Rabbi, M. Kim, C. Ke, W. Lee, R. L. Clark, P. A. Mieczkowski and P. E. Marszalek, Biophys. J., 2009, 96, 1151–1158 CrossRef CAS PubMed.
- T. Solomun, H. Seitz and H. Sturm, Radiat. Phys. Chem., 2013, 88, 70–73 CrossRef CAS.
- T. Solomun, R. Mix and H. Sturm, ACS Appl. Mater. Interfaces, 2010, 2, 2171–2174 CAS.
- T. Solomun and T. Skalický, Chem. Phys. Lett., 2008, 453, 101–104 CrossRef CAS.
- T. Solomun, H. Sturm, R. Wellhausen and H. Seitz, Chem. Phys. Lett., 2012, 533, 92–94 CrossRef CAS.
- M. Wojdyr, J. Appl. Crystallogr., 2010, 43, 1126–1128 CrossRef CAS.
- S. Agostinelli, J. Allison, K. Amako, J. Apostolakis, H. Araujo, P. Arce, M. Asai, D. Axen, S. Banerjee, G. Barrand, F. Behner, L. Bellagamba, J. Boudreau, L. Broglia, A. Brunengo, H. Burkhardt, S. Chauvie, J. Chuma, R. Chytracek, G. Cooperman, G. Cosmo, P. Degtyarenko, A. Dell'Acqua, G. Depaola, D. Dietrich, R. Enami, A. Feliciello, C. Ferguson, H. Fesefeldt, G. Folger, F. Foppiano, A. Forti, S. Garelli, S. Giani, R. Giannitrapani, D. Gibin, J. J. Gómez Cadenas, I. González, G. Gracia Abril, G. Greeniaus, W. Greiner, V. Grichine, A. Grossheim, S. Guatelli, P. Gumplinger, R. Hamatsu, K. Hashimoto, H. Hasui, A. Heikkinen, A. Howard, V. Ivanchenko, A. Johnson, F. W. Jones, J. Kallenbach, N. Kanaya, M. Kawabata, Y. Kawabata, M. Kawaguti, S. Kelner, P. Kent, A. Kimura, T. Kodama, R. Kokoulin, M. Kossov, H. Kurashige, E. Lamanna, T. Lampén, V. Lara, V. Lefebure, F. Lei, M. Liendl, W. Lockman, F. Longo, S. Magni, M. Maire, E. Medernach, K. Minamimoto, P. Mora de Freitas, Y. Morita, K. Murakami, M. Nagamatu, R. Nartallo, P. Nieminen, T. Nishimura, K. Ohtsubo, M. Okamura, S. O'Neale, Y. Oohata, K. Paech, J. Perl, A. Pfeiffer, M. G. Pia, F. Ranjard, A. Rybin, S. Sadilov, E. Di Salvo, G. Santin, T. Sasaki, N. Savvas, Y. Sawada, S. Scherer, S. Sei, V. Sirotenko, D. Smith, N. Starkov, H. Stoecker, J. Sulkimo, M. Takahata, S. Tanaka, E. Tcherniaev, E. Safai Tehrani, M. Tropeano, P. Truscott, H. Uno, L. Urban, P. Urban, M. Verderi, A. Walkden, W. Wander, H. Weber, J. P. Wellisch, T. Wenaus, D. C. Williams, D. Wright, T. Yamada, H. Yoshida and D. Zschiesche, Nucl. Instrum. Methods Phys. Res., Sect. A, 2003, 506, 250–303 CrossRef CAS.
- S. Incerti, A. Ivanchenko, M. Karamitros, A. Mantero, P. Moretto, H. N. Tran, B. Mascialino, C. Champion, V. N. Ivanchenko, M. A. Bernal, Z. Francis, C. Villagrasa, G. Baldacchino, P. Guèye, R. Capra, P. Nieminen and C. Zacharatou, Med. Phys., 2010, 37, 4692–4708 CrossRef CAS PubMed.
- M. Vilches, S. García-Pareja, R. Guerrero, M. Anguiano and A. M. Lallena, Nucl. Instrum. Methods Phys. Res., Sect. B, 2007, 254, 219–230 CrossRef CAS.
- M. A. Bernal, M. C. Bordage, J. M. C. Brown, M. Davídková, E. Delage, Z. El Bitar, S. A. Enger, Z. Francis, S. Guatelli, V. N. Ivanchenko, M. Karamitros, I. Kyriakou, L. Maigne, S. Meylan, K. Murakami, S. Okada, H. Payno, Y. Perrot, I. Petrovic, Q. T. Pham, A. Ristic-Fira, T. Sasaki, V. Štěpán, H. N. Tran, C. Villagrasa and S. Incerti, Phys. Med., 2015, 31, 861–874 CrossRef CAS PubMed.
- D. Störkle, S. Duschner, N. Heimann, M. Maskos and M. Schmidt, Macromolecules, 2007, 40, 7998–8006 CrossRef.
- A. Einstein, Ann. Phys., 1905, 17, 549 CrossRef CAS.
- R. Spangler, N. L. Goddard, D. N. Spangler and D. S. Thaler, J. Mol. Biol., 2009, 392, 283–300 CrossRef CAS PubMed.
- L. Zhao, D. Mi, B. Hu and Y. Sun, Sci. Rep., 2015, 5, 14568 CrossRef CAS PubMed.
- A. Ore, Radiat. Res., 1957, 6, 27–39 CrossRef CAS.
- E. Duboué-Dijon, A. C. Fogarty, J. T. Hynes and D. Laage, J. Am. Chem. Soc., 2016, 138, 7610–7620 CrossRef PubMed.
- M. Rezaee, D. J. Hunting and L. Sanche, Med. Phys., 2014, 41, 072502 CrossRef PubMed.
- H. Nikjoo, R. F. Martin, D. E. Charlton, M. Terrissol, S. Kandaiya and P. Lobachevsky, Acta Oncol., 1996, 35, 849–856 CrossRef CAS PubMed.
-
C. von Sonntag, Free-Radical-Induced DNA Damage and Its Repair, Springer Berlin Heidelberg, Berlin, Heidelberg, 2006 Search PubMed.
- M. A. Huels, B. Boudaïffa, P. Cloutier, D. Hunting and L. Sanche, J. Am. Chem. Soc., 2003, 125, 4467–4477 CrossRef CAS PubMed.
- Q.-B. Lu and L. Sanche, J. Chem. Phys., 2001, 115, 5711–5713 CrossRef CAS.
- R. Barrios, P. Skurski and J. Simons, J. Phys. Chem. B, 2002, 106, 7991–7994 CrossRef CAS.
- W. Friedland, P. Jacob, H. G. Paretzke and T. Stork, Radiat. Res., 1998, 150, 170–182 CrossRef CAS PubMed.
- B. Grosswendt, S. Pszona and A. Bantsar, Radiat. Prot. Dosim., 2007, 126, 432–444 CrossRef CAS PubMed.
- T. M. Orlando, D. Oh, Y. Chen and A. B. Aleksandrov, J. Chem. Phys., 2008, 128, 195102 CrossRef PubMed.
- E. Alizadeh, T. M. Orlando and L. Sanche, Annu. Rev. Phys. Chem., 2015, 66, 379–398 CrossRef CAS PubMed.
- H. Nikjoo, D. T. Goodhead, P. O'Neill and P. Terrissol, Int. J. Radiat. Biol., 1997, 71, 467–483 CrossRef CAS PubMed.
- M. Mucke, M. Braune, S. Barth, M. Förstel, T. Lischke, V. Ulrich, T. Arion, U. Becker, A. Bradshaw and U. Hergenhahn, Nat. Phys., 2010, 6, 143–146 CrossRef CAS.
-
C. von Sonntag, The chemical basis of radiation biology, Taylor &
Francis, London, 1987 Search PubMed.
- D. T. Goodhead, Int. J. Radiat. Biol., 1994, 65, 7–17 CrossRef CAS PubMed.
|
| This journal is © the Owner Societies 2017 |
Click here to see how this site uses Cookies. View our privacy policy here. 
 Open Access Article
 This Open Access Article is licensed under a
  *ab,
Susann
Meyer
bc,
Maria-Astrid
Schröter
b,
Harald
Seitz
d,
Hans-Jörg
Kunte
b,
Tihomir
Solomun
*b and
Heinz
Sturm
*ab,
Susann
Meyer
bc,
Maria-Astrid
Schröter
b,
Harald
Seitz
d,
Hans-Jörg
Kunte
b,
Tihomir
Solomun
*b and
Heinz
Sturm


 with kB being the Boltzmann's constant, the temperature T = 303 K, the viscosity of water at 303 K μ = 0.797 gm−1 s−1 and the Stokes radius of pUC19 rs = 43.6 nm.29 The average displacement in one dimension (λ) is obtained by the following relation30 as: