 Open Access Article
Zeolite molecular accessibility and host–guest interactions studied by adsorption of organic probes of tunable size†
F. C.
Hendriks
,
D.
Valencia
,
P. C. A.
Bruijnincx
and
B. M.
Weckhuysen
 *
*
Inorganic Chemistry and Catalysis Group, Debye Institute for Nanomaterials Science, Utrecht University, Universiteitsweg 99, 3584 CG Utrecht, The Netherlands. E-mail: B.M.Weckhuysen@uu.nl
First published on 21st December 2016
Abstract
A series of fluorescent probe molecules based on the commercially available trans-4-(4-(diethylamino)styryl)-N-methylpyridinium iodide (DAMPI) scaffold has been developed. The dynamic radii of these DAMPI-type probes covered a range of 5.8 to 10.1 Å and could be changed by varying the alkyl substituents on the amine donor group, with limited effect on the electronic properties. These probe molecules allow for the direct evaluation of the molecular accessibility into confined spaces, more specifically the micropore architecture of zeolite materials. Evaluation of industrially relevant zeolite materials with 8- (CHA), 10- (MFI) and 12-membered ring pores (FAU) showed that steric bulk influences the rate of adsorption, the amount of probe molecule taken up by the zeolite as well as the interaction of the probe molecule with the zeolite material. Furthermore, a positive linear correlation is found between the pore–probe size difference and total probe uptake by the zeolite. The absorption spectra of each probe molecule within the zeolites show that this DAMPI-type compound is chemically bound to the zeolite's acid sites. The new approach shows the general principle of determining size-accessibility relationships in microporous solids with a series of fluorescent probes of systematically tunable size.
1 Introduction
Zeolites are crystalline aluminosilicates with an ordered microporous structure. Since their introduction in the petrochemical industry in the 1960s, zeolites have found application in a wide range of chemical processes and have become one of the most important types of heterogeneous catalysts.1 Most zeolites have pore sizes of 1–10 Å, allowing for separation and size selection of organic molecules, which often have dimensions in the same size range. In addition, zeolites possess other beneficial properties, such as structural and chemical stability over a wide range of temperatures, the possibility to incorporate acidity and basicity of tunable strength and a high surface area due to microporosity.2The ability of zeolites to influence the outcome of a catalytic reaction arises from geometric constraints imposed by their topology and pore dimensions; an effect which is better known as shape selectivity.3 Shape selectivity can influence which specific product molecules are formed within the zeolite pores (transition state shape selectivity) or whether molecules can enter or exit the zeolite (reactant and product shape selectivity).4,5 Well-known examples include the catalytic cracking of oil feedstock, dewaxing of petroleum products and methanol-to-hydrocarbon conversion.6–8
To study shape selectivity, knowledge about the effective pore diameter of a microporous material is of paramount importance. Methods have been developed to determine the accessibility of (modified) zeolites and other microporous materials based on the reactivity of probe molecules in test reactions.9–13 For example, the reactivity of isomers of hexane and decane in cracking reactions has been used to study the effective diameter of zeolite pores.9,14 In addition, gas adsorption of molecules of increasing size (e.g. N2 < propane < isobutene < neopentane) is often applied to assess reactant and product shape selectivity.15 These studies can give valuable insight in the effective pore diameter as well as the accessibility of pore entrances for reactant molecules. However, these approaches are usually limited to assessing accessibility, giving only limited information about the interaction of the materials with the adsorbed molecules.
The study of zeolite structure and reactivity at the microscopic scale often relies on probe molecules or reactions that can be monitored with various high-resolution spectroscopic techniques.16,17 Fluorescence microscopy, in particular, has taken a prominent role as a versatile tool to study catalytic materials.18–20 Probing materials with molecules that absorb and emit light in the visible region has some distinct advantages. First, the absorption of light is often influenced by the environment in which a molecule is confined, allowing an evaluation of the interaction between the probe molecule and its host material.21,22 Second, using fluorescence microscopy the location of the molecules can be precisely determined (even below the diffraction limit of light) within catalytic23 or zeolitic host–guest materials.24 To the best of our knowledge, fluorescence microscopy has not yet been used to study shape selectivity directly.
The aim of this study is to investigate micropore accessibility in zeolites of varying topology by making use of a series of differently sized fluorescent probe molecules 1–4, which are shown in Scheme 1. These probe molecules are based on the trans-4-(4-(dialkylamino)styryl)-N-methylpyridinium iodide (DAMPI) scaffold. The commercially available diethyl analogue (probe molecule 2) of this series of fluorescent probes has been used before to stain zeolite crystals25 and, more specifically, to visualize the straight pores of MFI crystals26 as well as mesopores in zeolites formed by steaming.27 The alkylamino moiety of this molecule offers a convenient synthetic handle for a systematic size modification of the probe molecule by variation of the alkyl substituents. This results in a series of T-shaped molecular probes of different size that can be used to study changes in zeolite pore accessibility. Variation of only the alkyl groups should not change the electronic properties of the probes much, allowing observed differences in adsorption to be attributed to pore size-dependence. Furthermore, the anisotropy of the rod-shaped, conjugated molecules, such as DAMPI, also offers other distinct advantages. The polarization-dependent light absorption that such probes display, for example, can be used to elucidate the specific orientation of the probe molecule in a three-dimensional micropore system, such as those found in zeolites.28
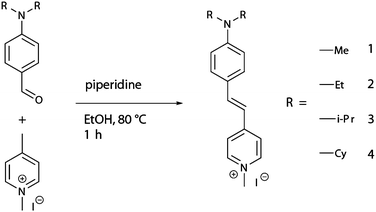 | ||
| Scheme 1 Synthesis of DAMPI derivatives 1 (methyl, Me), 2 (ethyl, Et), 3 (isopropyl, i-Pr) and 4 (cyclohexyl, Cy). | ||
Our study focuses on three industrially relevant zeolites, namely CHA (i.e., SAPO-34), MFI (i.e., ZSM-5) and FAU (i.e., zeolite Y).‡ These frameworks are representative for zeolite materials with 8, 10 and 12-membered rings, respectively. Probe molecules 1–4, bearing methyl-, ethyl-, isopropyl- and cyclohexyl-substituents, were subjected to two types of experiments. First, adsorption experiments were carried out to determine if the probe is taken up by the zeolite material. In this way, the relationship between probe molecule and zeolite pore size can be studied and serves as a benchmark for zeolite accessibility. We show that the zeolite frameworks studied allow molecules to enter with a diameter slightly larger than the reported effective pore diameter. Kinetic experiments furthermore showed that internal mass transfer limitations influence the extent of probe adsorption. Absorption spectroscopy experiments on the probe-loaded zeolite samples demonstrated the influence of confinement in and interaction with the zeolite on the spectroscopic properties of the probe molecule. Indeed, based on observed changes in the electronic properties of the probe, the probe molecules were found to chemically interact with the zeolite acid sites.
2 Experimental
2.1 Materials
trans-4-(4-(Diethylamino)-styryl)-N-methylpyridinium iodide 2 (98%) was purchased from Fluka. N,N-Diisopropylaniline (97%), phosphorus oxychloride (99%), dimethylformamide (99.8%) and N,N-dicyclohexylamine (99%) were purchased from Aldrich. 4-Dimethylaminobenzaldehyde (99%), 4-picoline (99%) and iodomethane (99%) were purchased from Acros. Iodobenzene (98%) was purchased from ABCR. Ethanol (99.5%) was purchased from Merck. H-SAPO-34 was purchased from ACS Chemicals, while NH4-ZSM-5 and NH4-Y were purchased from Zeolyst. The zeolite powders were calcined in a static oven at 773 K for 24 h in air to convert them into their proton form and/or remove any impurities. All other chemicals were used as received. Experimental details on the synthesis of probe molecules 1, 3 and 4 can be found in the ESI.†2.2 Experimental details
UV-vis spectroscopy studies were carried out on solids with an Avantes Avalight DH-S-BAL with deuterium and halogen lamps used as the light source. An Avantes Avaspec 2048L is used as the detector. Both are connected through a fiber optic cable. For the UV-vis spectroscopic studies of the probe molecules in solution, a Cary 50 spectrophotometer from Varian was used. NMR spectra were obtained using a Varian 400 MHz NMR spectrometer. X-ray diffractograms were recorded using a Bruker D2 Phaser. Mass spectra were obtained using an LCT Premier XE mass spectrometer from Waters Micromass using electron spray injection (ESI) as the ionization method. Ar physisorption isotherms were recorded using a Micromeritics Tristar 3000 setup operating at 77 K. Prior to the physisorption measurements, zeolite samples were sieved using only the fraction 75 ≤ x ≤ 90 μm. The samples were dried in vacuum at 673 K overnight. Temperature programmed desorption of ammonia (NH3-TPD) was performed on a Micromeritics ASAP-2020 equipped with a TCD detector.Some probe degradation was observed in acidic environments, likely caused by hydrolysis (see Scheme 1). Indicative of such probe degradation is the emergence of a band in the UV-vis spectra at ∼270 nm corresponding to a less conjugated system. To minimize degradation dry solvents were used in the zeolite adsorption experiments, and zeolites were calcined before each experiment.
The amount of probe molecule adsorption on the zeolite powders versus time was studied by stirring a suspension of the zeolite powder in an ethanol solution containing one of the probes. Before the adsorption experiments, zeolite powders were calcined in vials at 773 K for 6 h. The vials containing the zeolite powders were sealed at 373 K to minimize adsorption of water and cooled down to room temperature. 20 or 50 mg of zeolite powder was stirred with one of the probes 1–4 in ethanol in various concentrations; the resulting suspension was 50 mL. Samples were taken every hour for up to 8 h and then daily for 5 days, taking care to take samples only from a properly homogenized suspension. Samples were immediately filtered using a 0.45 μm PTFE filter. At the end of the experiment the zeolite powders were washed with ethanol and dried in air. The probe concentration in each sample was measured from the absorption of the solution at the λmax of the probe molecule (1 481 nm; 2 492 nm; 3 495 nm; 4 501 nm). The amount of probe adsorbed by the zeolite qt (mol g−1) at time t was calculated using the following formula:
 | (1) |
Zeolite–probe materials were made by suspending the zeolite powder in ethanol containing an excess of one of the probe molecules 1–4. For experiments with NEt3, an excess of NEt3 was added to the solution before addition of the zeolite. UV-vis spectroscopy was used to determine the absorption spectra of the zeolite–probe combination. The adsorption capacity and mechanism were studied by applying/fitting three adsorption models to the data: (a) the Pseudo First Order Equation (PFOE) proposed by Lagergren,29 (b) the Pseudo Second Order Equation (PSOE) as describe by Ho30 and (c) the intraparticle diffusion model described by Weber and Morris.31 Additional information on the theory and application of these models can be found in the ESI.†
2.3 Computational details
The ground states for probe molecules 1–4 were obtained by means of Density Functional Theory (DFT) calculations using the well-known B3LYP32,33 functional with the 6-31+G(d,p) basis set. With all harmonic vibrational frequencies being real, all structures are minima on the potential energy surface. The optimized geometry in the ground state was used for the calculation of the dimensions of the molecule. The dimensions were determined by the smallest cylinder that fully enclosed the entire molecule using the RADI software.34,35 van der Waals radii were taken as the minimum distance between the calculated atom positions and the walls of the cylinder. The diameter of this cylinder is used below as the diameter of the probe molecule.Solvation energies were computed at the same level of theory for each probe molecule in ethanol with the Solvation Model based on Density (SMD).36 The UV-vis spectra were calculated for the molecules in this solvent environment by TD-DFT. The ground state geometries were employed throughout all excited state calculations. Thus, the theoretical excitation energies correspond to vertical transitions, which can be approximately identified as band maxima in experimental absorption spectra. All calculations were performed with the Gaussian 09 software.37
The simulations of movement of the probe molecules through straight pores of MFI zeolite were carried out with Gaussian and plane waves (GPW) method implemented within the CP2K package.38 The DFT-D3 dispersion-corrected Perdew, Burke and Ernzerhof (PBE) functional with the DZVP basis set and a plane waves density cut-off of 1000 Ry was used. The initial zeolite structure was taken from the IZA database39 and further optimized using ab initio molecular dynamics simulations performing 10 ps isothermal–isobaric (NPT) simulations at 1 bar and 400 K followed by a canonical ensemble (NVT) simulation at 400 K with a time step of 2 fs. After initial equilibration, the structures from the snapshots with the minimal potential energy were taken and optimized. The structure with the minimal potential energy was used for all further calculations. A probe molecule was placed into the zeolite at the intersection of a sinusoidal and straight channel and systematically moved along the straight pore (step size 1 Å). To prevent movement of the zeolite and probe molecules during geometry optimizations, 5 atoms in the probe molecule and zeolite were fixed in the direction of the pore. The energies are given as the difference between the energy of the optimized geometry of the probe inside the pore versus the sum of the probe and zeolite in vacuum (not in contact to each other). The activation energy for movement from one intersection to the next was calculated from the difference of energies corresponding to the most and the least stable positions within the zeolite pore.
3 Results and discussion
3.1 Synthesis and characterization of probe molecules
Three derivatives of the commercially available DAMPI molecule were synthesized by changing the alkyl substituents on the aniline group from ethyl groups (2) to methyl (1), isopropyl (3) and cyclohexyl (4) groups, with the latter two compounds being new. Variation of the alkyl substituents provided a convenient handle to control the effective diameter of the probe molecule. These probe molecules are synthesized by a base-catalyzed reaction from a common picoline precursor and a modular benzaldehyde component (Scheme 1). The substituents on the latter can be systematically varied, in principle providing access to a broad range of DAMPI-type molecules. Powdered samples of the four probes show various shades of red, in line with the assumption that variation of the alkyl substituent has little effect on the electronic properties of these dyes (Table 1). Notably, crystallization of probe molecule 3 yields dark green crystals (which give a red powder upon crushing), highlighting the large effect of intermolecular interactions. The color shift to green in the crystal could be due to intermolecular donor–acceptor interactions, if those parts of the molecule are in close proximity due to specific stacking within the crystal.40| Probe molecule | λmaxa (nm) | λemi,![[thin space (1/6-em)]](https://www.rsc.org/images/entities/char_2009.gif) maxb (nm) maxb (nm) |
ελ max (103 mol−1 L−1 cm−1) | Diameterc (Å) |
|---|---|---|---|---|
| a In ethanol. b In the solid state (probes are non-fluorescent in solution). c Calculated by DFT from the optimized geometry of the probe molecule, see Section 2.3 for details. | ||||
| 1 | 481 | 571 | 37.6 | 5.8 |
| 2 | 493 | 606 | 53.1 | 6.5 |
| 3 | 495 | 601 | 38.3 | 7.2 |
| 4 | 501 | 601 | 41.5 | 10.1 |
As probe molecules 1–4 were designed to probe into zeolite pore accessibility and diffusivity, a proper estimate of their molecular size is of prime importance. To this end, the molecular structure of the four probe molecules was determined by DFT calculations. The optimized geometry was enveloped with the smallest possible cylinder taking into account the van der Waals radii, resulting in a typical length and diameter for each probe molecule. While the length of the cylinders showed only minor differences, the effect of the alkyl substituent is clearly reflected in the diameter (Fig. 1c). Probe sizes thus range from 5.8 Å, which is approximately the size of a 10-ring zeolite micropore, to 10.1 Å, the size of a 14-ring zeolite pore.
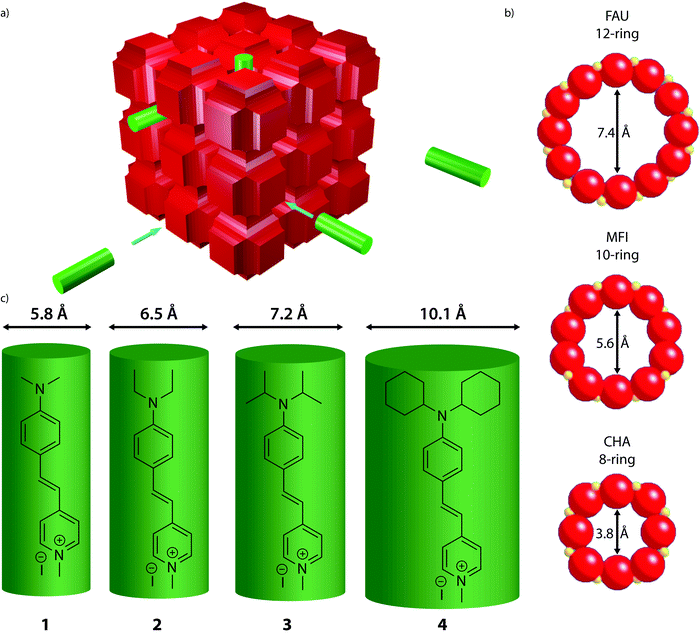 | ||
| Fig. 1 (a) Schematic representation of the experiments showing a generalized zeolite structure (red) and the probe molecules (green). (b) Pore openings and sizes of selected zeolites used in the adsorption experiments. Zeolite Y (FAU) is used as a model for 12-ring pores, ZSM-5 (MFI) for 10-ring pores and SAPO-34 (CHA) for 8-ring pores.39 MFI has two types of pores, straight pores with a diameter of 5.6 Å, and sinusoidal pores with a diameter of 5.3 Å (not shown). (c) The four synthesized molecular probes 1–4 with their sizes based on DFT calculations. | ||
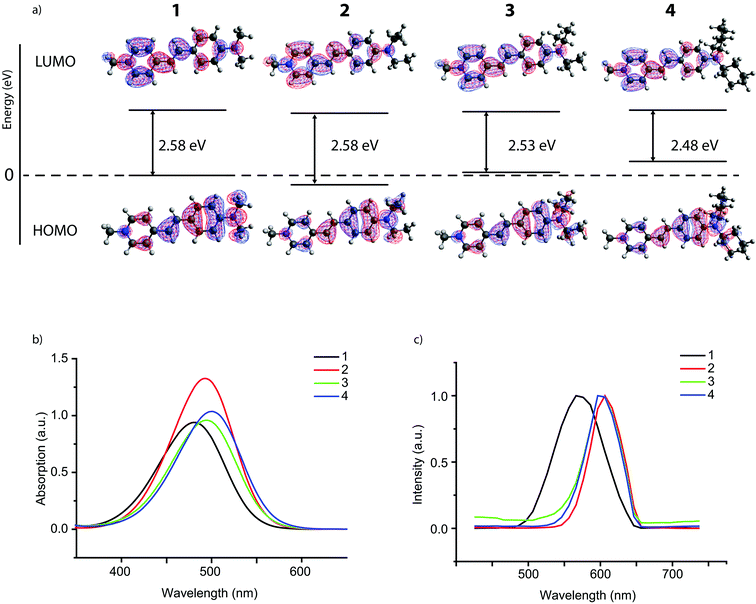
The UV-vis spectra of the dilute reddish solutions of probe molecules 1–4 (Fig. 2b) show one main absorption band for all probes with a λmax ranging from 482 to 501 nm. Larger alkyl substituents cause a red shift in the absorption maximum (i.e. to longer wavelengths). This is likely caused by an increase in electron donation of the larger alkyl groups, rendering the amine moiety with stronger donor character. Indeed, DFT calculations show an increased electron density on the amine moiety for larger alkyl substituents (Fig. 2a). The energy levels for the highest occupied molecular orbital (HOMO) also increase in energy with increased alkyl substitution, which is in line with previous results.41 The lowest unoccupied molecular orbital (LUMO) on the other hand does not change much throughout the probe series; the electron density for the LUMO is mostly located on the pyridine moiety, which remains unchanged in the series. As a result, the increased energy level for the HOMO thus leads to a smaller HOMO–LUMO gap and the associated red shift.§ The calculated UV-vis spectra (Fig. S1, ESI†) of these probe molecules correspond very well to those measured experimentally in ethanol. The relatively small shift in absorption maximum within the series again shows that modification of the probe molecule by substitution of the alkyl groups on the amine moiety does not lead to a large change in the electronic properties of the molecule.27 Emission spectra of the four probe molecules were recorded for the powders using a 488 nm laser as the excitation source (Fig. 2c); in solution, fluorescence is quenched by cis–trans isomerization.26,42 The emission maxima of the probe molecules range from 571–606 nm; such a large Stokes shift is beneficial for probes that are used for imaging purposes.43
3.2 Adsorption of DAMPI-type molecules into zeolites
The three zeolite framework structures selected for the adsorption experiments (i.e. CHA with 8-ring pores, MFI with 10-ring pores and FAU with 12-ring pores (Table 2)) have a 3-dimensional pore system. The CHA and FAU frameworks have the same pores in all directions, while MFI has straight pores in one direction while the sinusoidal ones are oriented in another direction. The MFI pore system has previously been subject of study by Roeffaers et al.26 using probe molecule 2, arguing that this probe enters the pore mouths of the straight pores only in an end-on, stopcock kind of fashion (i.e. pyridinium-side first). Ar physisorption was performed to show the accessibility of the pore network and the micropore volume of each zeolite. Some mesoporosity is detected, but this is expected to be derived from the area between aggregates of zeolite particles, and therefore will have no substantial influence on probe adsorption (see Fig. S4, ESI†).| Pore system | Topology | Si/Al ratio | Micropore volumeb (cm3 g−1) | Acid site densityc (mmol g−1) | Micropore sized (Å) |
|---|---|---|---|---|---|
| a This is an approximate value as in SAPO materials, the acidity is highly dependent on Si distribution in the framework.63 b t-plot method. c All acid sites, as determined by ammonia TPD. d Based on the largest pore diameter of relevant pores as stated in the International Zeolite Database. e Sinusodal pores of MFI are slightly smaller but are not considered to be relevant for this research.39 | |||||
| 8-ring | CHA (SAPO-34) | 0.2a | 0.18 | 1.68 | 3.8 |
| 10-ring | MFI (ZSM-5) | 15 | 0.13 | 0.74 | 5.6e |
| 12-ring | FAU (Y) | 2.6 | 0.23 | 1.02 | 7.4 |
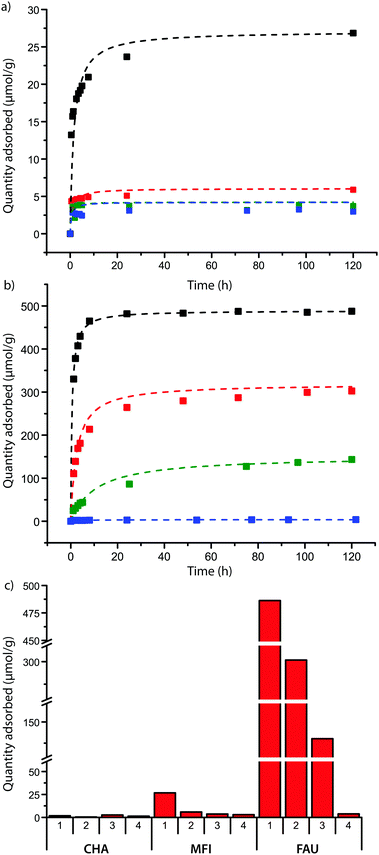
The zeolite powders were contacted with solutions of the probe molecules, and samples were taken at regular intervals to investigate the rate of adsorption of the DAMPI-type molecules. The results are summarized in Fig. 3. As expected the zeolite with 8-ring pores shows no adsorption of any of the probes, confirming that probe molecules 1–4 are too large to enter these pores, which are only 3.8 Å in diameter. For the other zeolite materials under study, it was found that the quantity of probe molecule adsorbed usually plateaus in 1 or 2 days, (Fig. 3a and b for FAU and MFI). Experiments were stopped after 5 days, as in some cases partial degradation of the probe was observed if the contact time was longer than that. The total probe uptake after 5 days is shown for each zeolite in Fig. 3c.
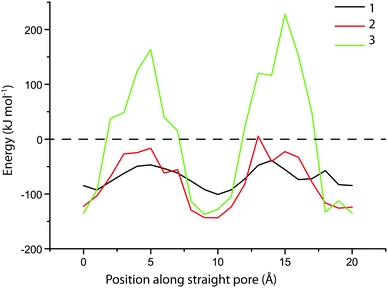
There is significant uptake of probe molecule 1 (5.8 Å) into the 10-membered ring pores of zeolite MFI (5.1–5.6 Å), even though these pores were expected to be too small for probe inclusion, based on our calculations. It is known that the similarly-sized trans-stilbene (5.7 Å) also readily enters zeolite MFI.44 Evidently, there is some degree of flexibility in either the probe molecule or the zeolite structure; the latter is indeed known to exhibit some flexibility in case of tight fits.45,46 In addition, van der Waals radii, due to their statistical nature, can vary by few tenths of an Ångström depending on the system.47 In contrast to probe molecule 1, probe 2 shows adsorption just above the detection limit while probes 3 and 4 do not show any adsorption. To study these differences of adsorption into the MFI framework in more detail, DFT calculations were performed on probe molecules 1–3 within an MFI straight pore. The molecule was moved along a straight pore stepwise from one intersection (with a sinusoidal pore) to the next intersection. The energy landscape obtained this way is shown in Fig. 4. For probe molecule 1, the activation energy associated with this translocation is just 50 kJ mol−1, which can be easily overcome at room temperature. Movement of probe molecule 2, however, should be very slow or negligible given the calculated activation energy of 125 kJ mol−1, while probe 3 is unlikely to move through the pore (>300 kJ mol−1). These results are in line with the experimental adsorption results.
For zeolite FAU, adsorption of varying amounts of probe molecules 1–3 is seen, while no significant amount of probe 4 is adsorbed: this is in line with what is calculated based on probe size. The initial rate of the adsorption is influenced by the size of the pore, showing that, as expected, the steric bulk of the molecule influences the speed at which the molecules move into or through the zeolite pores. The plot between the probe versus pore size difference (PPSD) and the natural logarithm of the initial rate of adsorption shows the relationship is exponential as a straight line is obtained from this plot (Fig. 5a). This implies that that the activation energy Ea of the adsorption of the probe into the zeolite is linearly related to the size of the probe.
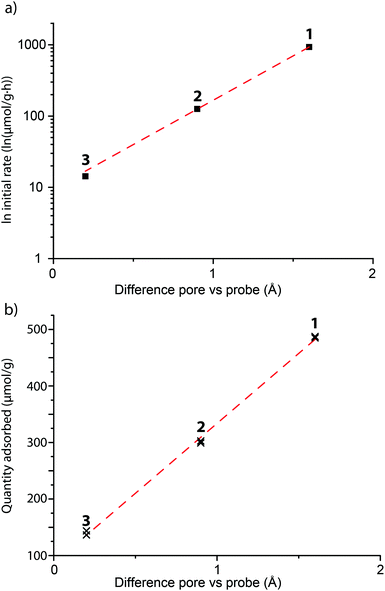 | ||
| Fig. 5 The initial rate (a) and the equilibrium amount (b) of the different probe molecules 1–3 adsorbed in FAU in comparison to the tightness of fit between probe and the zeolite pore. (a) The initial rate is calculated from the Pseudeo Second Order Equation and plotted on a logarithmic scale. The sizes of the probes 1–3 and zeolites can be found in Tables 1 and 2. The R2 value of the fit is 0.9997. (b) Adsorbed amounts were recorded from adsorption experiments when the adsorption had plateaud, after 4 and 5 days. The R2 value of the fit is 0.9983. | ||
Interestingly, the total amount of probe adsorbed is also influenced by probe size: the equilibrium adsorption amounts versus the PPSD also give a linear relationship (Fig. 5b). The relatively small increase in volume between the probe molecules (due to steric bulk) can not explain this large change in adsorption.¶ The equilibrium amount adsorbed is a thermodynamic parameter and must therefore be governed by physical (i.e. van der Waals or dipole interactions) or chemical (i.e. protonation) interactions of the probe molecule with the zeolite. These interactions become weaker with distance; it is therefore likely that the steric bulk surrounding the molecule limits the probe from effectively binding to the zeolite.
To gain more insight in the kinetics and mode of adsorption, three adsorption models were tested on the data. A comparison was first made between the Pseudo First Order Equation (PFOE)29 and the Pseudo Second Order Equation (PSOE) models, two models applied extensively to adsorption of molecules into microporous materials.48,49 These models are both empirical, but can be derived from the Langmuir adsorption model. The applicability of these models depends on the concentration of the probe with respect to the zeolite, with the PFOE giving better fits at higher probe/zeolite ratio and PSOE at a lower ratio.49 However, as this ratio is not constant over the course of the experiment, the applicability of the model may differ over time.48 It was found that a good fit could be obtained with the PFOE for the first 24 h of the experiment only (Table 3 and Fig. S6, ESI†). Moreover, the model was unable to predict the adsorbed amount in equilibrium. Because of this, the PFOE was discarded as model for the adsorption process.
Conversely, PSOE was found fit the adsorption of probe molecules 1–4 into zeolites well over the complete time range. The application of the linear form of this model is shown in Fig. 6a, while Fig. 3 shows how the model fits the adsorption curves. If the total adsorption is low, the experimental error hampers an accurate fit (Fig. S7, ESI†); therefore, only probes that were adsorbed in significant amounts (more than 10 μmol g−1, determined by the experimental uncertainty) were analyzed. The PSOE can be applied to systems where the adsorption is dependent on the amount of available adsorption sites in the material and when desorption is not contributing to the overall rate.30 The first condition is applicable to zeolites where a finite number of probes fit into the pores. The second condition was verified by experiment; probes adsorbed on zeolites do not desorb when stirred in a solution with ethanol. Apparently, the equilibrium is completely on the adsorbed side, so there must be a significant energy gain. A good fit obtained with the PSOE is usually indicative of a chemical interaction between adsorbent and adsorbate, as it is associated with the Langmuir adsorption model.50 The probe molecules used contain several functional groups, most notably an amine group which can be protonated. The good fit with the model therefore again suggests that the molecules are chemically bound to the acid sites of the zeolite. Protonation of the probe molecule by an acid site is also supported by the linear relationship between PPSD and the equilibrium amount adsorbed for probe 1–3 in FAU: increased steric bulk will negatively influence the ability of the zeolite to protonate the probe molecule because of the increase in probe–zeolite proton distance.
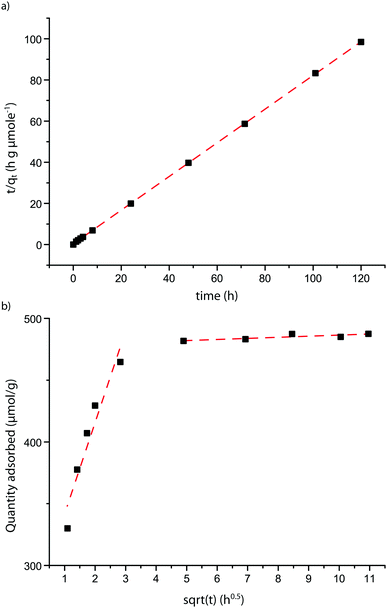 | ||
| Fig. 6 Applicability of kinetic models to the adsorption of probe molecule 1 on FAU. (a) Shows the linear variant of the pseudo second order equation showing the quality of the fit (see also Table 3 and Fig. 3). (b) Shows a Weber–Morris plot. Two different linear regions can be observed, which apply to two different stages of adsorption. | ||
The Intraparticle Diffusion Model (IDM)31 is a model closely related to the PSOE and can yield additional insight in diffusional behavior of a system.50 This model assumes that (slow) diffusion of molecules within pores influences the overall adsorption rate.50 The rate limiting step in this type of adsorption studies is usually film diffusion or intraparticle diffusion.51,52 The Weber plot of t0.5versus qt shows two separate linear regions (Fig. 6b and Fig. S6, ESI†). The timeframe of the first region is longer than the typical time attributed in adsorption experiments;53 it is therefore likely that film diffusion has already taken place before the first data point. The first linear region of the plot, representing the first 24 h, is therefore likely to be due to internal mass transfer limitations i.e. intraparticle diffusion.54 The slope of this region shows that intraparticle diffusion is dependent on the PPSD, with a higher PPSD accounting for faster diffusion. The second linear region of the plot, representing the experiment from 24 h till the end is almost flat for most probe–zeolite combinations, showing that equilibrium has been reached. However, for probe molecule 1 in MFI and probes 2 and 3 in FAU, this region of the plot shows a slight slope, indicating equilibrium has not yet been reached. Possibly, the first region signifies diffusion through the aggregates of zeolite particles, while the second region corresponds to diffusion into the zeolite pores (see Fig. S2, ESI†).
As pointed out above, processes governing diffusion on time scales relevant to catalysis are mostly not taken into account in our results.55 Because of the tight fit between probe molecule and zeolite and the resulting slow diffusion processes, the adsorption process of the DAMPI-type molecules goes well beyond this time scale. It is therefore clear DAMPI-type molecules are most suitable to study uptake and accessibility on longer timescales.
3.3 Spectroscopic study of adsorbed probe molecules on zeolites
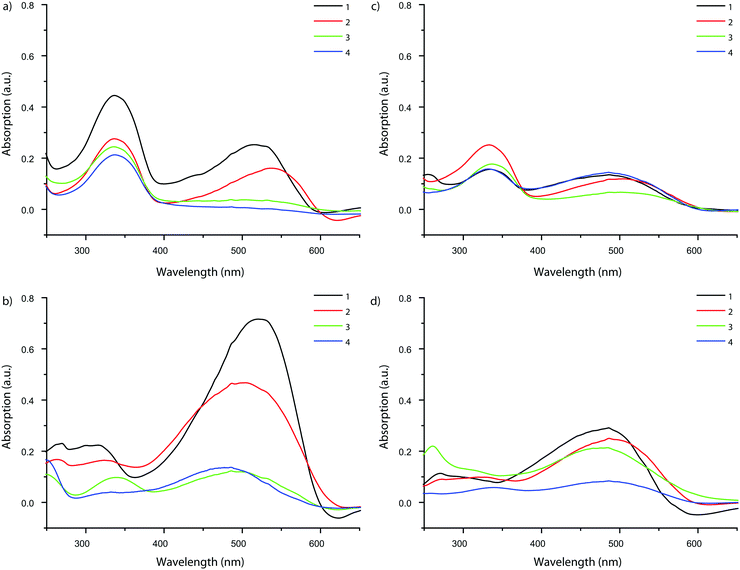
Although the uptake of some probes was low due to their inability to access the zeolite pore network, UV-vis absorption spectra could be measured for each probe taken up by MFI and FAU. This allowed us to study the influence of the framework environment on the probes’ spectroscopic properties. The results are summarized in Fig. 7. Invariably, the absorption spectra of the probes show an intense band at 330 nm. As absorption at this wavelength was also reported for probe molecule 2 in aqueous HCl, it is postulated that the 330 nm band can be attributed to protonation of the amine moiety of the probe by the Brønsted acid sites in the zeolite.56,57 To verify this hypothesis, the adsorption experiments of probe molecules 1–4 on the zeolite materials under study were repeated, but now in the presence of triethylamine, in order to neutralize the acid sites of the zeolites.26 For the quenched zeolites that were stained this way (without available protons to react with the probe molecules), the band at 330 nm is (almost entirely) absent, confirming the interaction of the probes with the acid sites of the zeolite. Additionally, an MFI sample stained with probe molecule 1 was contacted with both pure ethanol and ethanol-containing NEt3. It was found that the solution-containing base is able to leach the probe molecule from the zeolite, while the one without the addition of the base is not. Additionally, the amount of probe adsorbed never exceeds the amount of available acid sites in these experiments.||Fig. 8 shows that the main absorption bands of probe molecule 1 (Δ = 42 nm), probe 2 (Δ = 47 nm) and probe 3 (Δ = 11 nm) are red-shifted within MFI with respect to the dilute probe solutions. On the other hand, probe molecule 4 is blue-shifted (Δ = −13 nm). A similar trend for the four probes is observed in FAU (1: Δ = 12 nm, 2: Δ = 12 nm, 3: Δ = 8 nm, 4: Δ = −13 nm). One reason for these spectral shifts is the interaction of the zeolite with push–pull conjugated system of DAMPI; the absorption properties of these probe molecules are known to be dependent on solvent polarity.58–60 The zeolite is in this case comparable to a highly polar solvent.61,62 On the other hand, the differences in the shifts of the probes are related to the PPSD, although the relationship is not straightforward, as is shown in Fig. 8. In this figure, region I includes probe molecules that are too large to enter into the pore zeolites with a small or even negative shift. The other regions both contain zeolites within accessible pores. Region II depicts a tight fit with corresponding large influence on the absorption maximum, while region III represents a loose fit, leading again only to a small change in absorption properties. There is a narrow band within the PPSD which can be associated with a tight fit between the probe and the zeolite. Interestingly, the effect of confinement is seen with all probe–zeolite combinations, even the probes that do not fit into the pore network. Possibly, the T-shaped probe molecule is inserted end-on into a zeolite pore, thus allowing the molecule to behave as if it was completely adsorbed.26 The sensitivity of the spectroscopic properties of this probe series for the microscopic environment can be thus be used to gain more insight in the interaction of the probe with its surroundings.
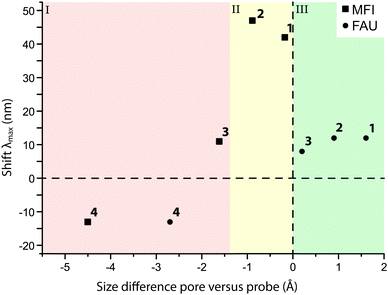 | ||
| Fig. 8 The spectral shift (Δ) of the observed λmax of the probe molecule adsorbed onto MFI (■) and FAU (●) with respect to the λmax in solution, plotted against the size difference between the probe molecule and the zeolite pore. The diameters of probe molecules and zeolite pores can be found in Tables 1 and 2. | ||
4 Conclusions
Distinct fluorescent DAMPI-type molecules of sizes comparable to zeolite pore diameters were successfully synthesized by changing the steric bulk substituents using alkyl groups, while the electronic properties of this series of molecular probes were kept almost constant. The accessibility of these probe molecules into different zeolite framework structures, namely CHA (8-membered rings), MFI (10-membered rings) and FAU (12-membered rings), was evaluated and a correlation was found between the calculated size of a molecule and its ability to enter the zeolite pores. An increase in steric bulk leads to a decrease in the initial adsorption rate, because bulky molecules move slower through the zeolite pores. Additionally, steric bulk influences the equilibrium amount of probe adsorbed into FAU, presumably by increasing the distance between the probe molecule and the zeolite pore wall. Kinetic experiments show that while internal mass transfer limitations play a role when there is a tight fit between the probe and the zeolite, this effect is less pronounced when the probe easily fits in the pores.The probe molecules are protonated upon adsorption into the zeolite by a Brønsted acid site, which causes irreversible adsorption of the probe molecules. Adsorption into the pores of the zeolite is accompanied by the emergence of a second band in the UV-vis spectrum, caused by protonation of the probe molecule. Additionally, the main absorption band is shifted, with a large spectral shift indicating a tight fit of the DAMPI-type molecule and the zeolite pore. In this way, probe molecules give valuable information about the interaction with the zeolite that goes beyond information on pore accessibility.
The approach presented here shows that steric hindrance can be systematically added to probe molecules to modify their size and accessibility. These probe molecules can be used to study physicochemical properties of a wide range of materials and possibly predict effective pore sizes based on the adsorption of a series of probe molecules differing in size.
Acknowledgements
The authors wish to thank CW-NWO for financial support (Top grant), Dr Javier Ruiz-Martínez (Utrecht University, UU) for useful discussions, Katarina Stanciakova (UU) and Rosa Bulo (UU) for help with calculating the probe movement inside MFI pores and Ramon Oord (UU) and Pasi Paalanen (UU) for zeolite characterization.Notes and references
- A. F. Masters and T. Maschmeyer, Microporous Mesoporous Mater., 2011, 142, 423–438 CrossRef CAS.
- C. Martínez and A. Corma, Coord. Chem. Rev., 2011, 255, 1558–1580 CrossRef.
- B. Smit and T. L. M. Maesen, Nature, 2008, 451, 671–678 CrossRef CAS PubMed.
- T. F. Degnan, J. Catal., 2003, 216, 32–46 CrossRef CAS.
- S. M. Csicsery, Zeolites, 1984, 4, 202–213 CrossRef CAS.
- E. T. C. Vogt, G. T. Whiting, A. Dutta Chowdhury and B. M. Weckhuysen, Adv. Catal., 2015, 58, 291–292 Search PubMed.
- U. Olsbye, S. Svelle, M. Bjørgen, P. Beato, T. V. W. Janssens, F. Joensen, S. Bordiga and K. P. Lillerud, Angew. Chem., Int. Ed., 2012, 51, 5810–5831 CrossRef CAS PubMed.
- J. A. Martens, D. Verboekend, K. Thomas, G. Vanbutsele, J. Pérez-Ramírez and J.-P. Gilson, Catal. Today, 2013, 218–219, 135–142 CrossRef CAS.
- J. A. Martens, M. Tielen, P. A. Jacobs and J. Weitkamp, Zeolites, 1984, 4, 98–107 CrossRef CAS.
- J. A. Martens, M. Tielen and P. A. Jacobs, Catal. Today, 1987, 1, 435–453 CrossRef CAS.
- S. I. Zones and T. V. Harris, Microporous Mesoporous Mater., 2000, 35–36, 31–46 CrossRef CAS.
- J. Weitkamp, S. Ernst and R. Kumar, Appl. Catal., 1986, 27, 207–210 CrossRef CAS.
- L. I. Devriese, L. Cools, A. Aerts, J. A. Martens, G. V. Baron and J. F. M. Denayer, Adv. Funct. Mater., 2007, 17, 3911–3917 CrossRef CAS.
- V. J. Frillette, W. O. Haag and R. M. Lago, J. Catal., 1981, 67, 218–222 CrossRef CAS.
- K. S. W. Sing and R. T. Williams, Part. Part. Syst. Charact., 2004, 21, 71–79 CrossRef CAS.
- C. Lamberti, A. Zecchina, E. Groppo and S. Bordiga, Chem. Soc. Rev., 2010, 39, 4951–5001 RSC.
- J. Kärger, P. Kortunov, S. Vasenkov, L. Heinke, D. B. Shah, R. A. Rakoczy, Y. Traa and J. Weitkamp, Angew. Chem., Int. Ed., 2006, 45, 7846–7849 CrossRef PubMed.
- Q. Qian, J. Ruiz-Martínez, M. Mokhtar, A. M. Asiri, S. A. Al-Thabaiti, S. N. Basahel and B. M. Weckhuysen, Catal. Today, 2014, 226, 14–24 CrossRef CAS.
- P. Chen, X. Zhou, H. Shen, N. M. Andoy, E. Choudhary, K.-S. Han, G. Liu and W. Meng, Chem. Soc. Rev., 2010, 39, 4560–4570 RSC.
- G. De Cremer, B. F. Sels, D. E. De Vos, J. Hofkens and M. B. J. Roeffaers, Chem. Soc. Rev., 2010, 39, 4703–4717 RSC.
- E. Stavitski, M. H. F. Kox and B. M. Weckhuysen, Chem. – Eur. J., 2007, 13, 7057–7065 CrossRef CAS PubMed.
- A. Devaux, C. Minkowski and G. Calzaferri, Chem. – Eur. J., 2004, 10, 2391–2408 CrossRef CAS PubMed.
- Z. Ristanović, M. M. Kerssens, A. V. Kubarev, F. C. Hendriks, P. Dedecker, J. Hofkens, M. B. J. Roeffaers and B. M. Weckhuysen, Angew. Chem., Int. Ed., 2015, 54, 1836–1840 CrossRef PubMed.
- M. Busby, A. Devaux, C. Blum, V. Subramaniam, G. Calzaferri and L. De Cola, J. Phys. Chem. C, 2011, 115, 5974–5988 CAS.
- C. Seebacher, J. Rau, F.-W. Deeg, C. Bräuchle, S. Altmaier, R. Jäger and P. Behrens, Adv. Mater., 2001, 13, 1374–1377 CrossRef CAS.
- M. B. J. Roeffaers, R. Ameloot, M. Baruah, H. Uji-i, M. Bulut, G. De Cremer, U. Müller, P. A. Jacobs, J. Hofkens, B. F. Sels and D. E. De Vos, J. Am. Chem. Soc., 2008, 130, 5763–5772 CrossRef CAS PubMed.
- L. L. R. L. Aramburo, J. Ruiz-Martínez, J. P. Hofmann and B. M. Weckhuysen, Catal. Sci. Technol., 2013, 3, 1208–1214 CAS.
- M. H. F. Kox, E. Stavitski and B. M. Weckhuysen, Angew. Chem., Int. Ed., 2007, 46, 3652–3655 CrossRef PubMed.
- S. Lagergren, K. Sven. Vetenskapsakad. Handl., 1898, 24, 1–39 Search PubMed.
- Y. S. Ho, J. Hazard. Mater., 2006, 136, 681–689 CrossRef CAS PubMed.
- W. J. Weber Jr. and J. C. Morris, J. Sanit. Eng. Div., Am. Soc. Civ. Eng., 1963, 89, 31–59 Search PubMed.
- A. D. Becke, J. Chem. Phys., 1993, 98, 5648–5652 CrossRef CAS.
- C. Lee, W. Yang and R. G. Parr, Phys. Rev. B: Condens. Matter Mater. Phys., 1988, 37, 785–789 CrossRef CAS.
- M. Petitjean, J. Chem. Inf. Model., 1992, 32, 331–337 CrossRef CAS.
- M. Petitjean, Appl. Algebr. Eng. Commun. Comput., 2012, 23, 151–164 CrossRef.
- A. V. Marenich, A. Majumdar, M. Lenz, C. J. Cramer and D. G. Truhlar, Angew. Chem., Int. Ed., 2012, 51, 12810–12814 CrossRef CAS PubMed.
- M. J. Frisch, G. W. Trucks, H. B. Schlegel, G. E. Scuseria, M. A. Robb, J. R. Cheeseman, G. Scalmani, V. Barone, B. Mennucci, G. A. Petersson, H. Nakatsuji, M. Caricato, X. Li, H. P. Hratchian, A. F. Izmaylov, J. Bloino, G. Zheng, J. L. Sonnenberg, M. Hada, M. Ehara, K. Toyota, R. Fukuda, J. Hasegawa, M. Ishida, T. Nakajima, Y. Honda, O. Kitao, H. Nakai, T. Vreven, J. J. A. Montgomery, J. E. Peralta, F. Ogliaro, M. Bearpark, J. J. Heyd, E. Brothers, K. N. Kudin, V. N. Staroverov, R. Kobayashi, J. Normand, K. Raghavachari, A. Rendell, J. C. Burant, S. S. Iyengar, J. Tomasi, M. Cossi, N. Rega, J. M. Millam, M. Klene, J. E. Knox, J. B. Cross, V. Bakken, C. Adamo, J. Jaramillo, R. Gomperts, R. E. Stratmann, O. Yazyev, A. J. Austin, R. Cammi, C. Pomelli, J. W. Ochterski, R. L. Martin, K. Morokuma, V. G. Zakrzewski, G. A. Voth, P. Salvador, J. J. Dannenberg, S. Dapprich, A. D. Daniels, Ö. Farkas, J. B. Foresman, J. V. Ortiz, J. Cioslowski and D. J. Fox, Gaussian 09 (revision B.01), Gaussian, Inc., 2009 Search PubMed.
- J. Vandevondele, M. Krack, F. Mohamed, M. Parrinello, T. Chassaing and J. Hutter, Comput. Phys. Commun., 2005, 167, 103–128 CrossRef CAS.
- IZA, Database of Zeolite Structures, retrieved: 2 August, 2016.
- E. H. A. Beckers, S. C. J. Meskers, A. P. H. J. Schenning, Z. Chen, F. Würthner, P. Marsal, D. Beljonne, J. Cornil and R. A. J. Janssen, J. Am. Chem. Soc., 2006, 128, 649–657 CrossRef CAS PubMed.
- Y. Huang, T. Cheng, F. Li, C. H. Huang, T. Hou, A. Yu, X. Zhao and X. Xu, J. Phys. Chem. B, 2002, 106, 10020–10030 CrossRef CAS.
- S. Cicchi, P. Fabbrizzi, G. Ghini, A. Brandi, P. Foggi, A. Marcelli, R. Righini and C. Botta, Chem. – Eur. J., 2009, 15, 754–764 CrossRef CAS PubMed.
- T. Beppu, K. Tomiguchi, A. Masuhara, Y.-J. Pu and H. Katagiri, Angew. Chem., Int. Ed., 2015, 54, 7332–7335 CrossRef CAS PubMed.
- F. Gessner, A. Olea, J. H. Lobaugh, L. J. Johnston and J. C. Scaiano, J. Org. Chem., 1989, 54, 259–261 CrossRef CAS.
- T. R. Forester and W. Smith, J. Chem. Soc., Faraday Trans., 1997, 93, 3249–3257 RSC.
- J. Kärger, T. Binder, C. Chmelik, F. Hibbe, H. Krautscheid, R. Krishna and J. Weitkamp, Nat. Mater., 2014, 13, 333–343 CrossRef PubMed.
- S. S. Batsanov, Inorg. Mater., 2001, 37, 1031–1046 Search PubMed.
- Y. Liu and L. Shen, Langmuir, 2008, 24, 11625–11630 CrossRef CAS PubMed.
- S. Azizian, J. Colloid Interface Sci., 2004, 276, 47–52 CrossRef CAS PubMed.
- W. Plazinski, J. Dziuba and W. Rudzinski, Adsorption, 2013, 19, 1055–1064 CrossRef CAS.
- D. Borah, S. Satokawa, S. Kato and T. Kojima, J. Hazard. Mater., 2009, 162, 1269–1277 CrossRef CAS PubMed.
- K. Gupta and U. C. Ghosh, J. Hazard. Mater., 2009, 161, 884–892 CrossRef CAS PubMed.
- J. Chen, Y. Cai, M. Clark and Y. Yu, PLoS One, 2013, 8, 1–10 Search PubMed.
- V. Fierro, V. Torné-Fernández, D. Montané and A. Celzard, Microporous Mesoporous Mater., 2008, 111, 276–284 CrossRef CAS.
- J. van den Bergh, J. Gascon and F. Kapteijn, in Zeolites and Catalysis, Synthesis, Reactions and Applications, ed. J. Čejka, A. Corma and S. Zones, 2010, vol. 1, pp. 361–387 Search PubMed.
- A. P. Phillips, J. Org. Chem., 1949, 14, 302–305 CrossRef CAS PubMed.
- S. T. Abdel-Halim, J. Lumin., 2011, 131, 30–35 CrossRef CAS.
- F. Laeri, in Host-Guest-Systems Based on Nanoporous Crystals, ed. F. Laeri, F. Schüth, U. Simon and M. Wark, Wiley-VCH, Weinheim, 2003, p. 506 Search PubMed.
- K. Hoffmann, PhD thesis, Technischen Universität Berlin, 2002.
- X. Wang, Y. Zhou, G. Zhou, W. Jiang and M. Jiang, Bull. Chem. Soc. Jpn., 2002, 75, 1847–1854 CrossRef CAS.
- S. Uppili, K. J. Thomas, E. M. Crompton and V. Ramamurthy, Langmuir, 2000, 16, 265–274 CrossRef CAS.
- L. Gilbert and C. Mercier, in Heterogeneous Catalysis and Fine Chemicals III, ed. J. Barbier, J. Barrault, C. Bouchoule, D. Duprez, C. Montassier, M. Guisnet and G. Pérot, Elsevier, 1993, pp. 51–66 Search PubMed.
- D. Verboekend, M. Milina and J. Pérez-Ramírez, Chem. Mater., 2014, 26, 4552–4562 CrossRef CAS.
Footnotes |
| † Electronic supplementary information (ESI) available: Probe molecule syntheses as well as additional spectroscopic data, SEM images and details of the kinetic models used. See DOI: 10.1039/c6cp07572j |
| ‡ According to the original definition, SAPO-34 is not a zeolite, as it is not an aluminosilicate material. However, within the scope of this work there is no distinction between these so-called zeotype materials and zeolite materials as this work only deals with the relative size of the micropores. |
| § The HOMO–LUMO gap does not coincide with the absorption maximum of the probes; this is because the Kohn–Sham DFT model was used. |
| ¶ The enclosing cylinder used in the probes' size determination is only 1.5 times larger for probe molecule 3 than for probe 1. |
| || For probe molecule 1 in FAU 0.5 mmol g−1 is adsorbed (Fig. 3) while the amount of available acid sites is 1 mmol g−1 (Table 2). |
| This journal is © the Owner Societies 2017 |

