
 Open Access Article
 This Open Access Article is licensed under a
 Creative Commons Attribution 3.0 Unported Licence
A systematic computational study of the structure crossover and coordination number distribution of metallic nanoparticles†
Alexander V.
Myshlyavtsev‡
ab,
Pavel V.
Stishenko‡
 *a and
Anna I.
Svalova‡
a
*a and
Anna I.
Svalova‡
a
aOmsk State Technical University, Prospekt Mira 11, Omsk 644050, Russia. E-mail: PavelStishenko@yandex.ru; Fax: +7 3812 652379; Tel: +7 3812 652379
bInstitute of Hydrocarbons Processing SB RAS, 54 Neftezavodskaya, Omsk 644040, Russia
First published on 12th June 2017
Abstract
In this study, we identified stable configurations for three nanoparticle structure motifs (icosahedral, decahedral and cuboctahedral) of eight transition metals (Cu, Ag, Au, Pd, Ni, Rh, Ir, and Pt) ranging in size from 140 to 3000 atoms. We made simple yet precise analytical approximations of the energy of the stable configurations as a function of nanoparticle size and calculated the structure crossover sizes from these approximations. We then analyzed the surface structure of the nanoparticles in terms of the distribution of the coordination numbers and active sites. We found that low-coordinated atoms are most preferable for cuboctahedral forms and for lighter metals – Cu, Ni and Rh. Compared to other considered metals, gold nanoparticles exhibited unique features as follows: the least amount of low-coordinated atoms, the largest fraction of (111) faces on its surface and a concave reconstruction of five-fold vertices.
1 Introduction
1.1 Importance of nanoparticle shape and structure
Numerous applications have been proposed to take advantage of the unique physicochemical properties of metallic nanoparticles (NPs). However, to date, nanoscale heterogeneous catalysis has been most beneficial and widespread in practice. The dependency of the nanocatalyst parameters on the structural characteristics of the NPs attracts much attention from catalytic process developers. According to the Sabatier principle, catalyst efficiency is largely determined by the adsorption energy of the reacting agents. In turn, the adsorption energy is determined by the local geometry of the corresponding active sites (AS). Hence, the overall efficiency of the nanocatalysts depends on the distribution of the AS type, shape, structure and size of the NPs that constitute them.Numerous experimental and ab initio computation studies have shown the crucial importance of the size and shape of the NPs with respect to their catalytic activity and selectivity.1–9 For gold nanoparticles, we know1 that their catalytic activity in CO oxidation reactions is correlated with the number of low-coordinated atoms, which increases in smaller NPs. The kinetic parameters of the catalytic reaction between hexacyanoferrate(III) and thiosulfate ions on Pt nanoparticles are correlated with the fraction of atoms on the corners and edges.2 The styrene oxidation reaction on cubic Ag NPs is 14.4 times faster than on triangular plane NPs and 4.8 faster than on nearly spherical NPs, which is probably due to different activities of the (111) and (100) faces of Ag.3 The importance of step-edge sites in Co and Ru NPs has been demonstrated for the Fischer–Tropsch synthesis reaction.4,5
Mpourmpakis et al. showed that the adsorption energy of CO on Au depends on the coordination number (CN) of gold atoms.6 Moreover, they developed a simple quadratic expression for the adsorption energy as a function of the CN and curvature angle of the interacting metal atoms. Later, it was shown that the dependency of the adsorption energy on CNs also holds for supported Au NPs.7
More evidence of the catalytic reaction dependency on NP size and shape is referenced in the reviews by Cuenya and Behafarid.8,9 CN analysis can also be used to predict the melting temperature of the NPs.10
1.2 Review of relevant studies
Although the thermodynamic limits of the shape and structure of NPs are uniquely defined by the global minimum of potential energy, in practice, catalysts can be made from the NPs in metastable states with sufficiently long lifetimes. Experimental studies have shown that transition-metal NPs can be either regular face-centered cubic (FCC) crystals or comprise several twinned FCC crystallites.8,11,12 Single crystal (FCC) NPs take octahedral, tetrahedral, and cubic shapes and their truncated variations, non-crystalline NPs are usually represented by five-fold symmetry shapes, which are either icosahedral or decahedral.9,12–14 To refer to the groups of NP shapes with similar internal structure or symmetry the term “structural motif” is generally used in the literature.15–19The generic theoretical models proposed by Mackay,20 Ino21 and Marks22 have predicted the following: for the smallest NPs, the most stable shape is icosahedral; for larger NPs, the decahedral structural motif produces the global energy minimum; and for even larger NPs with sizes up to the bulk limit, cuboctahedral shapes with an FCC structure are the most stable. Later, it was shown11,23 that different symmetry structures are separated by fairly low-energy barriers. This means that the probabilities of the existence or coexistence of different structures are strongly determined by their potential energies.
To consider the importance of a NP's shape in catalyst design, we must know the preferential size ranges of different structure motifs, i.e., the NP's size ranges for which the corresponding motifs have the lowest potential energy. Although the Mackay,20 Ino21 and Marks22 models predict some of these ranges, they ignore the presence of high-index facets, surface defects and the mechanisms of twin-boundary relaxation. As the energy difference between the basic structural motifs is rather small, these factors can significantly shift the crossover thresholds. Atomic level models, in contrast, are able to consider all the geometrical degrees of freedom and thus provide much more reliable predictions.
Several studies have investigated structure crossover based on atomic-scale models. PdN and RhN (N = 13, 55, 147, 309, 561) NPs were studied via the tight-binding interaction model24 in which the predicted icosahedral–cuboctahedral crossover threshold for Rh was determined to be above 561 atoms and that for Pd was between 309 and 561. Moreover, in this study, the authors confirmed the existence of an energy barrier for NP sizes above 55 atoms. With respect to Au and Ag NPs, the energy minima were studied in the vicinity of ideal tetrahedral, octahedral, icosahedral, decahedral, truncated decahedral and truncated octahedral structures using the Sutton–Chen potential and molecular dynamics simulation.25 For Au NPs, the icosahedral shape was found to be the most stable shape up to 500 atoms, and thereafter, the shape is replaced by octahedral and truncated octahedral forms. These results significantly differ from those based on Ino's model, which predicts the preferentiability of icosahedral shapes up to a diameter of 10 nm, thus underscoring the need to use atomic-level models. For Ag NPs, the icosahedral shape was found to have the lowest energy for sizes less than 2000 atoms, and the truncated decahedral shape was found to be preferential for sizes ranging from 2000 to 30![[thin space (1/6-em)]](https://www.rsc.org/images/entities/char_2009.gif) 000 atoms, which switches to the cuboctahedral shape for larger sizes. We note that the global optimization of Ag NPs from 141 to 310 atoms with a special advanced algorithm (dynamic lattice searching with constructed core)26 has shown preference for a decahedral structure,26 which contradicts the predictions based on the study of ideal structures.25
000 atoms, which switches to the cuboctahedral shape for larger sizes. We note that the global optimization of Ag NPs from 141 to 310 atoms with a special advanced algorithm (dynamic lattice searching with constructed core)26 has shown preference for a decahedral structure,26 which contradicts the predictions based on the study of ideal structures.25
Baletto et al. studied crossovers between three NP shapes for five transition metals (Cu, Ag, Au, Pd and Pt).15 The authors studied NPs with sizes that correspond to configurations with complete external atomic shells, i.e. faces without defects, then quenched molecular dynamics with two many-body potentials was used for local relaxation. Given specific size selection the share of low-coordinated atoms on the surface of the NPs was not analyzed and the results were discussed in terms of facet area ratios.15
Recently, a similar study was conducted with respect to Au and Pd NPs16 in which cuboctahedral and decahedral structures were compared using several many-body potentials. A similar method was used to analyze Ni NPs' crossover, which also considered the presence of (110) faces.27 Ali et al.28 studied different shapes of Au NPs with an emphasis on the size dependency of different parameters (surface energy, melting point and distortion energy). We also have contributed to this area of research.29,30 We studied the relative stability of three shapes of eight transition-metal NPs (Cu, Ag, Au, Pd, Ni, Rh, Ir and Pt) using the tight-binding second-moment approximation scheme and the quantum Sutton–Chen (QSC) empirical potentials based on the local energy minimization of ideal shape structures.29 We also investigated Pt NPs' crossover between structural motifs taking into account different surface defects.30
1.3 Motivation for this study
The main goal of this study was to analyze distributions of surface atom coordination numbers with emphasis on low-coordinated atoms. These distributions significantly depend on the structure of the nanoparticles. All previous studies of a NP's structure crossover have either focused on one or two metals16,24,25–28,30 or considered a very narrow size range26 or only ideal shapes while ignoring high-index facets, steps, kinks and other surface defects.15,16,24,27,29 None of these studies considered distribution of coordination numbers of surface atoms in a systematic manner, while experimental work and theory suggest the crucial role of coordination numbers6,7 and especially low-coordinated atoms.2–5Systematic studies of the NPs of numerous metals with comparable results are necessary for the rational design of new catalysts. This approach has been shown to be effective in drug and materials development (QSAR,31 Materials Genome Initiative32). In response to this need, we conducted a systematic study of the stable configurations of eight transition-metal NPs (Cu, Ag, Au, Pd, Ni, Rh, Ir and Pt) and three structure motifs: icosahedral, decahedral and cuboctahedral. These motifs are frequently observed in experiments.8,9,12,33 The model of NPs that we employed here take into account the possibility of non-ideal forms, surface defects and high-index facets. To obtain stable configurations of the NPs we have conducted energy minimization procedures (see details below). The objective of our study did not include the identification of global energy minimum for each configuration, but we believe that configurations obtained from minimization procedures are representative samples of stable NP configurations. Further we refer to such a configuration as the “minimum energy configuration” or “energy minimum” meaning the best configuration we managed to obtain, but not the real global minimum. We have represented the obtained energies of stable states as a simple yet precise analytic approximate function of a NP's size and structure. We investigated the distribution of surface atom CNs as a function of a NP's size and structure, including low-coordinated atoms, which are especially important for catalysis.
2 Computational details
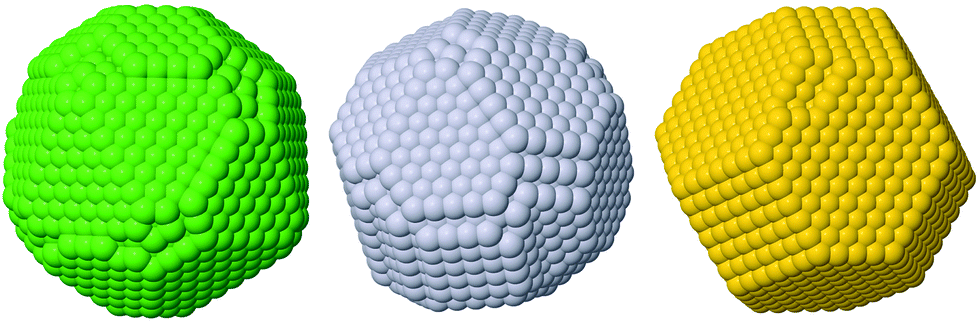
To compute the stable configurations for each structure motif, we performed two-stage optimization. At the first stage we used the Monte Carlo simulated annealing method in a lattice model framework. At the second stage we used non-lattice local optimization with the limited-memory Broyden–Fletcher–Goldfarb–Shanno34 method. It turned out that for a given metal, the size and structure motif non-lattice optimization stage lowered the potential energy of the metastable configurations by roughly the same value. In other words, the configuration that had the lowest energy among the other ones of the same kind before lattice relaxation still had the lowest energy after it. Therefore, for the second optimization stage we selected only one configuration with the lowest energy from all configurations generated during Monte Carlo simulation at the first stage.To construct the lattices for the first optimization stage we used locally optimized configurations of three ideal NP shapes: icosahedral and cuboctahedral constituted of 10179 atoms (from our previous work29) and decahedral constituted of 24831 atoms. Since lattices define the internal structure and symmetry of the NPs, further we use the term “structure motifs” to refer to these lattices. The cuboctahedral structure motif is a single crystal FCC lattice. Within this motif numerous different NP shapes can emerge: octahedral, tetrahedral, and all possible truncated variations, including irregular ones and even concave shapes, i.e. any possible shape compatible with a single FCC crystal. Icosahedral and decahedral motifs comprise 20 and 5 twinned FCC crystals, respectively. The decahedral motif is able to describe both Marks and Ino decahedrons, as way as any intermediate variations, including shapes with reentrant faces. Fig. 1 shows the largest simulated Au NP (3000 atoms) within the cuboctahedral lattice. Similar figures for icosahedral and decahedral lattices are provided in the ESI† (Fig. S9 and S10). It was crucial that the finite size of the lattices did not affect optimization results. Significantly elongated shapes seemed to be unfavorable due to Wulff construction. On the other hand, for all metals, sizes and structure motifs in optimized configurations there were no atoms on the outermost lattice sites. So, the lattices were supposed to be large enough.
 | ||
| Fig. 1 Au NP of 3000 atoms in the cuboctaheral lattice. Small white dots indicate free lattice sites. | ||
For our energy computations, we used the QSC potential.35 The potential parameters were fitted by Kimura et al.36,37 to reproduce the experimental values of average surface energy, vacancy formation energy, cohesive energy, elastic constants and phonon frequencies, which are crucial for the estimation of thermodynamic stability of NP configurations. Elastic constants and phonon frequencies are especially important for the prediction of coordination numbers due to their relation with contraction and elongation of chemical bonds. Surface energies are also of great importance for NP shape prediction, but there are no robust and systematic experimental data about surface energies of the metals considered here; therefore only average surface energy38 was used for QSC potential fitting. We have compared surface energies predicted with the QSC potential36 and with DFT as computed by Tran et al.39 Differences between the predictions of surface energies per surface atom are presented in Table 1. The largest absolute error is found for Rh(110) face- 363.9 meV per atom. This magnitude is comparable with DFT errors for surface energies (see comparison with experiments and previous studies by Tran et al.39). Moreover, for all metals QSC potential predicts the following ratio of surface energies: E111 < E100 < E110.36,37 This is consistent with the general idea that higher coordinated atoms should be more preferential. Thus, the QSC potential shows good agreement with experimental average surface energy, predicts surface energies within a typical DFT error range from DFT calculations and gives a reasonable ratio of surface energies for low-coordinated faces. So we hope that QSC potential is accurate enough for the purpose of our study.
| Element | E qsc − Edft (meV per atom) | ||
|---|---|---|---|
| 100 | 110 | 111 | |
| Ag | 75 | 103.1 | 43.3 |
| Au | −106.9 | −32.3 | −62.9 |
| Cu | 83.2 | 111.9 | 130.7 |
| Ir | −303.6 | −147 | 15.9 |
| Ni | −85.3 | −84.4 | 51.7 |
| Pd | −190.9 | −205.8 | −90.8 |
| Pt | −277.8 | −27.2 | −63.3 |
| Rh | 130.9 | 363.9 | 274.5 |
Based on our earlier work,29 we performed computations for sizes ranging from 140 to 3000 atoms, because for most of the metals studied structure crossover occurs within these boundaries. For the icosahedral and cuboctahedral structures of all the metals, we selected 36 size values uniformly distributed in the considered range. These sizes neither correspond to “magic” nor to complete external atomic shell size sequences, so the obtained NPs should exhibit different surface defects and irregularities. For all metals and NP sizes, potential energy values per atom, as obtained from the computations of the icosahedral and cuboctahedral motifs, appeared to be monotonic, smooth or had obvious trends, for example in Fig. 2 one can see that the results of computational experiments lie on very smooth lines and that 36 points are redundant for building approximations. Therefore, for the sake of economy, we selected a range of only six size values for the decahedral structure: 140, 300, 700, 1340, 2620, and 3000 atoms. To ensure that we do not miss any peculiarity due to size step coarseness we also performed computation for rhodium NPs for 144 uniformly distributed sizes ranging from 380 to 1100 atoms for all three structure motifs (see Fig. S3 (ESI†) and discussion below).
 | ||
| Fig. 2 Energy per atom as a function of a NP's size for platinum. Dots indicate computational experiments, lines indicate analytical approximations. Computed energies decrease with number of atoms very smoothly. Analytical approximations almost perfectly fit results of computational experiments. | ||
For the optimization of NP configurations at the lattice level of modeling we used the Metropolis Monte Carlo algorithm with the simulated annealing procedure.40 Simulated annealing helps avoid trapping in local minima and increases a chance to find real global minimum. We started the simulated annealing procedure from 3000 K. Such a high temperature was used to ensure that the initial NP shape does not influence the final result. The temperature was gradually lowered to 300 K. For all metals at 300 K temperature no diffusion takes place. The temperature was reduced each fifth Monte Carlo step by 100 K, 50 K or 10 K. A complete annealing schedule is shown in Table S2 (ESI†). For each size, metal and structure we conducted 16 independent computations and selected one configuration from 16 with the lowest energy for subsequent off-lattice optimization. Further we refer to the configurations obtained by this procedure as “minimum energy shapes”, keeping in mind that these are not necessary real global minima, but the best results we managed to get for the corresponding structure motifs. The obtained configurations are available in the ESI.†
3 Results and discussion
Through the course of simulation, a NP's energy quickly decreased and reached a plateau, which indicates the achievement of a metastable configuration (see the example in Fig. S11, ESI†). As expected from the theory, the calculated energies per atom as functions of a NP's size monotonically decreased and approached the cohesion energy of the corresponding metal. Fig. 2 shows plots of typical functions.The obtained stable configurations tend to approach ideal shapes (truncated cuboctahedron, decahedron, or icosahedron), but irregularities are inevitable for non-magic-number sizes. For typical examples, see Fig. 3.
 | ||
| Fig. 3 Examples of shapes with minimal energy we managed to find using icosahedral, decahedral and cuboctahedral lattices, NP's size: 2620 atoms. | ||
All obtained dependencies of the minimal energy per atom on a NP's size were very smooth and monotonic. As such, we approximated these dependencies using an analytical function based on the concepts of Wulff.41 According to Wulff, a NP's energy per atom should approach the cohesive energy with an infinite size limit, whereas the contributions of faces, edges and vertices to the total NP's energy should decay according to the corresponding power laws as follows:
 | (1) |
The residual plots for the cuboctahedral structure (Fig. S1, ESI†) show random patterns with variations from 0.0011 to +0.0015 eV, which indicate very good approximation quality. The residual plots for the icosahedral structure (Fig. 4) show pronounced peaks in the vicinity of atoms with magic numbers, whereas the absolute residual variation is very small, from 0.0072 to 0.0079 eV.
 | ||
| Fig. 4 Residuals plot of approximation eqn (1) parametrized by coefficients from Table S1 (ESI†) for the icosahedral structure motif of all metals. | ||
To further analyze the approximated residuals, we performed additional computations with finer size steps. We minimized all three motifs of Rh NPs using the procedure described above for 144 uniformly distributed sizes ranging from 380 to 1100 atoms. We also confirmed the residual patterns for the cuboctahedral and icosahedral structures. The decahedral motif residuals appear to be intermediate, exhibiting more spikes than the icosahedral but less pronounced (see Fig. S3, ESI†). The absolute value of the residuals does not exceed 0.01 eV for all sizes and motifs. The observed energy spikes near the magic sizes are similar to the oscillations reported earlier16 due to the excessive energy of Pd and Ag decahedral NPs.
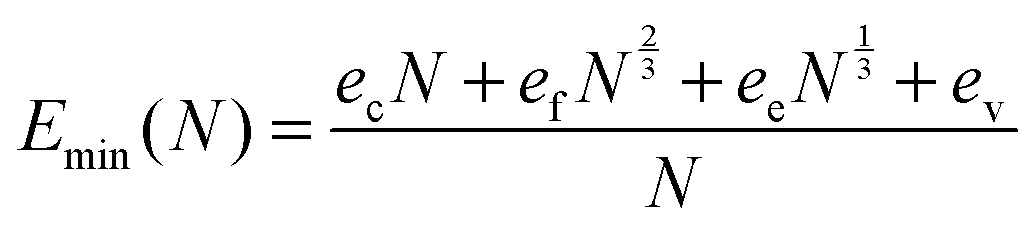
If approximation (1) was exact, then the ec coefficient would be equal to cohesive energy (Ecoh), because ec is an asymptote of Emin in the bulk limit. The differences ec − Ecoh are shown in Fig. 5. For all metals ec is lower than Ecoh and the differences are very similar for different structures of the same metals. The largest absolute deviation is for cuboctahedral Rh – 0.255 eV, the largest deviation relative to Ecoh is for cuboctahedral Cu – 5.1% of Ecoh. As the approximation (1) gives very good precision in the considered size range and the differences between ec and cohesive energies do not depend significantly on the NP structure, we suppose that this systematic error is due to some very large scale effect. This effect could be considered in approximation as an additional term, but it seems to be negligible at the nanoscale so we have preferred model simplicity to bulk limit precision.
 | ||
| Fig. 5 Differences between asymptotes of NP energy approximations ec and cohesive energies Ecoh. | ||
Using the obtained energy approximations, we calculated the stable structure transition thresholds, as listed in Table 2. Compared with earlier studies based on complete external shell models,15,16,27,29 our results indicate that the Dch–FCC transition (from decahedral to cuboctahedral structure) occurs at much smaller sizes for all metals. The Ico–Dch transition threshold shifted downward for Cu and Ni, shifted upward for Pd and is undefined for Pt and Au because they were too small in all cases. In general, the more realistic model allows more ways for relaxation to occur in decahedral structures and even more ways in cuboctahedral structures. Relaxation can occur via the reconstruction of five-fold symmetry vertices of icosahedral and decahedral NPs, via the formation of (110) and (331) faces instead of edges between (111) and (100) and via the formation of kinks on (111) faces (especially in FCC structures), as shown in Fig. 3 and 6. The absolute energy differences between decahedral and cuboctahedral shapes are very small in all metals, which suggests a high probability of the coexistence of these structures. The differences between icosahedral and decahedral motifs are also rather small for Cu and Ni but are significant for Ag, Ir, Pd and, especially, Au.
| Element | Ico–Dch | Dch–FCC |
|---|---|---|
| Ag | 235 | 3434 |
| Au | <140 | 1088 |
| Cu | 760 | 5786 |
| Ir | 184 | 2129 |
| Ni | 629 | 3279 |
| Pd | 182 | 2899 |
| Pt | <140 | 928 |
| Rh | 697 | 9277 |
It is interesting to note that absolute differences between asymptotes ec and cohesive energies Ecoh (Fig. 5) are larger for metals with largest transition sizes (Table 2). For example, rhodium with the highest absolute value of ec − Ecoh has the largest threshold for the Dch–FCC transition. Copper and nickel also manifest both a large ec − Ecoh difference and large threshold sizes for both Dch–FCC and Ico–Dch transitions. On the other hand, asymptotes of approximations for gold and platinum are very close to the corresponding Ecoh values and predicted transition sizes are the smallest for these metals. This observation supports the above mentioned idea that the difference between ec and Ecoh is caused by some large scale effect.
It should also be noted that stable configurations of the decahedral motif had reentrant faces, so their shapes are similar to the Marks decahedron. Although for some metals (Pd, for example) the depth of wedges at the twin boundaries is very small and that at the (100) faces is rather large, so in some cases it is hard to distinguish Marks and Ino decahedrons.
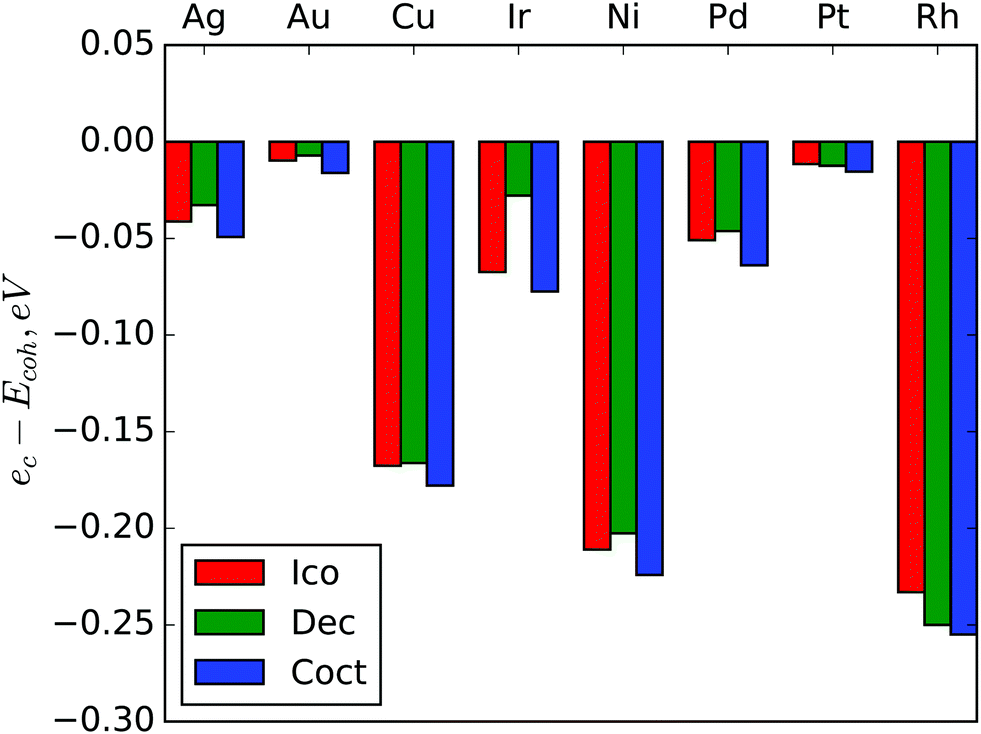
To predict the catalytic activity of NPs, we analyzed the distribution of the CNs of atoms for different faces, edges, vertices and near different defects of NPs. Fig. 6 shows typical examples. To discuss further, let px be the fraction of surface atoms with a coordination number equal to x.
 | ||
| Fig. 6 Ir (left) and Au (right) NPs of icosahedral, decahedral and cuboctahedral shapes (from up to down). Atoms are color coded according to their coordination numbers (CN): red – CN < 7, blue – CN = 7, gray – CN = 8, pink – CN = 9, light blue – CN = 10, white – CN = 11. | ||
Atoms with a CN = 9 constitute the (111) faces of NPs, which is a dominant surface atom type for all NP sizes, metals and structure motifs. In Fig. 7, we can see a change of p9 with the NP size. For the icosahedral structure, p9 clearly grows with the NP's size in all metals. For the decahedral and cuboctahedral structures, it is hard to identify definite trends in the corresponding plots of any of the metals, with one exception – in Au NPs, p9 grows with the NP's size up to 3000 atoms and probably further, similar to that observed for the icosahedral shape (see Fig. 8). For other metals the maximum of p9 in decahedral and cuboctahedral structures is reached in the range from 500 to 2000 atoms. To some extent the observed behavior can be explained from the Gibbs–Wulff theorem. Gold has the lowest ratio of the (111) surface energy to energies of other surfaces, so it shows the largest p9. Also for large cuboctahedral NPs one can distinguish Cu, Ni and Rh from other metals as they have the lowest p9 values, which is also consistent with the ratios of surface energies.
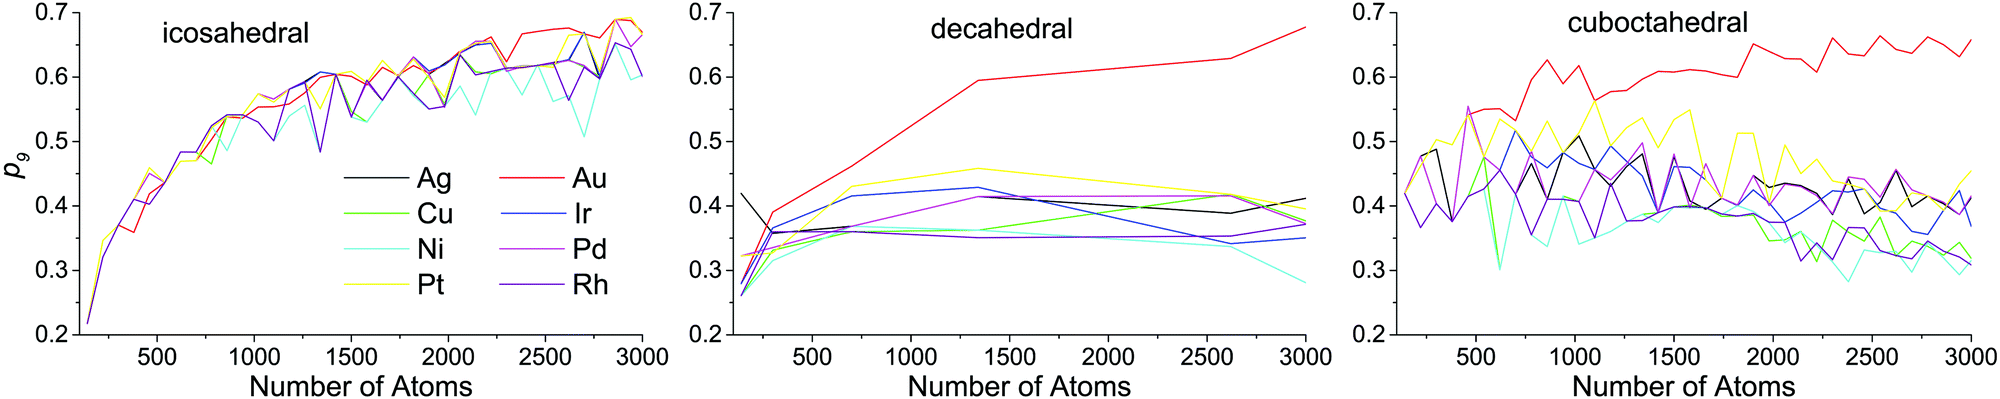 | ||
| Fig. 7 Ratio of the number of atoms with coordination numbers equal to 9 to the number of all surface atoms (p9) as a function of nanoparticle size. | ||
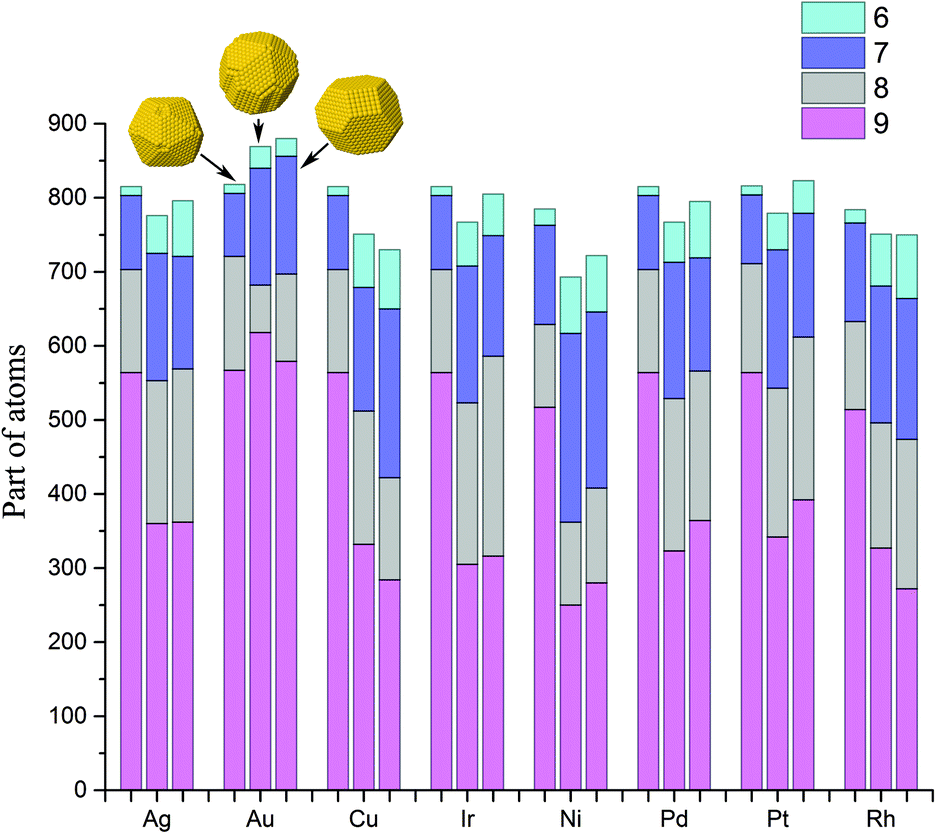 | ||
| Fig. 8 Distribution of the coordination numbers of surface atoms (CN from 6 to 9) for 3000-atom NPs. For each metal, the first bar corresponds to an icosahedral structure, the second bar to decahedral and the third bar to cuboctahedral. | ||
Atoms with a CN = 8 in FCC NPs constitute (100) faces. In icosahedral NPs, such atoms appear as edges between the (111) faces. In decahedral NPs, both variants are possible (see Fig. 6). Generally p8 does not exceed 30%, but for Pt and Au icosahedral NPs smaller than 500 atoms, p8 can be up to 40%. For the most, in the metals we considered, p8 increased with the NP size in cuboctahedral and decahedral forms and decreased in icosahedral forms. For NPs smaller than 1500 atoms, p8 was larger for the icosahedral shape and for NPs bigger than 1500 atoms p8 was the largest for the cuboctahedral shape. Au NPs exhibited unique properties: for decahedral structures, p8 decreased with the NP size and for all sizes the icosahedral shape had the largest p8 of all the forms. Compared to other metals, it seems that the (100) faces are least favorable for Au NPs.
Atoms with the CN = 7 exist in numerous variations: as edges between (111) faces, as edges between (111) and (100) faces, as a (110) face between (111) faces, as a (331) face between (111) and (100) faces and as faces in formed rather than truncated five-fold vertices. It is interesting to note that atoms with the CN = 7 appear as edges between (111) faces due to incompleteness of faces of five-fold shapes, at sizes corresponding to the intermediate stages of the growth of NP layers. Similar deviations from ideal shapes were observed in one- and two-layer-island mechanisms of the growth of metastable silver icosahedra by Baletto et al.42 Hence, p7 cannot serve as a good descriptor of the surface structure and it is difficult to analyze its dependency based on the NP's size. However, we can estimate the separate contributions of (110) and (331) faces (and the CN = 7 atoms therein) in an overall NP's surface by the share of atoms with CN = 11 and CN = 10 (p10+11), which constitute the second layers of the corresponding faces. Fig. S5 (ESI†) shows the dependency of p10+11 based on the NP's size. According to the p10+11 values, all metals can be divided into three definite groups: metals with highly preferential (110) and (331) faces – Cu, Ni and Rh; metals with average preferentiability of (110) and (331) faces – Pd, Pt, Ag and Ir; and the metal effectively prohibiting (110) and (331) faces – Au. Fig. 10 shows typical examples of these groups. We note that (110) and (331) faces are so unfavorable for Au that five-fold vertices are more readily reconstructed with concaves than CN = 7 atoms, as shown in Fig. 9. It is interesting to note that a strong tendency of Au to reconstruct five-fold vertices was observed earlier for Au nanoclusters by Apra et al.43 and AuAg NPs by Gould et al.17
 | ||
| Fig. 9 Reconstruction of a five-fold vertex in gold (left) and copper (right) nanoparticles. | ||
 | ||
| Fig. 10 Nanoparticles with different preferentiabilities for (110) and (331) faces: Au (left), Ag (center) and Ni (right). (110) faces are constituted by atoms with CN = 7 (blue) and CN = 11 (white). (331) faces are constituted by atoms with CN = 7 (blue) and CN = 10 (light blue). | ||
Atoms with CN ≤ 6 are of special interest, because atoms with lower CN generally manifest lower adsorption energies, which means stronger adsorbate binding.44 According to the Brønsted–Evans–Polanyi principle45 adsorption energy in turn is linearly connected with the activation barriers of the reaction steps. Hence atoms with CN ≤ 6 can catalyze reactions with high activation barriers. There is evidence of high catalytic activity of such atoms for steam methane activation and reforming on platinum,46,47 alkane hydrogenolysis,48,49 and carbon monoxide methanation on nickel.50 For all the structure motifs the fraction of such atoms (p≤6) expectedly decays with the growth of the NPs (see Fig. 11). This is because such atoms appear as vertices and the neighbors of defects that tend to be constant in number for any size of a NP. It is interesting that for the icosahedral shape, we can see pronounced falls in p≤6 near magic numbers (147, 309, 561, 923, 1415, 2057, and 2869), which is probably due to the absence of defects in ideal closed-shell configurations. For decahedral and cuboctahedral forms, the dependencies of p≤6 on the NP's size are equivalent both qualitatively and quantitatively. Au NPs stand out from the other metals in this case as well: p≤6 decays significantly faster than in other metals, approaching the lower asymptote.
 | ||
| Fig. 11 Ratio of the number of atoms with coordination numbers less than or equal to 6 to the number of all surface atoms (p≤6) as a function of nanoparticle size. | ||
Next, we analyzed the differences in the CN distributions of different structure motifs in the vicinity of crossover sizes for those metals in which the crossover sizes appeared to be in the investigated interval (from 140 to 3000 atoms): icosahedral–decahedral transition: Ag, Cu, Ir, Ni, Pd and Rh and the decahedral–cuboctahedral transition: Au, Ir, Pd and Pt. We found that for all analyzed metals there was no significant change in the CN distribution for the decahedral–cuboctahedral transition (see, for example, Fig. S7, ESI†). Conversely, for all metals with an icosahedral–decahedral transition in the 140–3000 range, there was a pronounced change in the CN distribution pattern: p≤6 and p7 tend to grow, mostly at the expense of p9 (see, for example, Fig. S8, ESI†).
4 Conclusions
In this study, we identified the local energy minima of three typical structure motifs in eight transition metals. For the first time, we systematically investigated the structure motif crossover of numerous metals while taking into account surface defects, incomplete atomic shells and reconstructions near vertices. Consideration of these surface peculiarities is necessary for the analysis of the coordination number distributions of surface atoms, which are of practical importance for catalysis. Compared to earlier studies, the predicted threshold of transition from a decahedral to cuboctahedral shape is much smaller for all metals. We obtained simple yet precise analytic expressions for the energy of the metastable configurations. Residual plots show the tendency of five-fold structures (especially icosahedral structures) to be more stable in the vicinity of the ‘magic’ numbers of atoms (147, 309, 561, 923 etc.). This is probably caused by the fewer opportunities to form a configuration with a complete and defectless external atomic layer.Our analysis of the coordination number distributions reveals that gold differs significantly from the other metals considered, exhibiting a much larger preferentiability of atoms with a coordination number of 9, i.e. (111) faces. Conversely, the low-coordinated atoms of gold NPs are much less favorable, even causing the formation of concaves on five-fold vertices. This contrasts with other metals that tend to reconstruct such vertices with high-index facets. The largest number of low-coordinated atoms and high-index facets occur in lighter metals – copper, nickel and rhodium. The other metals we considered exhibited an intermediate number of low-coordinated atoms, closer to that of gold in their order of enumeration: palladium, iridium, silver and platinum. For all metals considered, with the exception of gold, decahedral and cuboctahedral structures exhibit the largest fraction of (111) faces in the size range from 500 to 2000 atoms, the fraction of (110) and (331) faces grows beyond 3000 atoms, the fraction on (100) faces is the largest in the icosahedral structure for NP sizes below 1500 atoms and is the largest in the cuboctahedral structure for NP sizes above 1500 atoms. We recommend catalyst developers to consider these results to obtain thermodynamically stable nanocatalysts.
Our structure transition analysis shows an insignificant change in the coordination number distribution of decahedral–cuboctahedral transitions and a significant growth of atoms with a CN ≤ 7 for icosahedral–decahedral transitions. From this result, our general recommendation for catalyst developers is to prefer icosahedral shapes for reactions that are expected to occur on high-coordinated atoms and decahedral or cuboctahedral shapes for reactions that occur better on low-coordinated atoms.
Acknowledgements
This study was supported by the Ministry of Education and Science of the Russian Federation on a budget-funded basis for 2014-2016 (project no. 16.2413.2014/K).References
- B. Hvolbæk, T. Janssens, B. Clausen, H. Falsig, C. Christensen and J. Nørskov, Nano Today, 2007, 2, 14–18 CrossRef.
- R. Narayanan and M. A. El-Sayed, Nano Lett., 2004, 4, 1343–1348 CrossRef CAS.
- R. Xu, D. Wang, J. Zhang and Y. Li, Chem. – Asian J., 2006, 1, 888–893 CrossRef CAS PubMed.
- R. A. van Santen, M. M. Ghouri, S. Shetty and E. M. H. Hensen, Catal. Sci. Technol., 2011, 1, 891–911 CAS.
- S. G. Shetty, I. M. Ciobica, E. J. M. Hensen and R. A. van Santen, Chem. Commun., 2011, 47, 9822–9824 RSC.
- G. Mpourmpakis, A. N. Andriotis and D. G. Vlachos, Nano Lett., 2010, 10, 1041–1045 CrossRef CAS PubMed.
- M. G. Taylor, N. Austin, C. E. Gounaris and G. Mpourmpakis, ACS Catal., 2015, 5, 6296–6301 CrossRef CAS.
- B. R. Cuenya, Thin Solid Films, 2010, 518, 3127–3150 CrossRef CAS.
- B. Roldan Cuenya and F. Behafarid, Surf. Sci. Rep., 2015, 70, 135–187 CrossRef CAS.
- M. Mirjalili and J. Vahdati-Khaki, J. Phys. Chem. Solids, 2008, 69, 2116–2123 CrossRef CAS.
- T. P. Martin, Phys. Rep., 1996, 273, 199–241 CrossRef CAS.
- L. Marks, Rep. Prog. Phys., 1994, 57, 603 CrossRef CAS.
- C. R. Henry, Prog. Surf. Sci., 2005, 80, 92–116 CrossRef CAS.
- A. Mayoral, H. Barron, R. Estrada-Salas, A. Vazquez-Duran and M. José-Yacamán, Nanoscale, 2010, 2, 335–342 RSC.
- F. Baletto, R. Ferrando, A. Fortunelli, F. Montalenti and C. Mottet, J. Chem. Phys., 2002, 116, 3856–3863 CrossRef CAS.
- A. J. Logsdail, Z. Li and R. L. Johnston, Phys. Chem. Chem. Phys., 2013, 15, 8392–8400 RSC.
- A. L. Gould, K. Rossi, C. R. A. Catlow, F. Baletto and A. J. Logsdail, J. Phys. Chem. Lett., 2016, 7, 4414–4419 CrossRef CAS PubMed.
- I. Atanasov, R. Ferrando and R. L. Johnston, J. Phys.: Condens. Matter, 2014, 26, 275301 CrossRef PubMed.
- F. Baletto and R. Ferrando, Rev. Mod. Phys., 2005, 77, 371–423 CrossRef CAS.
- A. Mackay, Acta Crystallogr., 1962, 15, 916–918 CrossRef CAS.
- S. Ino, J. Phys. Soc. Jpn., 1969, 27, 941–953 CrossRef CAS.
- L. D. Marks, Philos. Mag. A, 1984, 49, 81–93 CrossRef CAS.
- J. Aragón, Chem. Phys. Lett., 1994, 226, 263–267 CrossRef.
- C. Barreteau, M. Desjonqueres and D. Spanjaard, Eur. Phys. J. D, 2000, 11, 395–402 CrossRef CAS.
- B. Wang, M. Liu, Y. Wang and X. Chen, J. Phys. Chem. C, 2011, 115, 11374–11381 CAS.
- W. Huang, X. Lai and R. Xu, Chem. Phys. Lett., 2011, 507, 199–202 CrossRef CAS.
- C. L. Cleveland and U. Landman, J. Chem. Phys., 1991, 94, 7376–7396 CrossRef CAS.
- S. Ali, V. Myasnichenko and E. Neyts, Phys. Chem. Chem. Phys., 2016, 18, 792–800 RSC.
- A. Myshlyavtsev and P. Stishenko, Adsorption, 2013, 19, 795–801 CrossRef CAS.
- A. Svalova and P. Stishenko, Procedia Eng., 2015, 113, 429–434 CrossRef CAS.
- C. Selassie, History of quantitative structure–activity relationships, in Burger's Medicinal Chemistry and Drug Discovery, ed. D. Abraham, Wiley Online Library, 2003, pp. 1–48 Search PubMed.
- A. Jain, S. P. Ong, G. Hautier, W. Chen, W. D. Richards, S. Dacek, S. Cholia, D. Gunter, D. Skinner and G. Ceder, et al. , APL Mater., 2013, 1, 011002 CrossRef.
- A. Ruditskiy, H.-C. Peng and Y. Xia, Annu. Rev. Chem. Biomol. Eng., 2016, 7, 327–348 CrossRef CAS PubMed.
- J. Nocedal, Mathematics of Computation, 1980, 35, 773–782 CrossRef.
- A. Sutton and J. Chen, Philos. Mag. Lett., 1990, 61, 139–146 CrossRef.
- Y. Kimura, Y. Qi, T. Cagin and W. Goddard III, The quantum Sutton–Chen many-body potential for properties of fcc metals, California institute of technology CalTech ASCI Technical Report 003, Pasadena, 1998.
- T. Cagin, Y. Qi, H. Li, Y. Kimura, H. Ikeda, W. Johnson and W. Goddard, MRS Symp Ser, 1999, pp. 43–48 Search PubMed.
- W. Tyson and W. Miller, Surf. Sci., 1977, 62, 267–276 CrossRef CAS.
- R. Tran, Z. Xu, B. Radhakrishnan, D. Winston, W. Sun, K. A. Persson and S. P. Ong, Scientific Data, 2016, 3, 160080 CrossRef CAS PubMed.
- D. Frenkel and B. Smit, Understanding molecular simulation: from algorithms to applications, Academic press, 2001, vol. 1 Search PubMed.
- G. Wulff, Z. Kristallogr. – Cryst. Mater., 1901, 34, 449–530 CAS.
- F. Baletto, C. Mottet and R. Ferrando, Phys. Rev. B: Condens. Matter Mater. Phys., 2001, 63, 155408 CrossRef.
- E. Aprà, F. Baletto, R. Ferrando and A. Fortunelli, Phys. Rev. Lett., 2004, 93, 065502 CrossRef PubMed.
- R. A. van Santen and M. Neurock, Reactivity Index Relations in Theoretical Heterogeneous Catalysis, in Handbook of Heterogeneous Catalysis, ed. G. Ertl, H. Knoezinger, F. Schueth and J. Weitkamp, Wiley-VCH Verlag GmbH & Co. KGaA, 2008, pp. 1415–1445 Search PubMed.
- R. A. van Santen, Molecular Catalytic Kinetics Concepts, in Novel Concepts in Catalysis and Chemical Reactors, ed. A. Cybulski, J. A. Moulijn and A. Stankiewicz, Wiley-VCH Verlag GmbH & Co. KGaA, 2010, pp. 1–30 Search PubMed.
- F. Viñes, Y. Lykhach, T. Staudt, M. Lorenz, C. Papp, H.-P. Steinrück, J. Libuda, K. M. Neyman and A. Görling, Chem. – Eur. J., 2010, 16, 6530–6539 CrossRef PubMed.
- T. Zhu, P. W. van Grootel, I. A. Filot, S.-G. Sun, R. A. van Santen and E. J. Hensen, J. Catal., 2013, 297, 227–235 CrossRef CAS.
- S. M. Davis, F. Zaera and G. A. Somorjai, J. Am. Chem. Soc., 1982, 104, 7453–7461 CrossRef CAS.
- L. Falicov and G. Somorjai, Proc. Natl. Acad. Sci. U. S. A., 1985, 82, 2207–2211 CrossRef CAS.
- M. Andersson, F. Abild-Pedersen, I. Remediakis, T. Bligaard, G. Jones, J. Engbæk, O. Lytken, S. Horch, J. H. Nielsen and J. Sehested, et al. , J. Catal., 2008, 255, 6–19 CrossRef CAS.
Footnotes |
| † Electronic supplementary information (ESI) available: Stable configurations of nanoparticles with computed energies in the XYZ format. See DOI: 10.1039/c6cp07571a |
| ‡ These authors contributed equally to this work. |
| This journal is © the Owner Societies 2017 |