
 Open Access Article
 This Open Access Article is licensed under a
 Creative Commons Attribution 3.0 Unported Licence
A kinetic model of water adsorption, clustering and dissociation on the Fe3S4{001} surface†
Alberto
Roldan
 *a and
Nora H.
de Leeuw
ab
*a and
Nora H.
de Leeuw
ab
aSchool of Chemistry, Cardiff University, Main Building, Park Place, Cardiff, CF10 3AT, UK. E-mail: roldanmartineza@cardiff.ac.uk; deLeeuwN@cardiff.ac.uk
bDepartment of Earth Sciences, Utrecht University, Princetonplein 9, 3584 CC, Utrecht, The Netherlands
First published on 6th April 2017
Abstract
The interaction of water with catalyst surfaces is a common process which requires investigation. Here, we have employed density functional theory calculations to investigate the adsorption of up to ten water molecules on the {001} surface of greigite (Fe3S4), which owing to its redox properties, is of increasing interest as a catalyst, e.g. in electro-catalysis. We have systematically analyzed and characterized the modes of water adsorption on the surface, where we have considered both molecular and dissociative adsorption processes. The calculations show that molecular adsorption is the predominant state on these surfaces, from both a thermodynamic and kinetic point of view. We have explored the molecular dispersion on the surface under different coverages and found that the orientation of the molecule, and therefore the surface dipole, depends on the number of adsorbed molecules. The interactions between the water molecules become stronger with an increasing number of water molecules, following an exponential decay which tends to the interaction energy found in bulk water. We have also shown the evolution of the infra-red signals as a function of water coverage relating to the H-bond networks formed on the surface. Next we have included these results in a classical micro-kinetic model, which introduced the effects of temperature in the simulations, thus helping us to derive the water cluster size on the greigite surface as a function of the initial conditions of pressure, temperature and external potential. The kinetic model concluded that water molecules agglomerate in clusters instead of wetting the surface, which agrees with the low hydrophilicity of Fe3S4. Clusters consisting of four water molecules was shown to be the most stable cluster under a wide range of temperatures and external potential.
1 Introduction
Understanding the properties of water at the interface with solids is of crucial importance in many areas of fundamental research and applications. Apart from the direct role of water in many (photo-)catalytic surface reactions, water–surface interactions play an intrinsic role in the description of electrochemical interfaces and in understanding wetting and corrosion, as well as fuel cell reactions which are of increasing contemporary interest due to environmental concerns.1 The properties of water manifest themselves in a variety of important applications, such as catalysis, electrochemistry, materials science, electronic devices, photo-catalysis and photo-conversion, corrosion, geochemistry, adhesion, sensors, tribology, astrophysics and astro-chemistry, and even membrane science.2A major objective in studying water–surface interactions is to determine whether water is adsorbed molecularly or dissociatively on the surface. The chemical properties of the water dissociation products (OH−, H+ and O2−) are very different from that of the water molecule and may lead, for example, to the surface and bulk oxidation of many materials.2,3 The occurrence or not of the dissociation of the water molecule at the surface has significant implications for many chemical processes and also reveals much about the reactivity of a surface towards other chemical processes.4–6 Molecular H2O can be used to probe site-specific structure–reactivity relationships, especially on oxides and semiconductors, but to distinguish H2O from OH experimentally is complicated owing to the similarities in many of the properties of these two species. Identifying irreversible water dissociation is considerably easier than reversible water dissociation, since the former is usually accompanied by modifications of the host substrate (e.g., oxide formation).1
There is an extensive literature on water–metal1,2 and water–oxide interphases,7 describing processes such as surface stability8–14 and preferred direction for surface growth of minerals.15–18 Generally, the dynamic processes of H2O interaction with surfaces remain poorly understood, even for the extensively studied Fe3O4, due to the difficulties in the preparation of well-characterized single crystal surfaces.19 On Fe3O4, the oxide isomorph of greigite,20 different adsorption modes have been identified upon its interaction with water: dissociative chemisorption and, at higher coverage, physisorbed H2O in a condensed ice conformation,21,22 in agreement with molecular dynamics models.17,23 Studies using methods based on the density functional theory (DFT) have reported exothermic molecular and dissociative adsorption of one H2O on a Fe-terminated Fe3O4{111} surface24,25 and a hydrogen-bonded second water molecule which through its oxygen forms a hydronium ion-like structure.26 Hence, water molecules provide not only a reaction environment but also hydrogen, hydroxy and/or oxygen subspecies which can react further at the catalyst interface. Understanding processes like the synergetic adsorption and its implications on water dissociation is crucial for the development of high-performance catalysts.27,28
Water may bind to a surface through a variety of means, e.g. via electrostatics, charge transfer or hydrogen-bonding, and it has been detected on surfaces in the form of monomers, dimers, larger multimers, 2D bilayers, 3D clusters and a variety of ice structures.1,2 Clustered water is characterized by the presence of hydrogen-bonds between two or more neighboring water molecules. Owing to this ability to form hydrogen-bonding networks, water displays a variety of structures associated with clustering that span from dimers to liquid water and the diverse structures of the solid. Theoretical studies vary on the precise details of the adsorption geometry of small water clusters, although the formation of closed ring structures is generally accepted and has been verified experimentally by molecular beam electric deflection and microwave studies.29,30 At sub-monolayer coverage, water is known to diffuse on metal surfaces based on its clustering behavior.2 However, water clustering behavior is less clear on surfaces where water is strongly adsorbed, as for example on an oxide.31,32 In these cases, the minimum barrier of water diffusion from cation site to cation site, involves aligning its molecular dipole to the electronic corrugation between the two sites, but water interaction with both the substrate and other molecules dictates its orientation. Computer models are a valuable tool to identify the species on the surface, the energetics and the dipole involved in the water diffusion and clustering. In the following sections, we discuss the adsorption and dissociation of water on the Fe3S4{001} surface as a function of coverage. This surface has been identified experimentally in synthetized greigite that was used as an electro-catalyst33 and understanding of the water–surface interface is crucial to understand the surface behavior under electro-chemical conditions. To this end, we have investigated different arrangements of the molecules, i.e. dispersed and in clusters, and implemented the results in a micro-kinetic model to close the gap between electronic structure calculations and experiment under specific conditions of temperature and water pressure.
2 Computational details
The greigite mineral (Fe3S4) has an inverse spinel-structure, which is analogous to magnetite,20 with a face-centered cubic structure and space group Fd![[3 with combining macron]](https://www.rsc.org/images/entities/char_0033_0304.gif) m, see Fig. S1 (ESI†). The cubic unit cell contains eight units of Fe3S4 where the 32 anions are in a cubic close-packed arrangement, while eight of the tetrahedral sites and sixteen of the octahedral ones are occupied by the cations. The different cation arrangements of the thio-spinel formula can be rewritten as FeA(FeB)2S4, where A and B denote tetrahedral and octahedral sites respectively.20,34 The high-spin alignment is antiparallel, leading to a half metallic character of the material, owing to the presence of Fe(II) in the octahedral sites. Hence, greigite has metallic properties along the one spin channel, whilst it presents a band gap along the other spin channel.
m, see Fig. S1 (ESI†). The cubic unit cell contains eight units of Fe3S4 where the 32 anions are in a cubic close-packed arrangement, while eight of the tetrahedral sites and sixteen of the octahedral ones are occupied by the cations. The different cation arrangements of the thio-spinel formula can be rewritten as FeA(FeB)2S4, where A and B denote tetrahedral and octahedral sites respectively.20,34 The high-spin alignment is antiparallel, leading to a half metallic character of the material, owing to the presence of Fe(II) in the octahedral sites. Hence, greigite has metallic properties along the one spin channel, whilst it presents a band gap along the other spin channel.
2.1 DFT calculations
We have carried out a systematic DFT-D2 study of the interaction of water (up to 10 molecules) with the Fe3S4{001} surface. All calculations were performed using the Vienna Ab-initio Simulation Package (VASP).35,36 The Kohn–Sham valence states were expanded in a plane-wave basis set with a cut off at 600 eV for the kinetic energy,37 where the ion–electron interactions were represented by the projector-augmented wave (PAW) method.38 This high value for the cut off energy ensured that no Pulay stresses occurred within the cell during relaxations. The electron exchange–correlation was calculated within the generalized gradient approximation (GGA) with the Perdew–Wang functional (PW91),39 employing the spin interpolation formula of Vosko et al.40 All the calculations included the long-range dispersion correction approach by Grimme,41 which is an improvement on pure DFT when considering large polarizable atoms,27,42–46 although it may also overestimate the binding energies.47 We have used the global scaling factor parameter optimized for PBE (s6 = 0.75). The initial magnetic moments were described with high-spin distributions in both types of Fe, i.e. octahedral (B) and tetrahedral (A) Fe in the FeA(FeB)2S4 spinel structure, by a ferrimagnetic orientation.20,48 We have employed Monkhorst–Pack grids of 4 × 4 × 1 K-points, which ensured electronic and ionic convergence.49We have used the Hubbard-like approximation (U) for a more accurate treatment of the electron correlation in the localized d-Fe orbital of this transition metal.50,51 It improves the description of localized states in this type of systems where standard LDA and GGA functionals fail.52 A problem with this approximation is the rather empirical character of the choice of U parameter, a feature which also appears when using hybrid functionals, since the amount of Fock exchange is system-dependent.52–55 Following the approach used by Devey et al.,56 we have employed Ueff = 1 eV which has been tested to give reliable data for catalytic processes.33,57 The geometries of all stationary points were found with the conjugate-gradient algorithm and considered converged when the force on each ion dropped below 0.03 eV Å−1, whereas the energy threshold, which defines self-consistency of the electron density, was set to 10−5 eV. In order to improve the convergence of the Brillouin-zone integrations, the partial occupancies were determined using the tetrahedron method with Blöchl correction smearing, with a set width for all calculations of 0.02 eV. These smearing techniques can be considered as a form of finite-temperature DFT.37
2.2 Slab model
The Fe3S4 surfaces were prepared using the METADISE code to cut the bulk structure and create slab models.58 METADISE not only considers periodicity in the plane direction but also provides the different atomic layer stackings resulting in a null dipole moment perpendicular to the surface plane.59 The {001} surface was represented by a slab with an area of 81.0 Å2, containing 56 atoms (24 Fe and 32 S) per unit cell with a vacuum width of 12 Å between periodic slabs, which is big enough to avoid interactions between the slab and its images. The slabs are also thick enough to relax the four uppermost Fe3S4 units until energy convergence, keeping the bottom layer frozen to model the bulk structure. To obtain the properties of an isolated H2O molecule, we placed it in the center of a 15 × 16 × 17 Å3 simulation cell to avoid lateral interactions and using the same criteria of convergence as for the iron sulfide slabs.2.3 Characterization
We have described the atomic charges and derived magnetic moment by means of a Bader analysis,60,61 where the electron and spin density associated with each atom is integrated over the Bader volume of the atom in question, as implemented in the Henkelman algorithm.62 Thus, due to the changes in the effective atomic radii with the oxidation state of the ion, the Bader volume is not calculated as a sphere of constant radius but is charge density dependent. Even so, the electron delocalization of the DFT method leads to an underestimation of the formal charges, although they can be used effectively in a direct comparison and to monitor changes in charges, for example as an effect of surface adsorption.We have characterized each system by vibrational frequencies using the implemented numerical method in VASP, which takes finite displacements for every coordinate, and evaluates the second derivatives from the variation of the energy gradients in these displacements. In the harmonic approximation, these displacements have to be big enough to make a substantial variation of the energy in order to minimize the numerical errors in the calculation of the derivatives, but they have to be small enough to ensure vibrations in the harmonic regime. The eigenvalues of the diagonal Hessian matrix are the vibrational frequencies and the eigenvectors are the vibrational normal modes of the system. As strong adsorption at a surface may lead to the perturbation of the adsorbent's vibrations, we have considered the frequencies of water on the Fe3S4{001} surface decoupled from the surface phonons, in agreement with its weak interaction. The surface selection rule requires that the dynamic dipoles have a component perpendicular to the surface in order for resonant absorption to occur, the absorption intensity being related to the strength of the dynamic dipole. The adsorption symmetry of the molecule dictates whether or not a mode is infra-red (IR) active (dipole allowed) and so, for certain symmetries, even water modes with a net atomic motion parallel to the surface formally become dipole-allowed.63 The difficulty with the IR approach is that the vibrational frequencies are only a guide to the strength of the hydrogen-bond and hence also the O–O separation, and it is entirely possible that on a surface, a different local configuration leads to the same vibrational frequency.64 Frequency changes can be caused by intrinsic structural changes due to adsorption on the surface, mechanical re-normalization of the frequencies due to bonding with the surface, dipole–dipole coupling, or the coupling of vibrational and electronic states.
Dissociation of the molecule was also studied, leading to hydroxyl and hydrogen species co-adsorbed on the surface. The products are linked to the reactants by a single saddle point, the transition state (TS), which determines the kinetics of the process. Transition states were identified by means of the dimer method,65,66 which searches for the TS by giving an initial atomic velocity towards the particular final state (product(s)). From an initial configuration, we generated the initial velocities by making two equal and opposite small finite-difference displacements in the coordinates of the reactant molecule. The method then finds a nearby saddle point by rotation and translation steps implemented by a conjugate gradient optimizer. The saddle point thus identified (TS) was confirmed by a vibrational frequency calculation, in which only one imaginary frequency is obtained, corresponding to the reaction coordinate. Afterwards, the dimer images are relaxed to the neighboring local minima. In a successful search, one of the images will minimize into the initial state and the other will become the final state. We could then define the energy barrier (EA) for the dissociation process as the difference between the initial state (adsorbed molecule) and transition state (TS). The reaction energy (ER) is the total energy difference between the final state (products) and the initial state (reactants).
We have calculated the binding energies (EB) per molecule on the Fe3S4 surfaces viaeqn (1).
 | (1) |
 | (2) |
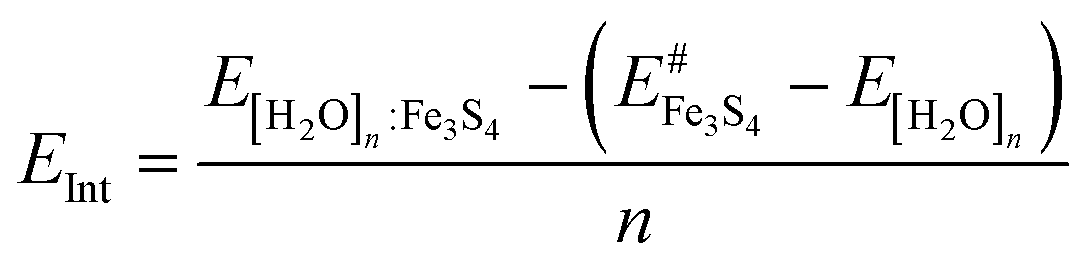 | (3) |
 is the energy of the naked surface retaining the structure of [H2O]n:Fe3S4{001}.
3 Results & discussion
3.1 Greigite{001} surface
Greigite (Fe3S4) is an inverse spinel-structured material, whose particles, as produced in hydrothermal synthesis, expose {001} and {111} surfaces. We have focused our attention on the dominant {001} surface based on the relative surface energies.28,33 The Fe3S4{001} surface represents the (001), (010) and (100) terminations. It contains eight S atoms and seven Fe in the top layer of a unit cell, three Fe from a tetrahedral position in the bulk (FeA) and four from an octahedral bulk position (FeB).48 Before relaxation, it is terminated by 0.5 monolayers (ML) of 2-coordinated FeA ions, occupying a bridge site (above two O ions) with a symmetry according to Wood's notation.67 The flexibility of the S allows these FeA to move below the uppermost layer as explained in previous work.28 The bulk structure, beneath the surface, consists of single rows in the [110] direction of 5-coordinated FeB ions, alternating every two single rows of S ions with cubic packing.68
3.2 Water adsorption
We first placed a H2O molecule on several non-equivalent positions on the surface and allowed both the surface and the molecule to relax without any restrictions. The most stable mode of adsorption, releasing an adsorption energy of 0.35 eV, takes place on one of the four FeB present in the surface, whereas the S layer repels the lone electron pairs of oxygen, thereby blocking the attractive interaction with the FeA. The molecule adsorbs with its oxygen at 2.335 Å from the FeB with the H pointing towards neighboring S atoms, which stretches the H2O angle, see Fig. 1. The FeB-site moves towards the molecule, rising 0.162 Å from the surface plane with respect to the clean surface, which rearranges its orbitals and modifies the FeB spin density by 0.2 μB. There is polarization of the sulfur electron cloud (distance S⋯H is 2.750 Å). | ||
| Fig. 1 Top and side view of Fe3S4{001} surface with [H2O]1 molecule. The color scheme represents O in red and H in white balls and sticks while Fe and S are grey and yellow sticks respectively; black lines delimit the unit cell perimeter. All the distance values are given in Å. | ||
We next increased the number of H2O molecules up to a monolayer, see Fig. S2 (ESI†). We explored the position of a second water molecule across the surface and found the most favorable site to be close to the previously optimized H2O on the Fe3S4{001} surface, although the second H2O does not chemisorb on either nearby FeB or FeA. Upon optimization, the second molecule's oxygen interacts with the pre-adsorbed H2O as an H-bonding acceptor, at 1.720 Å to the pre-adsorbed molecule and at ∼2.9 Å from the surface. This interaction enlarges the H–O* distance (we have used an asterisk to denote the chemisorbed molecules) by 0.03 Å; H2O* also moves closer to FeB by 0.13 Å. The presence of the second molecule strains the HOH angle of the pre-adsorbed molecule by 1.3°. The electronic structure is mostly unaffected and only the bound FeB site decreases its spin density by 0.3 μB compared to a single molecule adsorption state, while the sulfur polarization appears towards the second molecule H (dS⋯H = 2.792 Å).
We have observed similar trends in the structures upon further increase of the number of molecules, where the formation of clusters is favorable with respect to the H2O dispersion on the surface, which takes place around the chemisorbed molecules. We have summarized the geometrical parameters in Table 1. While physisorbed water molecules are H-bonding donors at low coverage ([H2O]nn < 5), they become H-donors and acceptors at higher coverages, a sign of synergetic chemisorption. The general trend is to shrink the FeB–H2O distance, while accommodating the molecules in clusters. Similar results were obtained on layered sulfide minerals, e.g. mackinawite.69,70 Clusters with five or more members generate geometrical structures such as pentagons and hexagons, whereas square structures are less stable due to the geometry of the water molecule and the tension in the long-range interactions. The [H2O]4 cluster forms a periodic linear structure, similar to the ones found on cubic MgO{001} surfaces.71–73
| [H2O]n | d H2O*–Fe (Å) | d O–Surf (Å) | d H2O*⋯HOH (Å) | d H–Surf (Å) |
|---|---|---|---|---|
| n = 1 | 2.335 | 2.469 ± 0.000 | — | 2.627 ± 0.054 |
| n = 2 | 2.204 | 2.765 ± 0.352 | 1.720 | 2.704 ± 0.016 |
| n = 3 | 2.103 | 2.731 ± 0.309 | 1.725 | 2.526 ± 0.261 |
| n = 4 | 2.277 | 2.700 ± 0.319 | 1.922 | 2.563 ± 0.330 |
| n = 5 | 2.227 | 2.879 ± 0.365 | 1.726 | 2.754 ± 0.359 |
| n = 6 | 2.237 | 2.866 ± 0.354 | 1.784 | 2.824 ± 0.352 |
| n = 10 | 2.200 | 2.938 ± 0.406 | 1.818 | 2.785 ± 0.538 |
We also found that clusters with at least six molecules reverse the inward relaxation of the FeA cations, with the cations adopting their positions prior to relaxation in a vacuum. This kind of surface reconstruction was not observed either on metals or oxides.2 The reason for outward cation movement is because the water molecules chemisorb and thereby complete (or partially completes) the dangling bonds of the cations and reduce the dipole of the surface, thus removing the electrostatic driving force that relaxed the FeA inwards. For coverages larger than 5 H2O molecules, the FeA remains on the outside of the surface and binds up to two water molecules, see Fig. 2. When the monolayer is completed there are four water molecules bound to the surface, two on FeB and two on the FeA, whereas the rest of the water molecules are physisorbed and complete the H-bonding network.
 | ||
| Fig. 2 Top and side view of [H2O]10 molecules forming a monolayer on Fe3S4{001}. The color scheme represents O in red and H in white balls and sticks while Fe and S are grey and yellow sticks respectively; black lines delimit the unit cell perimeter. All the distance values are given in Å. | ||
The increasing number of adsorbed molecules on the surface is promoted by the partially charged bridging proton which, in a synergetic effect, compensates for the repulsive interaction between the oxygen atoms.74 The H-bond expands as new bonds are formed, converging to a basal plane ice structure similar to the one found on metals, where the water network adapts its lateral lattice parameter to match the surface site spacing, thereby allowing the O atom of the lower water molecules to bind directly to the surface.75 Placing [H2O]10 on a single Fe3S4{001} surface unit cell completely covers the surface leading to a monolayer, see Fig. 2. The full coverage leads to shorter Fe–H2O* bonds and decreases the distance between the surface and the hovering (physisorbed) water molecules in a comparable way to the structures found on metal surfaces.1,2
As the number of molecules increases so does the gap between the surface and the average O height, while the distance from the surface to the average H position decreases; a fact that confirms a preferred downward orientation, see side view in Fig. 2. The formation of a hydrogen-bond changes the polarization of the participating water molecules, increasing the water dipole moment and hence the ability to form further hydrogen-bonds.79 For instance, upon adsorption of the second molecule, the density flux showed substantial sulfur polarization towards the non-chemisorbed molecule.28
The water dipole, and therefore the molecule orientation, depends on its environment, i.e. adsorbate coverage, surface structure, co-adsorbates and applied potential.2 On the Fe3S4{001} surface, the orientation of the molecules and charge transfer play a role in the polarization of the system. We have calculated the variation in work-function (ΔΦ) upon water adsorption to provide information on the dipole orientation of the adsorbed cluster. ΔΦ is the difference between the Fermi energy of the different systems because the potential in the vacuum is identical for the systems compared. While the work-function varies from 4.40 to 5.49 eV, the average angles of the molecules with respect to the surface plane are in the range of −15.00 to +9.31°, reaching up to −83.08° and +33.04° for certain molecules. Positive and negative signs of the angles indicate the orientation of the hydrogens away and towards the surface respectively, see inset in Fig. 3. This figure shows the main angle of the plane of the molecules with respect to the surface as a function of ΔΦ. It shows that for n > 1 the main orientation of the molecules is pointed slightly downwards to the surface. The angle and ΔΦ follow a linear trend until the surface strongly reconstructs (n > 6), i.e. the FeA adopts its bulk position above the S atomic layer and the surface electronic structure changes as a result. Although more points would be needed to define the limit accurately, full coverage indicates a strong orientation of the water–surface interface. In electrochemical experiments, the external potentials will modify the surface work-function, forcing the dipole orientation and thus water re-alignment.80
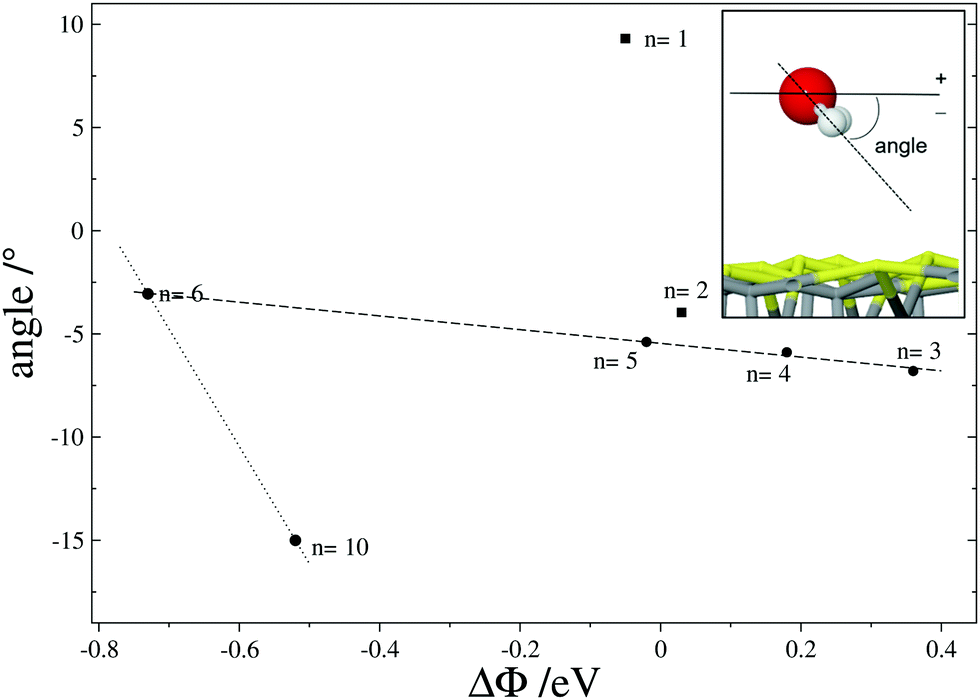 | ||
| Fig. 3 Average angle of the H with respect to the surface (see inset) as a function of the work-function variation (ΔΦ) respect to naked surface Fe3S4{001}. Number of molecules in the cluster [H2O]n are inset. Negative angle values indicate orientation towards the surface. Dashed line represents the interpolation for 3 ≥ n ≥ 6 following the equation angle = −5.4597 − 3.3268·ΔΦ; R2 = 0.99. | ||
We have plotted in Fig. 4 the energy values corresponding to the cohesion energy (ECoh), the adhesion energy (EInt), and the global binding energy (EB) per molecule as a function of the number of water molecules (summarized in Table 2). ECoh corresponds to the energy required to retain the molecules as a cluster, whilst EInt is the energy released (or required) for [H2O]n upon adsorption; both are calculated for water structures in the same configuration as the adsorbed one. This fixed geometry determines the number of H-bonds between molecules and the cohesion energy is therefore not directly comparable with gas phase water structures. However, the ECoh of free flat water structures show a similar trend. Compared to Möller–Plesset and coupled-cluster computational levels,82 the ECoh for the dimer is 0.01 eV weaker and the free structure of the trimer is 0.11 eV stronger than in our results; this value decreases with the number of water molecules. The sum of the ECoh and EInt interactions is described by EB. The slope of the ECoh trend is related to the formation of H-bonds, where a flat slope indicates thermodynamic equilibrium which is, however, still not reached with a monolayer. ECoh also decreases with the number of molecules while EInt remains at a similar energy, indicating easy exchange of molecule between layers. In general, the interaction between clusters and the surface is stronger than the cohesion between the molecules. This energy difference becomes smaller as the coverage, and number of H-bonds, increases, indicating a trend to form clusters instead of wetting of the surface.
 | ||
| Fig. 4 Cohesion (ECoh), adhesion (EInt) and binding (EB) energies per water molecule on Fe3S4{001}. The cohesive energy is presented as a dashed-red line, the adhesion energy is a dotted-blue line, and the binding energy is black-solid line. The dashed brown line indicates the DFT(PW91) H2O–H2O binding energy in ice-Ih the structure.83 | ||
| [H2O]n | E B (eV)·n | E Coh (eV)·n | E Int (eV)·n | E A (eV)·n | E R (eV)·n |
|---|---|---|---|---|---|
| n = 1 | −0.35 | — | −0.51 | 0.89 | 0.81 |
| n = 2 | −0.48 | −0.12 | −0.50 | 0.97 | 0.76 |
| n = 3 | −0.56 | −0.11 | −0.59 | 1.27 | 0.94 |
| n = 4 | −0.59 | −0.22 | −0.48 | 1.14 | 0.91 |
| n = 6 | −0.59 | −0.25 | −0.51 | 0.95 | 0.48 |
| n = 10 | −0.66 | −0.33 | −0.54 | 1.45 | 0.71 |
The binding energy per water molecule (EB) displays an asymptotic trend with the limit reaching the H2O–H2O interaction energy in an ice-Ih structure obtained with a similar computational setup.83 Full water coverage has practically the same binding energy as a molecule embedded in this hexagonal ice structure; a similar ice structure has been found on metal surfaces. Further increments in the number of monolayers would induce a partial rearrangement of the dipole due to the relocation of perpendicular H-bonds between the surface and the second monolayer. The three-dimensional H-bond mesh stabilizes the water structure by up to 0.3 eV depending on the geometry and the H-bond length.84
The molecular adsorption energies on the Fe3S4{001} surface are slightly weaker than on pyrite,85,86 but similar to those found on FeNi2S4 surfaces,27 whereas for magnetite, its isomorphic oxide, are reported to be between −0.4 and −1.0 eV.24–26 Upon adsorption, the O–H bond of the molecule may become stretched towards the polarized sulfur on the surface until it dissociates, leading to both hydroxy and thiol groups. The dissociation energies, listed in Table 2 as ER, indicate an endothermic process by ∼0.8 eV which is independent of the number of water molecules; [H2O]6 is stabilized by the relocation of long-range bonds without angle strains into a hexagonal shape. Although we have stretched the H–O* from one of the chemisorbed molecules towards the surface, the relaxation and optimization of the [H2O]n (n = 6 and 10) geometries led to hydrogen exchange within the H-network leaving the hydroxyl group adsorbed on FeA, see Fig. 5.
 | ||
| Fig. 5 Top view of reactants (left), transition state (middle) and products (right) of the H2O dissociation process on Fe3S4{001}. The color scheme represents O in red and H in white balls and sticks while Fe and S are grey and yellow sticks respectively; circles and the arrow indicate the dissociated hydrogen, the hydroxy group and the direction of proton transfer respectively. | ||
The OH group subtracts on average ∼0.5 e− from nearby metal centers, whereas the S–H bond has covalent character. Similar charge transfers have been reported for H2O on the pyrite{100} surface, reflecting the greater stability of pyrite and its inability to be further oxidised.85 The dissociation kinetics are also unfavorable, with activation barriers of ∼1.1 eV above the adsorbed molecular state. These energies are twice the main activation energies reported on Fe3O4 (EA < 0.5 eV).24–26 This difference can be attributed to the lower basicity and ionic character of the sulfide compared to the oxide. The reverse process, where hydroxy and hydrogen associates to yield adsorbed H2O molecules, has an easily achievable transition state (∼0.2 eV).
The adsorption of a single molecule shows a bending vibrational mode at around 1590 cm−1, while the symmetric and asymmetric stretching peaks are practically negligible due to the modest dipole perpendicular to the surface, in agreement with the geometry in Fig. 1. Upon co-adsorption, the formation of an H-bond is accompanied by shortening of the O–O distance and a slight elongation and weakening of the O–H bond. In turn, this reduces the vibrational frequency of the O–H bond (see Fig. 6), which, shows a strong correlation to both the enthalpy of the hydrogen bond and the O–O distance, see Tables 1 and 2. In addition to the frequency correlation, there is also a correlation between the strength of the hydrogen bond and the intensity of the IR absorption band, indicating that hydrogen-bonding also increases the dynamic dipole moment, as we showed in Fig. 3.87
 | ||
| Fig. 6 Normalized infra-red spectra of [H2O]n (n = 1–10) clusters on Fe3S4{001}. We have shifted the y-axis position of each spectrum to enhance the visualization. The dashed line represents the IR of liquid water (Standard Reference Database 69: NIST Chemistry WebBook). | ||
As the number of water molecules increases, the stretching mode of the adsorbed molecule (ν(HO*)) shifts towards lower frequency, indicating a weakening of the O–H bond. Asymmetric νa(HO*) are at higher frequencies than the symmetric stretching which, together with H-bonds at low-frequency ν(O⋯H) modes,2 form the limits of bulk liquid water, 2800 and 3800 cm−1, dashed line in Fig. 6. The development of the H-network is detected by the slight shifts up in the scissoring vibrational mode (δ(HOH)), at ∼1600 cm−1, reflecting the increased stiffness of this motion. Below 1200 cm−1, we have found the vibration modes, twisting, rocking and wagging modes, forming a wide band from ∼1000 cm−1, in full agreement with the experimental IR of water. The similitudes to the bulk water IR reflect not only the quality of the model but the significant dynamics of the water clusters on the greigite surface.71,72
3.3 Micro-kinetics
Although we have established the energetic preference for H2O adsorption and dissociation on the Fe3S4{001} surface, the preferred cluster dimension is still unknown. We have therefore employed a classical micro-kinetics model to reveal the relative fraction of clusters under various conditions of temperature, pressure of H2O and external potential, see ESI.† We derived the free energy (G) from our DFT calculations, where the internal energy is corrected by the zero point energy and its variation with the temperature by the specific heat; the entropic term is derived from the vibrational, translational and rotational partition functions of the molecules, while we kept the electronic partition function equal to the ground state.48,88,89 The energy values of the clusters containing 7, 8 and 9 molecules of water were interpolated following the linear relationships as a function of the number of water molecules which also depends on the temperature, see Fig. S3 (ESI†). We have compared the calculated free energy of H2O with the free energy derived from the Shomate equations90 resulting in an average relative error of 0.15%, see Fig. S4 (ESI†).The model considers processes of adsorption/desorption in thermodynamic equilibrium, where the cluster increases from gas phase molecules following the processes in eqn (4), (R = 1–10). The model also includes the dissociation of a chemisorbed molecule into H + OH as a function of the coverage (R = 11–20).
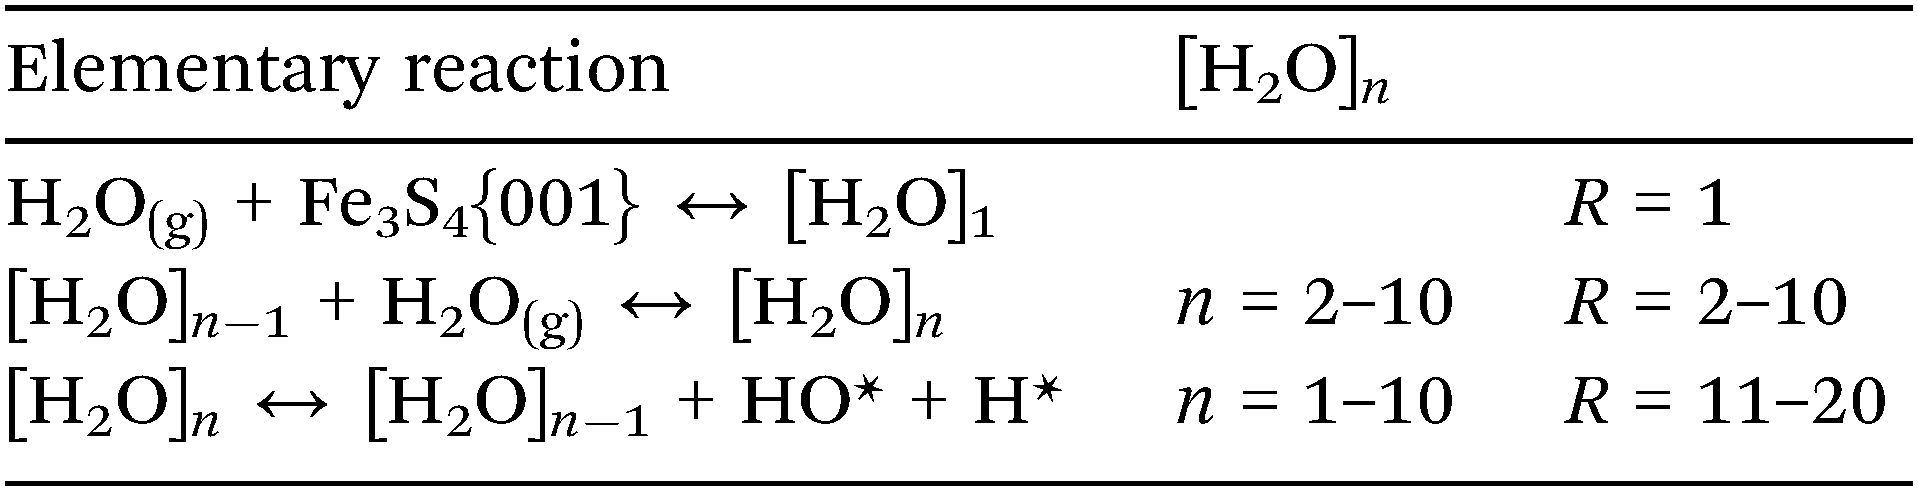 | (4) |
The probability of the water molecules sticking on the surface was derived from the difference between the partition functions of a gas phase H2O with two-dimensional degrees of freedom, the third one corresponding to the reaction coordinate, and the adsorbed system.88 Within this definition, the sticking coefficient (S0) is of the order of 10−5, which depends on the temperature according to the expression S0 = 20.605 × T−2.5. It lies in the range of S0 found on metal and semiconductor surfaces under low H2O coverage,2 which also agrees with the geometric and energetic results previously discussed.
The reaction constants reveal that beyond a certain temperature it is unlikely to find water molecules scattered on the surface, because the desorption process is faster than the adsorption for most of the initial coverages, which agrees with the low hydrophilicity of greigite.91 Exceptions are the processes leading to a stable geometry configuration where the H-bond network is extended, i.e. initial θH2O = 0.3, 0.4, 0.8 and 0.9 ML, the last one leading to a very stable full coverage. Fig. 7 shows the natural logarithm of the adsorption/desorption reaction constants (Kads/Kdes) as a function of the temperature. The behaviour of the constants agrees with the fact that at higher temperature the entropic term of the free energy becomes more important and the molecules tend to desorb from the surface as Kads/Kdes gets closer to one.
 | ||
| Fig. 7 Natural logarithm of the adsorption/desorption reaction constants as a function of the temperature. Different initial coverages are plotted (0 < θH2O < 0.9 ML). | ||
We have also implemented in our model a well-established approximation, extensively discussed in the literature,80,92–96 to simulate the effect of an external potential, e.g. an electrode potential at charge zero. The electrode bias modifies the free energies of the redox processes, i.e. during H2O dissociation there is charge transfer to the [H + OH] groups. This methodology does not include effects such as the electrical double layer parallel to the surface, which, however, is usually small due to the small dipole moment of the adsorbents on the surface and low external potentials.97 As expected, anodic potentials (<−0.6 V vs. NHE) enhance the dissociation of H2O at room temperature. Milder or positive external potentials cause the hydroxy group to recombine with hydrogen and to desorb as water, as shown in Fig. 8 and Fig. S5 (ESI†). This finding is in good agreement with the experimental potential value during the hydrogenation of CO2, while a larger anodic bias led to hydrogen evolution.33,48
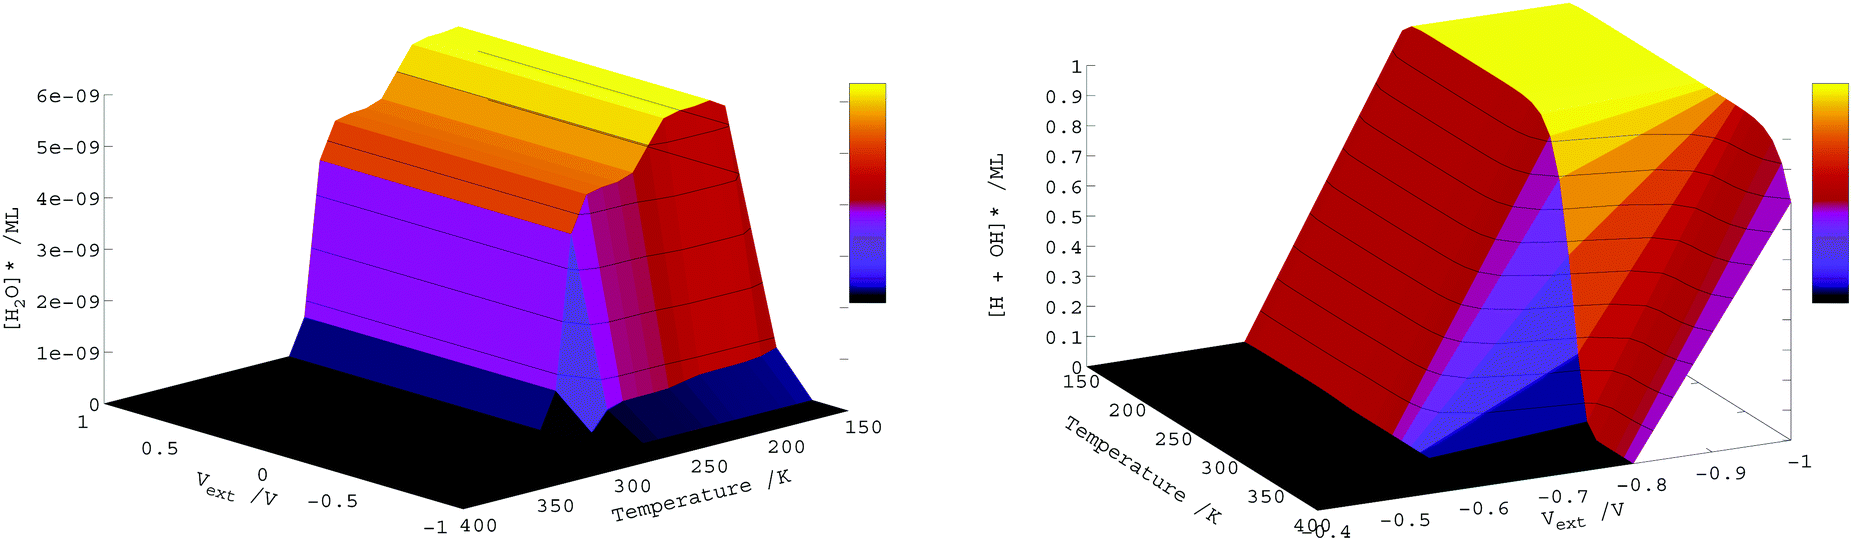 | ||
| Fig. 8 Monolayers of adsorbed and dissociated water on Fe3S4{001} under different conditions of temperature and external potential two seconds after exposure of the naked surface to a pressure of 0.7 ML of gas phase water. | ||
The model allows the clusters to grow by adsorbing H2O to an already existing cluster. Thus, we have analysed the cluster distributions as a function of the temperature and found that the Fe3S4{001} surface has a hydrophobic character, in agreement with previous experimental reports.91Fig. 9 shows the cluster size distribution under an applied bias of −0.6 V and open circuit (0.0 V). The process starts with the adsorption of one molecule followed by the co-adsorption of more H2O to form a five-membered cluster. The relative amount of [H2O]1 depends on the initial concentration of H2O gas and the surface bias. Accordingly, the appearance of [H2O]5 is related to the decline of a single molecule per unit cell. The adsorption and desorption processes lead to the formation of four-membered clusters [H2O]4 at the expense of [H2O]5 in a temperature range of 200–225 K. This four-membered cluster remains on the surface up to 275 K when the molecules desorb. The remaining molecules [H2O]1 (<10−15 ML) are in equilibrium with their dissociated form [H + OH].
 | ||
| Fig. 9 Normalised fraction (χ) of water clusters on Fe3S4{001}, as a function of the temperature, under different applied potentials, −0.6 V and 0.0 V (left and right respectively), and for three initial pressure of H2O, 0.1, 0.5 and 0.9 ML from top to bottom. | ||
We have also considered a separate kinetic model where the surface starts with pre-adsorbed water molecules. Here, the molecules move along the surface but the desorption is restricted, according to the process expressed by eqn (5). The results indicate the stability of the different clusters as a function of the initial conditions and increase in their internal energy, i.e. temperature.
| [H2O]n−1 + [H2O]2 ↔ [H2O]n + [H2O]1 n = 2–10 | (5) |
4 Conclusions
We have studied the adsorption of water molecules up to a full monolayer on the {001} surface of the iron thio-spinel Fe3S4, which is the sulfide analogue of magnetite. All the calculations were performed by DFT+U, including the long-range dispersion forces as derived from the atomic polarizability. The sulfide allows movements perpendicularly to the surface, causing the Fe originally above the surface plane to penetrate beneath the top atomic layer, thereby decreasing the surface energy. However, the original bulk-terminated position of FeA in the {001} surface is restored when it is surrounded by more than six waters, two of them binding FeA and completing its tetrahedral coordination, thereby decreasing the surface dipole and the electrostatic driving force for relaxation. While chemisorbed molecules bind FeB sites, physisorbed ones hover around the coordinated H2O. Hovering molecules orient themselves to form long-range interactions between themselves and with the sulfurs in the surface, producing geometric structures similar to the basal plane of hexagonal ice, whereas the water network adapts its lateral lattice parameter to match the site spacing. The average orientations of the molecules within the cluster size can be linked to the work-function through the overall dipole moment, particularly for large coverages.The growth in the number of molecules increases the cohesion interaction between molecules by increasing the number of H-bonds, although the interaction energy with the surface remains practically invariable with increasing cluster size. This finding explains the stabilization energy by neighboring molecules whilst showing the low hydrophilicity of the sulfide. The energy balance between binding FeB and increasing the size of existing water clusters is also shown by the micro-kinetic model, where the average size are four- and five-membered clusters (depending on the temperature). This model also showed the distribution of dissociated molecules as a function of the temperature and external potential: anodic potentials below 0.6 V vs. NHE dissociate H2O on a greigite electrode, which is in agreement with previous electro-catalysis work. The main interactions between adsorbates and adsorbate–surface is determined by long-range electrostatic interactions, especially in polar molecules like water, which mainly hover practically parallel to the surface, similar to those interacting with metallic surfaces. Overall, the Fe3S4{001} surface has a hydrophobic character with low desorption temperatures. In addition, wettability of the surface is very low, in agreement with experimental studies, and water clusters remain as they are and do not spill over the surface. These results show the different behavior of sulfides compared to oxides, which usually dissociate H2O spontaneously.
Further work is needed to ratify the accuracy of the electronic structure calculations and micro-kinetic simulations. Although in many cases they provide a reliable description of experimental features, several approximations have been considered. For instance, future higher level calculations, including long-range dispersion depending on the electron density instead of semi-empirical approximations, and an explicit description of dynamical effects would help to verify the results presented here.
Acknowledgements
We acknowledge the Engineering & Physical Sciences Research Council (grant EP/K035355/1 and EP/K035355/2) for funding. This work made use of the ARCHER facilities, the UK's national high-performance computing service, which is provided by UoE HPCx Ltd at the University of Edinburgh, Cray Inc. and NAG Ltd, funded by the Office of Science and Technology through EPSRC's High End Computing Programme and provided via our membership of the HPC Materials Chemistry Consortium (EPSRC EP/L000202). The authors also acknowledge the use of the UCL Legion High Performance Computing Facility and the Advanced Research Computing@Cardiff (ARCCA) at Cardiff University, and associated support services, in the completion of this work. N. H. de Leeuw thanks the Royal Society for an Industry Fellowship. All data created during this research is openly available from the University of Cardiff Research Portal at http://doi.org/10.17035/d.2016.0010313665.References
- A. Hodgson and S. Haq, Surf. Sci. Rep., 2009, 64, 381–451 CrossRef CAS.
- M. A. Henderson, Surf. Sci. Rep., 2002, 46, 1–308 CrossRef CAS.
- N. Y. Dzade, A. Roldan and N. H. de Leeuw, J. Phys. Chem. C, 2016, 120, 21441–21450 CAS.
- M. A. Fox and M. T. Dulay, Chem. Rev., 1993, 93, 341–357 CrossRef CAS.
- M. R. Hoffmann, S. T. Martin, W. Y. Choi and D. W. Bahnemann, Chem. Rev., 1995, 95, 69–96 CrossRef CAS.
- A. L. Linsebigler, G. Q. Lu and J. T. Yates, Chem. Rev., 1995, 95, 735–758 CrossRef CAS.
- N. S. Jacobson, E. J. Opila and K. N. Lee, Curr. Opin. Solid State Mater. Sci., 2001, 5, 301–309 CrossRef CAS.
- N. H. de Leeuw, G. W. Watson and S. C. Parker, J. Phys. Chem., 1995, 99, 17219–17225 CrossRef CAS.
- N. H. de Leeuw, G. W. Watson and S. C. Parker, J. Chem. Soc., Faraday Trans., 1996, 92, 2081 RSC.
- N. H. de Leeuw and S. C. Parker, J. Chem. Soc., Faraday Trans., 1997, 93, 467–475 RSC.
- N. H. de Leeuw, S. C. Parker and K. H. Rao, Langmuir, 1998, 14, 5900–5906 CrossRef CAS.
- N. H. de Leeuw, F. M. Higgins and S. C. Parker, J. Phys. Chem. B, 1999, 103, 1270–1277 CrossRef CAS.
- T. G. Cooper and N. H. de Leeuw, Surf. Sci., 2003, 531, 159–176 CrossRef CAS.
- T. G. Cooper and N. H. de Leeuw, Langmuir, 2004, 20, 3984–3994 CrossRef CAS PubMed.
- S. C. Parker, P. M. Oliver, N. H. De Leeuw, J. O. Titiloye and G. W. Watson, Phase Transitions, 1997, 61, 83–107 CrossRef CAS.
- N. H. de Leeuw and S. C. Parker, J. Phys. Chem. B, 1998, 102, 2914–2922 CrossRef CAS.
- N. H. De Leeuw, Am. Mineral., 2002, 87, 679–689 CrossRef CAS.
- D. Mkhonto and N. H. de Leeuw, J. Mater. Chem., 2002, 12, 2633–2642 RSC.
- X. Yu, Y. Li, Y.-W. Li, J. Wang and H. Jiao, J. Phys. Chem. C, 2013, 117, 7648–7655 CAS.
- A. Roldan, D. Santos-Carballal and N. H. de Leeuw, J. Chem. Phys., 2013, 138, 204712 CrossRef CAS PubMed.
- Y. Joseph, W. Ranke and W. Weiss, J. Phys. Chem. B, 2000, 104, 3224–3236 CrossRef CAS.
- U. Leist, W. Ranke and K. Al-Shamery, Phys. Chem. Chem. Phys., 2003, 5, 2435–2441 RSC.
- N. H. de Leeuw and S. C. Parker, Phys. Rev. B: Condens. Matter Mater. Phys., 1998, 58, 13901–13908 CrossRef CAS.
- T. Yang, X.-D. Wen, D.-B. Cao, Y.-W. Li, J.-G. Wang and C.-F. Huo, J. Fuel Chem. Technol., 2009, 37, 506–512 CrossRef CAS.
- C. G. Zhou, Q. F. Zhang, L. Chen, B. Han, G. Ni, J. P. Wu, D. Garg and H. S. Cheng, J. Phys. Chem. C, 2010, 114, 21405–21410 CAS.
- M. E. Grillo, M. W. Finnis and W. Ranke, Phys. Rev. B: Condens. Matter Mater. Phys., 2008, 77, 075407 CrossRef.
- S. Haider, A. Roldan and N. H. de Leeuw, J. Phys. Chem. C, 2013, 118, 1958–1967 Search PubMed.
- A. Roldan and N. H. de Leeuw, Proc. R. Soc. A, 2016, 472, 20160080 CrossRef CAS PubMed.
- T. R. Dyke, K. M. Mack and J. S. Muenter, J. Chem. Phys., 1977, 66, 498–510 CrossRef CAS.
- T. R. Dyke and J. S. Muenter, J. Chem. Phys., 1972, 57, 5011–5012 CrossRef CAS.
- D. Brinkley, M. Dietrich, T. Engel, P. Farrall, G. Gantner, A. Schafer and A. Szuchmacher, Surf. Sci., 1998, 395, 292–306 CrossRef CAS.
- M. Akbulut, N. J. Sack and T. E. Madey, Surf. Sci., 1996, 351, 209–227 CrossRef CAS.
- A. Roldan, N. Hollingsworth, A. Roffey, H. U. Islam, J. B. Goodall, C. R. Catlow, J. A. Darr, W. Bras, G. Sankar, K. B. Holt, G. Hogarth and N. H. de Leeuw, Chem. Commun., 2015, 51, 7501–7504 RSC.
- L. Chang, A. P. Roberts, Y. Tang, B. D. Rainford, A. R. Muxworthy and Q. Chen, J. Geophys. Res., 2008, 113, 1–16 CrossRef.
- G. Kresse and J. Hafner, Phys. Rev. B: Condens. Matter Mater. Phys., 1993, 47, 558 CrossRef CAS.
- G. Kresse and J. Furthmüller, Comput. Mater. Sci., 1996, 6, 15 CrossRef CAS.
- N. D. Mermin, Phys. Rev., 1965, 137, 1441–1443 CrossRef.
- G. Kresse and D. Joubert, Phys. Rev. B: Condens. Matter Mater. Phys., 1999, 59, 1758 CrossRef CAS.
- J. P. Perdew, J. A. Chevary, S. H. Vosko, K. A. Jackson, M. R. Pederson, D. J. Singh and C. Fiolhais, Phys. Rev. B: Condens. Matter Mater. Phys., 1992, 46, 6671 CrossRef CAS.
- S. H. Vosko, L. Wilk and M. Nusair, Can. J. Phys., 1980, 58, 1200–1211 CrossRef CAS.
- S. Grimme, J. Comput. Chem., 2006, 27, 1787–1799 CrossRef CAS PubMed.
- S. Irrera, A. Roldan, G. Portalone and N. H. De Leeuw, J. Phys. Chem. C, 2013, 117, 3949–3957 CAS.
- N. Y. Dzade, A. Roldan and N. H. de Leeuw, J. Chem. Phys., 2013, 139, 124708 CrossRef CAS PubMed.
- S. S. Tafreshi, A. Roldan, N. Y. Dzade and N. H. de Leeuw, Surf. Sci., 2014, 622, 1–8 CrossRef CAS.
- N. Dzade, A. Roldan and N. de Leeuw, Minerals, 2014, 4, 89–115 CrossRef CAS.
- F. Zhang, J. D. Gale, B. P. Uberuaga, C. R. Stanek and N. A. Marks, Phys. Rev. B: Condens. Matter Mater. Phys., 2013, 88, 054112 CrossRef.
- L. Yang, D. Tunega, L. Xu, N. Govind, R. Sun, R. Taylor, H. Lischka, W. A. DeJong and W. L. Hase, J. Phys. Chem. C, 2013, 117, 17613–17622 CAS.
- A. Roldan and N. H. de Leeuw, Faraday Discuss., 2016, 188, 161–180 RSC.
- H. J. Monkhorst and J. D. Pack, Phys. Rev. B: Solid State, 1976, 13, 5188–5192 CrossRef.
- V. I. Anisimov, M. A. Korotin, J. Zaanen and O. K. Andersen, Phys. Rev. Lett., 1992, 68, 345–348 CrossRef CAS PubMed.
- S. L. Dudarev, G. A. Botton, S. Y. Savrasov, C. J. Humphreys and A. P. Sutton, Phys. Rev. B: Condens. Matter Mater. Phys., 1998, 57, 1505–1509 CrossRef CAS.
- I. D. R. Moreira, F. Illas and R. L. Martin, Phys. Rev. B: Condens. Matter Mater. Phys., 2002, 65, 155102 CrossRef.
- I. Ciofini, F. Illas and C. Adamo, J. Chem. Phys., 2004, 120, 3811–3816 CrossRef CAS PubMed.
- F. Illas and R. L. Martin, J. Chem. Phys., 1998, 108, 2519–2527 CrossRef CAS.
- D. Munoz, N. M. Harrison and F. Illas, Phys. Rev. B: Condens. Matter Mater. Phys., 2004, 69, 085115 CrossRef.
- A. J. Devey, R. Grau-Crespo and N. H. de Leeuw, Phys. Rev. B: Condens. Matter Mater. Phys., 2009, 79, 195126 CrossRef.
- J. Wang, S.-H. Cao, W. Wu and G.-M. Zhao, 2011, arXiv:1012.2364v1.
- G. W. Watson, E. T. Kelsey, N. H. deLeeuw, D. J. Harris and S. C. Parker, J. Chem. Soc., Faraday Trans., 1996, 92, 433–438 RSC.
- P. W. Tasker, J. Phys. C: Solid State Phys., 1979, 12, 4977–4984 CrossRef CAS.
- E. Sanville, S. D. Kenny, R. Smith and G. Henkelman, J. Comput. Chem., 2007, 28, 899–908 CrossRef CAS PubMed.
- R. F. W. Bader, Atoms in Molecules – A Quantum Theory, Oxford University Press, Oxford, 1990 Search PubMed.
- G. Henkelman, A. Arnaldsson and H. Jonsson, Comput. Mater. Sci., 2006, 36, 354–360 CrossRef.
- J. T. Yates and T. E. Madey, Vibrational spectroscopy of molecules on surfaces, Plenum Press, 1987 Search PubMed.
- P. J. Feibelman, Chem. Phys. Lett., 2004, 389, 92–95 CrossRef CAS.
- G. Henkelman and H. Jonsson, J. Chem. Phys., 1999, 111, 7010–7022 CrossRef CAS.
- A. Heyden, A. T. Bell and F. J. Keil, J. Chem. Phys., 2005, 123, 224101 CrossRef PubMed.
- E. A. Wood, J. Appl. Phys., 1964, 35, 1306 CrossRef CAS.
- D. Santos-Carballal, A. Roldan, R. Grau-Crespo and N. H. de Leeuw, Phys. Chem. Chem. Phys., 2014, 16, 21082–21097 RSC.
- U. Terranova and N. H. Leeuw, Theor. Chem. Acc., 2016, 135, 1–9 CrossRef CAS.
- U. Terranova and N. H. de Leeuw, Phys. Chem. Chem. Phys., 2014, 16, 13426–13433 RSC.
- S. Picaud, P. N. M. Hoang and C. Girardet, Surf. Sci., 1992, 278, 339–352 CrossRef CAS.
- S. Picaud and C. Girardet, Chem. Phys. Lett., 1993, 209, 340–346 CrossRef CAS.
- J. Heidberg, B. Redlich and D. Wetter, Bunsen-Ges. Phys. Chem., 1995, 99, 1333–1337 CrossRef CAS.
- R. Ludwig, Angew. Chem., Int. Ed., 2001, 40, 1808–1827 CrossRef CAS PubMed.
- G. Held and D. Menzel, Surf. Sci., 1994, 316, 92–102 CrossRef CAS.
- P. A. Thiel and T. E. Madey, Surf. Sci. Rep., 1987, 7, 211–385 CrossRef CAS.
- H. Ogasawara, B. Brena, D. Nordlund, M. Nyberg, A. Pelmenschikov, L. G. M. Pettersson and A. Nilsson, Phys. Rev. Lett., 2002, 89, 276102 CrossRef CAS PubMed.
- J. Cerdá, A. Michaelides, M. L. Bocquet, P. J. Feibelman, T. Mitsui, M. Rose, E. Fomin and M. Salmeron, Phys. Rev. Lett., 2004, 93, 116101 CrossRef PubMed.
- J. K. Gregory, D. C. Clary, K. Liu, M. G. Brown and R. J. Saykally, Science, 1997, 275, 814–817 CrossRef CAS PubMed.
- S. Trasatti, Electrochim. Acta, 1991, 36, 1657–1658 CrossRef.
- K. Griffiths, R. V. Kasza, F. J. Esposto, B. W. Callen, S. J. Bushby and P. R. Norton, Surf. Sci., 1994, 307–309(part A), 60–64 CrossRef CAS.
- V. S. Bryantsev, M. S. Diallo, A. C. T. van Duin and W. A. Goddard, J. Chem. Theory Comput., 2009, 5, 1016–1026 CrossRef CAS PubMed.
- P. J. Feibelman, Science, 2002, 295, 99–102 CrossRef CAS PubMed.
- S. S. Xantheas, C. J. Burnham and R. J. Harrison, J. Chem. Phys., 2002, 116, 1493–1499 CrossRef CAS.
- A. Stirling, M. Bernasconi and M. Parrinello, J. Chem. Phys., 2003, 118, 8917–8926 CrossRef CAS.
- P. H. L. Sit, M. H. Cohen and A. Selloni, J. Phys. Chem. Lett., 2012, 3, 2409–2414 CrossRef CAS PubMed.
- A. V. Iogansen, Spectrochim. Acta, Part A, 1999, 55, 1585–1612 CrossRef.
- I. Chorkendorff and J. W. Niemantsverdriet, Concepts of Modern Catalysis and Kinetics, Wiley-VCH, Weinheim, 2005 Search PubMed.
- A. Roldan, G. Novell, J. M. Ricart and F. Illas, J. Phys. Chem. C, 2010, 114, 5101–5106 CAS.
- M. W. Chase, Jr, J. Phys. Chem. Ref. Data, Monogr., 1998, 9, 1–1951 Search PubMed.
- M. Feng, Y. Lu, Y. Yang, M. Zhang, Y. J. Xu, H. L. Gao, L. Dong, W. P. Xu and S. H. Yu, Sci. Rep., 2013, 3, 2994 CrossRef PubMed.
- S. Trasatti, Electrochim. Acta, 1991, 36, 225–241 CrossRef CAS.
- J. K. Norskov, T. Bligaard, A. Logadottir, S. Bahn, L. B. Hansen, M. Bollinger, H. Bengaard, B. Hammer, Z. Sljivancanin, M. Mavrikakis, Y. Xu, S. Dahl and C. J. H. Jacobsen, J. Catal., 2002, 209, 275–278 CrossRef CAS.
- J. K. Norskov, J. Rossmeisl, A. Logadottir, L. Lindqvist, J. R. Kitchin, T. Bligaard and H. Jonsson, J. Phys. Chem. B, 2004, 108, 17886–17892 CrossRef CAS.
- T. Bligaard, J. K. Norskov, S. Dahl, J. Matthiesen, C. H. Christensen and J. Sehested, J. Catal., 2004, 224, 206–217 CrossRef CAS.
- J. Rossmeisl, A. Logadottir and J. K. Norskov, Chem. Phys., 2005, 319, 178–184 CrossRef CAS.
- E. Skulason, G. S. Karlberg, J. Rossmeisl, T. Bligaard, J. Greeley, H. Jonsson and J. K. Norskov, Phys. Chem. Chem. Phys., 2007, 9, 3241–3250 RSC.
Footnote |
| † Electronic supplementary information (ESI) available: Adsorption geometries, complete information regarding the micro-kinetic simulation and interpolated energies. See DOI: 10.1039/c6cp07371a |
| This journal is © the Owner Societies 2017 |