 Open Access Article
Creative Commons Attribution 3.0 Unported Licence
Exciton-vibrational resonance and dynamics of charge separation in the photosystem II reaction center†
Vladimir I.
Novoderezhkin
 *a,
Elisabet
Romero
b,
Javier
Prior
c and
Rienk
van Grondelle
b
aA. N. Belozersky Institute of Physico-Chemical Biology, Moscow State University, Leninskie Gory, 119992, Moscow, Russia. E-mail: novoder@belozersky.msu.ru
bDepartment of Biophysics, Faculty of Sciences, VU University Amsterdam, De Boelelaan 1081, 1081 HV Amsterdam, The Netherlands
cDepartamento de Física Aplicada, Universidad Politécnica de Cartagena, Cartagena 30202, Spain
First published on 17th January 2017
Abstract
The dynamics of charge separation in the photosystem II reaction center (PSII-RC) in the presence of intramolecular vibrations with their frequency matching the energy gap between the exciton state acting as the primary electron donor and the first charge-transfer (CT) state are investigated. A reduced PSII-RC 4-state model explicitly including a CT state is analyzed within Redfield relaxation theory in the multidimensional exciton-vibrational (vibronic) basis. This model is used to study coherent energy/electron transfers and their spectral signatures obtained by two-dimensional electronic spectroscopy (2DES). Modeling of the time-resolved 2D frequency maps obtained by wavelet analysis reveals the origins of the coherences which produce the observed oscillating features in 2DES and allows comparing the lifetimes of the coherences. The results suggest faster excitonic decoherence as compared with longer-lived vibronic oscillations. The emerging picture of the dynamics unravels the role of resonant vibrations in sustaining the effective energy conversion in the PSII-RC. We demonstrate that the mixing of the exciton and CT states promoted by a resonant vibrational quantum allows faster penetration of excitation energy into the CT with subsequent dynamic localization at the bottom of the CT potential induced by the remaining non-resonant nuclear modes. The degree of vibration-assisted mixing and, correspondingly, the rate of primary charge separation, increases significantly in the case of electron–vibrational resonance. The observed features illustrate the principles of quantum design of the photosynthetic unit. These principles are connected with the phenomenon of coherent mixing within vibronic eigenstates, increasing the effectiveness of charge separation not only upon coherent and impulsive laser excitation utilized in the 2DES experiment, but also under natural conditions under non-coherent non-impulsive solar light illumination.
1. Introduction
Photosynthetic reaction centers (RCs) convert the absorbed solar energy in the form of an electronic excitation into the free energy of charge separated product states.1,2 In the photosystem II reaction center (PSII-RC) the excited states of the pigments (acting as primary donors) are strongly mixed with several charge-transfer (CT) states,3,4 allowing the formation of channels with fast and effective electron transfer.5 Recent studies by two-dimensional electronic spectroscopy (2DES)5,6 have shown that the primary charge separation events in the PSII-RC involve coherent exciton–CT mixing promoted by the coupling of the electronic states to vibrational modes resonant with the exciton–CT splitting.7The measured 2D kinetics of the PSII-RC contain complicated oscillatory features, where contributions from different types of coherences are superimposed.5–7 It was shown that each type of coherence is characterized by a specific distribution of oscillating amplitudes in a 2D plane7 (obtained as a Fourier-transformation of the 2D kinetics and denoted as 2D frequency maps or 2DFT maps). Modeling of the 2DFT maps for the PSII-RC allowed the unambiguous assignment of purely vibrational, predominantly excitonic, and mixed exciton-vibrational (vibronic) coherences with different degrees of exciton mixing.7 It was shown that the electron–vibrational resonances largely present in the PSII-RC create nontrivial quantum effects by coherently mixing the relevant electronic states. In particular, the resonant vibrations can change the delocalization of the exciton states, thus producing directed energy flow to one of the two possible primary donors. Switching between different pathways of charge separation8,9 occurs due to slow protein conformational motion that modulates the pigment's site energies and creates (or destroys) resonances between the exciton splittings and intramolecular vibrational modes. In the case of a resonance with the exciton–CT or CT–CT energy gaps, the coherent mixing of the vibrational sublevels of these states speeds-up the primary charge transfer, giving rise to highly efficient charge separation.7 It is important to highlight that such kind of coherent mixing occurs within eigenstates, and therefore, increases the rate of energy and electron transfers along a particular direction not only upon coherent excitation, but also in natural light-harvesting and charge separation. Consequently, the matching of the frequencies of the most intense intra-molecular vibrational modes with the main exciton (and exciton–CT) splittings in the PSII-RC (as revealed by 2DES5) is most probably not just a coincidence, but reflects a basic principle of energy conversion optimization in photosynthesis.7
The role of vibrations in energy/electron transfers is a fundamental problem that has attracted much interest during the past years and that has become a subject of theoretical studies performed by many research groups.10 It has been shown that the interplay of vibrational and electronic degrees of freedom is responsible for long-lived vibronic coherences with a high degree of exciton mixing11 in contrast with pure exciton coherences that typically exhibit fast decay upon impulsive excitation. The influence of vibrations in driving the exciton coherences becomes even more pronounced if these vibrations are resonant with the gap between the relevant electronic states.12–16 Those resonant vibrations also increase the rate of transfer between electronic states, as was demonstrated for a model dimer17,18 and for the reduced 4-state model of the PSII-RC.7
Besides theoretical efforts, new methods of data analysis (such as the time-window Fourier transformation19 and wavelet analysis20–22 of the 2D kinetics) have been proposed recently, allowing obtaining deeper insights into the coherent dynamics with disentanglement of the vibrational and electronic contributions. Thus, a wavelet analysis of the 2D kinetics measured for the PSII-RC22 makes possible a direct visualization of the coherence lifetimes corresponding to different 2D spectral features (vibrational, vibronic, or electronic), which oscillate at certain frequencies. In particular, long-lived coherences have been reported:22 a lifetime of around 500 fs for mainly excitonic coherence and up to 1 ps for mixed exciton-vibrational coherence between the primary donor and the first CT state.
In this paper we model the dynamics of charge separation in the PSII-RC highlighting the role of resonant vibrations. Utilizing a reduced 4-state model which explicitly includes one CT state and applying Redfield relaxation theory in the exciton-vibrational basis (i.e. in a multidimensional configuration space) we explore the excited-state kinetics (including populations and coherences between the exciton and CT states) which allows us to explain the spectral responses, including the time-resolved 2D frequency maps. We demonstrate how the involvement of a quantum of a resonant vibration promotes the mixing of the electronic states and produces faster and more efficient charge separation in the PSII-RC.
2. Results
2.1. The reduced model of the PSII-RC
The full exciton model of the PSII-RC includes the excited states of 8 pigments (6 chlorophylls (Chl) and 2 pheophytins (Phe)) coupled to several (at least 4) charge-transfer (CT) states.3,5,9,23–28 The explicit modeling of exciton-vibrational dynamics for such a 12-state model (that requires a 12-dimensional configuration space) is too complicated numerically, but the essential spectral properties and excited-state dynamics can be explored by reducing the model to a smaller number of states. For example, the absorption and 2DFT spectra of the PSII-RC can be described by a reduced 4-state model7 that includes two central chlorophylls (special pair) PD1 and PD2 and the pigments from the active branch, i.e. the accessory chlorophyll ChlD1 and the pheophytin PheD1. In the present study we also use the 4-state model, but with a different set of diabatic states, including PD1, PD2, and ChlD1, and the primary charge-transfer state PD2+PD1−. Compared to our previous model7 the present model lacks PheD1, but contains the CT state, thus allowing a study of the primary charge separation dynamics and investigate the role of vibronic coherence in charge separation.In the present model, the site energies of PD1, PD2, and ChlD1 are the same as in the previous version of the 4-state model.7 The energy of the diabatic CT state is red-shifted by 260 cm−1 from ChlD1 (as suggested in ref. 7). Pigment–pigment couplings are taken from ref. 24, whereas PD1/D2–CT couplings have been adjusted in order to reproduce the red tail of absorption and the time-resolved 2D maps (couplings and site energies are listed in Table S1 (see ESI†)). It is widely accepted that the CT states in photosynthetic antennae and RCs are more strongly coupled to the environmental degrees of freedom (as compared with the excited states) due to interaction of their huge static dipole interacting with the polarized surroundings.3,26,27,29–32 In our model the coupling of the CT to phonons/vibrations and the disorder value for the CT state (reflecting its coupling to slow conformational motion) are increased by a factor of 4 and 1.6, respectively (these scaling factors are based on our modeling of the exciton–CT mixing in LHCI antenna32 and further adjusted in the present modeling from the fit of the 2D responses of the PSII-RC). The disorder value (FWHM) is 160 cm−1 for the excited states and 250 cm−1 for the CT (the values are adjusted from the fit of the data). Diabatic states are coupled to a single vibrational mode with a frequency Ω = 340 cm−1. Coupling of the 4 diabatic states to this vibrational mode is included explicitly, i.e. in the 4-dimensional basis of the effective nuclear coordinates Q1–Q4 (see Appendix). The PD1, PD2, and ChlD1 potential surfaces are displaced by Δ = 0.7 along Q1, Q2, and Q3, respectively, whereas the diabatic CT potential is displaced by Δ = 1.4 along Q4 (meaning that the coupling to the Ω = 340 cm−1 vibration, proportional to Δ2, is 4 times bigger for the CT). The corresponding one- and two-exciton Hamiltonians are the same as in ref. 7 (see Appendix). The remaining degrees of freedom (phonons, other vibrational modes) are considered as the bath. The system–bath coupling is treated perturbatively, i.e. using Redfield theory in the basis of the exciton-vibrational eigenstates (as in our previous modeling18,33) using a realistic (i.e. experimentally obtained) spectral density.3 Expressions needed to evaluate the Redfield tensor are given in the Appendix. We suppose that the system–bath spectral density has the same profile for the electronic and nuclear coordinates, but we use a different scaling of its amplitude for the electronic and vibrational parts (given by dimensionless factors Φ2 and φ2, respectively). For the CT all the couplings to the bath are increased in the same proportion as for the system vibration (i.e. in proportion to Δ2, meaning that Φ2 and φ2 are 4 times bigger than those for the excited states). The exact values of Φ2 and φ2 can be adjusted from the fit of the time-resolved 2D maps, where they determine the homogeneous broadening (given by the width of the 2D peaks in the anti-diagonal direction) and the time-evolution of the maps (reflecting the bath-induced relaxation).
Such a reduced model yields an exciton structure that mimics the structure of the PSII-RC absorption (as shown in Fig. 1), including all essential exciton splitting and relative intensities of the main absorption components. The higher exciton level of the special pair PD1/PD2 (cyan) is only weakly allowed. The lower PD1/PD2 level (blue) in some realization of the disorder is close to the red-most exciton transition predominantly localized at ChlD1 (green). In such realizations the exciton transition with a predominant contribution of ChlD1 (green) becomes superradiant, borrowing a significant part of dipole strength from the pair PD1/PD2. The primary CT state PD2+PD1− (magenta) is weakly allowed due to mixing with PD1/PD2.
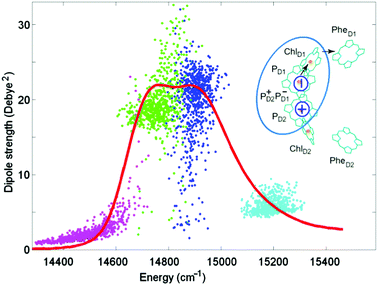 | ||
| Fig. 1 Top-right: arrangement of the 6 core pigments of the PSII-RC. The pigments of the active branch PD1, PD2, and ChlD1 and the primary CT state PD2+PD1− included in the reduced 4-state model are encircled by cyan. Arrows show the direction of electron transfer after the formation of the primary CT state. Distribution of dipole strengths of the four exciton transitions for the reduced model (points) are shown together with the 77 K absorption (red line) measured for the isolated PSII-RC.34 Dipole strengths are shown as a function of zero-phonon energies of the exciton transitions calculated for 700 realizations of the disorder. No coupling to phonons/vibrations is included. The two exciton levels of PD1/PD2 are given in cyan and blue. The lowest exciton state localized at ChlD1 is represented by green color. Magenta color shows the primary CT state PD2+PD1− mixed with the exciton manifold. The monomeric dipole strength (for the PD1, PD2, and ChlD1 diabatic states) is taken to be 16 Debye,2 whereas the diabatic CT is dipole forbidden. | ||
2.2. Exciton-vibrational structure
Coupling of the electronic transitions to vibrations produces a more complicated structure of absorption (as compared to the pure excitonic picture shown in Fig. 1). Most dramatic changes occur when the vibrational frequency is comparable with the energy gap between the electronic levels. This is the case for the 340 cm−1 vibration which is in quasi-resonance (i) with the exciton splitting within PD1/PD2 and (ii) with the gap between the lowest PD1/PD2 level and the CT state PD2+PD1−.7 Below we perform a detailed analysis of how such a resonant vibration changes the character of the exciton–CT mixing and increases the rate of primary charge separation.First, we explore the exciton-vibrational (vibronic) structure of absorption in the case where the site energies of the pigments PD1, PD2, and ChlD1 remain unperturbed, whereas the energy of the CT state is varied around resonance with the 340 cm−1 vibrational mode. Fig. 2 shows the stick absorption spectra of the CT energy shifted by −30, +40, and +140 cm−1 from the unperturbed position. Parameters of the 7 lowest vibronic eigenstates for these three cases are listed in Table S2 (see ESI†). It should be noticed that the whole vibronic manifold consists of zero-phonon levels (ZPL) of the electronic states and their vibrational sublevels. In the absence of coupling between the electronic states their vibrational sublevels are degenerate (for example, the first (one-quantum) sublevel of each electronic state is four-times degenerate in our 4-dimensional basis). The coupling produces a mixing of the states, and therefore, lifts the degeneracy as shown in Table S2 (ESI†).
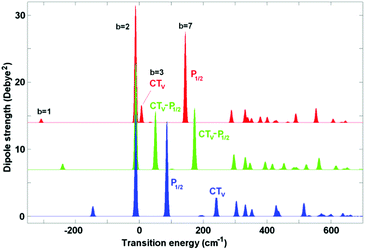 | ||
| Fig. 2 Exciton-vibrational structure of the low-temperature absorption for coupling to Ω = 340 cm−1. The vibrational wavefunctions are calculated in the 4-dimensional basis with displacements Δ = 0.7 for the three excited states and Δ = 1.4 for the CT diabatic state. Transition energies are counted from the ZPL of the diabatic ChlD1 state. No disorder is included; the ZPL energy of the CT state is shifted from the unperturbed value (corresponding to −260 cm−1 when counting from ChlD1) by −30 (red), +40 (green), and +140 cm−1 (blue). Parameters of the vibronic components in these three cases are listed in Table S2 (ESI†). | ||
As shown in Table S2 (ESI†) the lowest b = 1 state corresponds to the zero-phonon level (ZPL) of the CT state. The next (b = 2) state is the ZPL of the exciton state predominantly localized at ChlD1 (its position is slightly different from the ZPL of the diabatic ChlD1 due to some excitonic shift induced by mixing with PD1/PD2). The next five levels (from b = 3 to 7) correspond to the first vibrational satellite of CT (4-times degenerate) superimposed with the lowest PD1/PD2 ZPL. Three of the four vibrational sublevels (b = 4–6) are almost forbidden, whereas levels b = 3 and 7 contain a coherent mixing of the first vibrational sublevel of CT and the PD1/PD2 ZPL (in Fig. 2 these levels are labeled as CTv and P1/2, respectively). The character of the CTv–P1/2 mixing strongly depends on the relative position of these levels. When the CT ZPL origin is shifted to red (ECT = −30 cm−1), its vibrational sublevel CTv is far from the P1/2 state (see the red spectrum in Fig. 2 with the CTv lying lower than P1/2). But the CTv still borrows some part of the dipole strength from P1/2, which is even more intense than the red-shifted CT ZPL. If the CT is closer to the exciton states, its sublevel becomes more strongly mixed with P1/2. Thus, the shift value of ECT = 40 cm−1 corresponds to uniform CTv–P1/2 mixing (see the green spectrum in Fig. 2). Further shifting to blue (ECT = 140 cm−1) moves the CTv level out of resonance, so that its intensity reduces (see the blue spectrum in Fig. 2, where CTv is higher than P1/2).
The effect of a continuous variation of the CT position on the absorption spectrum is shown in Fig. 3. When the CT ZPL moves from red to blue, its first vibrational satellite CTv crosses the electronic ZPL localized at ChlD1. Because the CT and ChlD1 are uncoupled, there is no appreciable interaction between these levels (i.e. they just penetrate through each other as shown in Fig. 3). After that the vibrational level CTv becomes higher in energy than ChlD1. A further blue-shifting produces interaction of the CTv with the lowest level of special pair P1/2. The CTv and P1/2 levels do not just simply penetrate through each other, because the CT is strongly coupled to PD1 and PD2. This coupling produces a ‘repulsive force’, like in the well-known term-crossing phenomenon. Thus, in the crossing points we observe a splitting into two levels, each containing a strong CTv–P1/2 mixing. Finally, when the CTv shifts further, out of resonance, the CTv–P1/2 mixing is reduced giving again a strong P1/2 level and a weak CTv satellite (this time on its blue side). Similar, but spectroscopically less pronounced, features occur in the region where higher vibrational levels of the CT are mixed with the higher PD1/PD2 level.
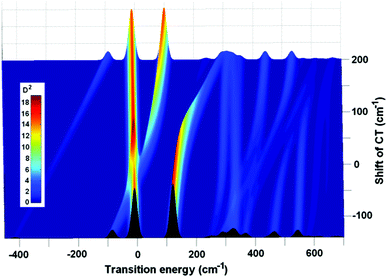 | ||
| Fig. 3 Illustration of the exciton-vibrational resonance, where the changes in absorption are shown as a function of the CT position, which is continuously varied from −140 to 200 cm−1. All the parameters are the same as in Fig. 2. The inset shows the relationship between color and amplitude of the absorption components in Debye2 (D2). | ||
2.3. Vibronic coherences and coupling to the bath
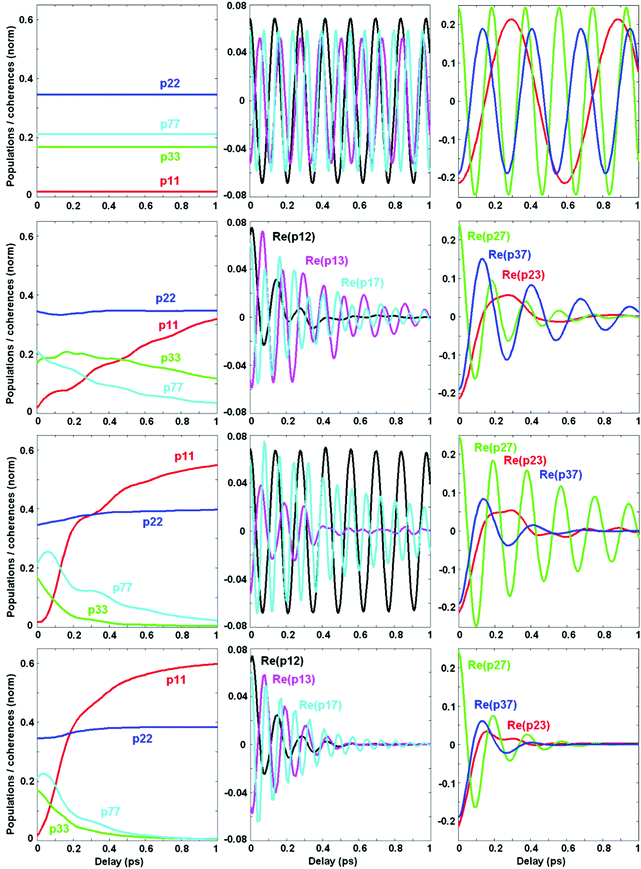
Now we switch to an analysis of the exciton-vibrational dynamics within the model of the PSII-RC as described above. We suppose that the complex is excited by an ultrashort broad-band laser pulse. Such a δ-pulse interacts with all the vibronic states, creating populations and coherences between the most intense of them. This initial excitation is followed by coherent dynamics, including beats between the eigenstates and relaxation from higher to lower energy states. In Fig. 4 we calculate the coherent dynamics for the resonant case (ECT = 30 cm−1). Initially the most populated states are the ChlD1 ZPL (b = 2) and the mixed CTv–P1/2 states (b = 3 and 7). At longer times, the lowest CT ZPL (b = 1) becomes populated via relaxation. Populations of the b = 4–6 vibrational sublevels are negligible. Therefore, we will explore the dynamics of the b = 1, 2, 3, and 7 states, including their populations ρbb and real parts of the coherences ρbb′.Without coupling to the bath (1st row in Fig. 4) populations do not relax, and coherences do not decay. The oscillatory period of the coherences corresponds to the energy difference between the corresponding states. Switching on the coupling to the electronic bath (2nd row in Fig. 4) induces a relaxation of populations and decay of the coherences. Notice that the coherences between electronic ZPLs (ρ12) exhibit fast decay, whereas the coherences between ZPL and its vibrational satellites (ρ13 and ρ17) are more long-lived. Coherences between the mixed exciton-vibrational states CTv–P1/2 (ρ37) are long-lived as well. If we switch on the vibrational bath (instead of the electronic bath – see 3rd row in Fig. 4) the situation is inverted: electronic coherences (ρ12) are long-lived, but vibrational (ρ13) and mixed ones (ρ37) decay faster. The combined action of both electronic and vibrational baths (4th row in Fig. 4) destroys all the coherences and produces a faster population of the CT state.
Comparing population dynamics under different conditions we conclude that the coupling to the vibrational bath has a more pronounced effect on the speed of primary charge separation. This happens because the CT ZPL (see the ρ11 kinetics) is populated mostly via depopulation of the vibrational sublevel CTv mixed with the excited states. This fundamental issue can be better illustrated in the site representation (see below).
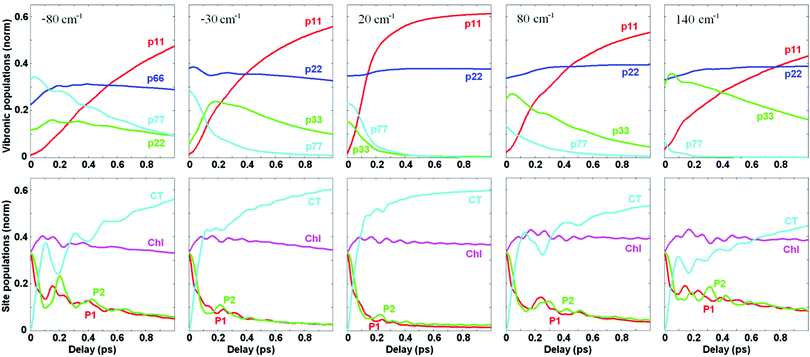
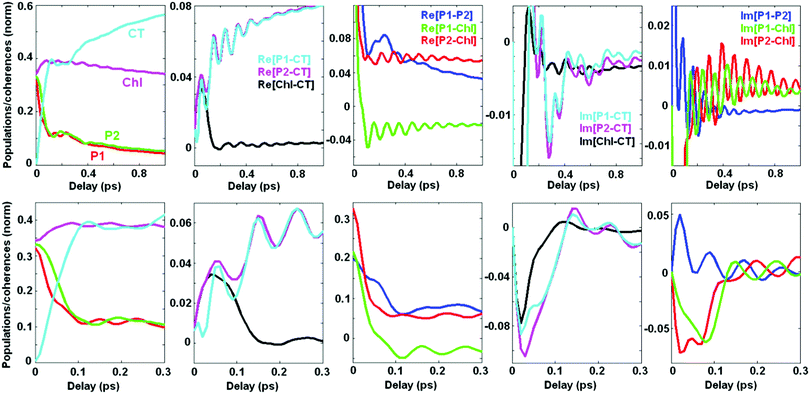
Dynamics of populations and coherences in the site representation are shown in Fig. 5. First we discuss the panels in the left column, showing the dynamics of the site (diabatic states) populations. In the decoupled limit (1st row) we observe strong beats between the CT and the PD1/PD2 sites. These beats reflect the dynamic coherence, created between the two vibronic eigenstates, i.e. between the lower PD1/PD2 ZPL and the first vibrational sublevel of CT. The frequency of the beats equals the splitting between the two mixed CTv–P1/2 levels (shown in Fig. 2). Coupling to the electronic bath (2nd row) does not change the oscillatory character of the coherences, but causes their irreversible decay accompanied by predominant population of CT. Coupling to the vibrational bath (3rd row) damps these beats almost completely. However, the first half-period is undamped and determines the fast component of the CT population (100–150 fs in our example), similar to what is observed in the experiment.5 Therefore, we conclude that the fast phase of charge separation is a coherent process assisted by a resonant vibration producing a mixing between the primary donor (lowest PD1/PD2 exciton state) and the first CT (PD2+PD1− state). Further dissipation dynamically localizes the excitation within the CT potential.
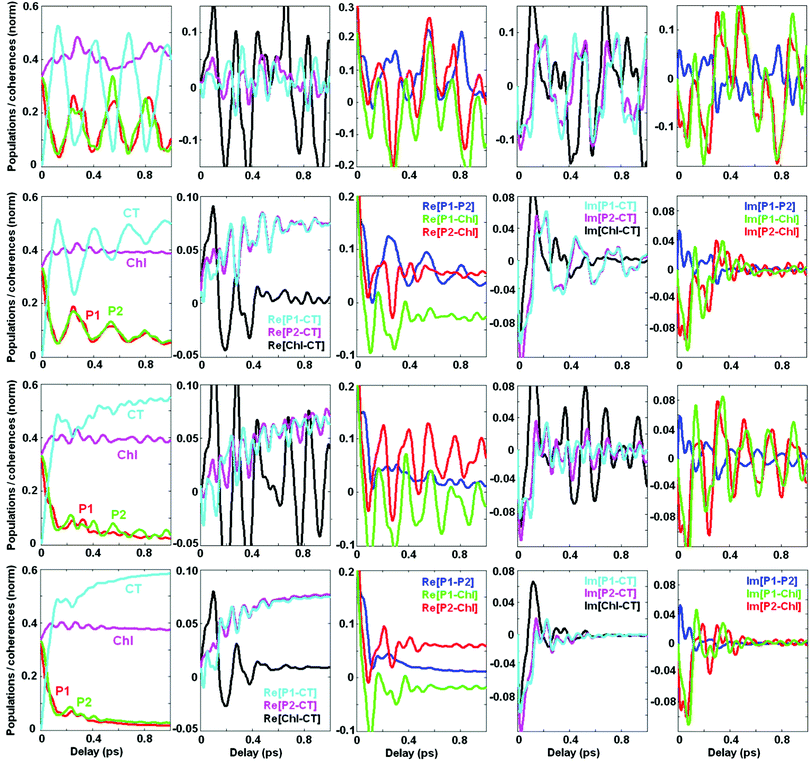 | ||
| Fig. 5 Same as Fig. 4, but in the site representation, includes the site populations and inter-site coherences (real and imaginary parts). The four rows correspond to the same values of the bath couplings (Φ,φ) as in Fig. 4. Notice that the scales are different for different coherences, but these scales are the same in rows 2–4. In the 1st row (corresponding to the decoupled limit with Φ2 = 0 and φ2 = 0) the coherences are much bigger than in the coupled case, so the scales are increased. The color code is the same for all panels in the same column. | ||
The next two columns (from left to right) in Fig. 5 show the dynamics of the coherences between the sites. The real part of these coherences corresponds to a time-dependent delocalization. Reversible oscillations in the decoupled case (1st row) correspond to the oscillatory motion of a localized wavepacket between the sites involved. Interaction with the bath (electronic or vibrational, shown in the 2nd and 3rd rows, respectively) induces a relaxation to the lowest state which is still slightly delocalized, i.e. contains some coherent mixing of the CT and PD1/PD2. The real part of the PD1–CT and PD2–CT coherences at large delays reaches some value corresponding to the inner coherence within the eigenstates populated at equilibrium (see the explanation of the differences between the dynamic and inner coherences in the Discussion section). There is also some inner coherence between PD1/PD2 and ChlD1 due to excitonic coupling between these pigments.
Columns 4–5 (from left to right) in Fig. 5 show the imaginary parts of the inter-site coherences which are connected with dynamic coherences between the eigenstates (and, therefore, always decay to zero). As expected, the coherences between the electronic states (mostly created due to exciton couplings) are strongly damped by the electronic bath (2nd row). Coupling to the vibrational bath (3rd row) does not affect them, but strongly damps the PD1–CT and PD2–CT coherences that are created with the involvement of a vibrational quantum.
We conclude that the excited states (special pair) and the primary CT in the PSII-RC are mixed due to the presence of a resonant vibration. This gives rise to faster electron transfer. Thus, after the first half-period of the PD1–CT and PD2–CT beats the CT becomes coherently populated. To ensure that this transfer is irreversible (i.e. to prevent a coherent depopulation of CT) the PD1/D2–CT coherences should be somehow destroyed. This is achieved by interaction with the bath degrees of freedom, destroying the vibrational motion, i.e. by interaction with the vibrational bath.
It is worth noting that the full model of the PSII-RC contains two pathways of charge separation.3,8,9 But in the reduced model used in the present study, we restrict to just one (faster) pathway PD1/PD2 → PD2+PD1− and neglect the other, the ChlD1 → ChlD1+PheD1− pathway. As a result, the population of the red-most pigment ChlD1 is almost constant (about 0.4, as shown in Fig. 5), whereas the remaining excitation density is transferred to CT via the first pathway (giving CT population at a level of 0.6 in the sub-ps time scale). One can expect that including the second pathway will give a depopulation of ChlD1 (mirrored by a formation of ChlD1+PheD1−) within about 3 ps (ref. 9).
We remind that Fig. 4 and 5 show the dynamics of population and coherences in the eigenstate (vibronic) and site representation, respectively, assuming that the PD1/D2–CT energy gap is close to resonance with the 340 cm−1 vibrational mode. In Fig. 6 we explore how the population dynamics (both in vibronic and site representations) is affected by tuning the CT energy around the resonant value. Fig. 6 shows that the fast phase of charge separation (in the site representation, bottom row) also exists out of resonance, because the CTv–P1/2 mixing occurs over a wide region of energy gaps (as shown in Fig. 3). However, since the degree of mixing out of resonance is not so high, the amplitude of the fast component is reduced. Interestingly, the oscillatory features are more strongly damped in resonance (as was also pointed out in ref. 17), due to faster penetration into the CT region and the subsequent dissipation.
It is important to note that the total CT population in the site representation is the sum of the CT ZPL and the vibrational sublevels of the CT. The dynamics of the CT ZPL (b = 1) and its vibrational sublevels (b = 3) can be viewed in the eigenstate representation as shown in Fig. 6 (top row). The vibrational sublevels of the CT are quickly populated due to their mixing with the exciton states (mostly PD1/D2, directly excited by the δ-pulse). In contrast, the CT ZPL has small dipole strength and cannot be excited directly, i.e. its population grows due to relaxation from the vibrational sublevels mixed with PD1/D2. That is why the CT ZPL (b = 1) population (visualized in the eigenstates representation, top row) grows at a slower rate than the total CT population (shown in the bottom row). Dynamics of the CT ZPL is still fast enough in the resonant case (about 200 fs), but this fast component is absent out of resonance.
We conclude that although the growth of the total population of the CT state (including ZPL and vibrational sublevels) can be as fast as 100 fs, the dynamic localization at the lowest level of primary photoproduct (b = 1) is slower (especially out of exciton-vibrational resonance). Notice that this lowest level (b = 1) of the primary radical pair plays an important role in the total charge separation process, acting as an intermediate for further charge separation steps (including other CT states).
2.4. Coherent dynamics averaged over disorder
Averaging over disorder (including disorder of the CT and other excited states) yields the kinetics shown in Fig. 7. Comparing with the kinetics of a single realization (containing a superposition of many oscillating frequencies as shown in Fig. 5) we conclude that the averaged kinetics are more regular. Instead of the multicomponent oscillatory pattern in a single realization we observe (at least at large delays, i.e. 0.2–1 ps) weak, but long-lived coherences mostly determined by oscillations with a period close to 100 fs, corresponding to the vibrational frequency of 340 cm−1. These coherences correspond to pure vibrational and exciton-vibrational coherences.7The predominantly excitonic coherences and exciton-vibrational coherences with a sizable degree of exciton mixing (for example, coherences between ZPL and the vibrational sublevel of another state) have different frequencies due to disorder-dependent exciton splitting. Averaging over disorder washes out these coherences at large delays. At short delays the sum of many oscillations with different frequencies produces an abrupt decay of the initial coherent peak. As a result we observe a fast phase of the kinetics (0–150 fs) characterized by large values of the coherences that almost completely decay during this phase. Notice that a significant part of the primary photoproduct (CT) is also formed during this ‘coherent’ phase. This fast dynamics (during 0–150 fs) resembles a similar phase observed experimentally in the 2D kinetics, which typically show a 100 fs decay of the intense initial peak followed by slow dynamics modulated by multi-frequency oscillatory features.5
2.5. Time-resolved 2D frequency map
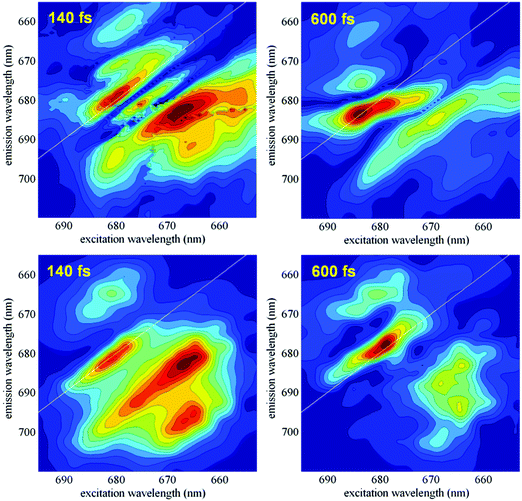
The dynamics of the coherences can be studied by the analysis of the measured 2D spectral evolution (kinetics of the photon echo signal as a function of excitation and emission wavelengths). For instance, a Fourier transformation of the 2D responses with respect to the population time T yields a series of two-dimensional maps (2DFT maps), showing the components of the 2D spectra oscillating at a certain frequency. Recent studies have shown that different types of coherences (i.e. excitonic, vibrational and exciton-vibrational) can be identified by specific shapes of their 2DFT maps.5–7,35 Later it has been proposed to use time-resolved 2D frequency maps (obtained by wavelet analysis20,21) in order to obtain information about the time evolution of the coherences at any frequency.22In this section we compare the measured time-resolved 2D frequency maps with the calculated ones, as they emerge from the present exciton-vibrational model of the PSII-RC. The measured maps are based on the data obtained in the 2DES experiment published in ref. 5. Application of wavelet analysis to these data gave time-resolved 2D frequency maps at different frequencies as described in ref. 22. Fig. 8 (top frames) shows an example of such maps at 340 cm−1. These experimental maps are compared with the calculated ones, obtained with the model described in Section 2.1 (and used in numerical examples in Sections 2.2–2.4).
The third-order polarization needed to calculate the photon echo has been evaluated using an expansion of the Liouville equation for the reduced density matrix up to third order with respect to the external field. An example of such an expansion of the density matrix equation with the Redfield relaxation tensor in the exciton-vibrational basis is given in ref. 33. Within the delta-pulse limit the photon echo can be calculated in a doorway-window representation (ref. 36) as a sum of amplitudes Wbb′(t3)ρb′b(T,t1), where b and b′ states denote excited-state vibronic levels or ground-state vibrational levels. In this representation the doorway is given by the initial populations ρb′b(0,t1), dependent on the time delay t1 between the first two pulses. The evolution of this doorway during the second delay (population time T) is given by ρb′b(T,t1), and the resulting echo signal is given by the overlap of this doorway with the window amplitude Wbb′(t3), dependent on the delay between the third and fourth pulses t3. In principle, to obtain the time-resolved 2D frequency maps one should perform a wavelet transformation of the ρb′b(T) function, but the analysis can be greatly simplified, bearing in mind that the ρb′b(T) components oscillate with frequencies ωb′b and constant amplitudes in the absence of relaxation. Thus, fixing some delay T0 and neglecting the relaxation for T > T0 we can collect amplitudes Wbb′(t3)ρb′b(T0,t1) oscillating with the frequencies within a narrow window (10–20 cm−1 as suggested in ref. 7) near any chosen value (340 cm−1 in our case). The sum of these amplitudes gives the 2D component corresponding to the oscillating frequency 340 cm−1 at a time delay T0. Fourier transformation with respect to t1 and t3 will give the time-resolved 2D frequency map as a function of excitation and emission wavelengths. For slow relaxation this method corresponds to a wavelet transformation (being much less expensive numerically).
In Fig. 8 we compare the measured and calculated maps at 340 cm−1, corresponding to a quasi-resonance between the most intense vibration and both the exciton–exciton and exciton–CT gaps (see Fig. 7 in ref. 7). In our previous work7 we have shown that the 2D frequency map in this case contains a diagonal peak determined by pure vibrational and mixed exciton-vibrational coherences, and an intense off-diagonal peak containing significant contribution from predominantly excitonic coherences. At short delays (T = 140 fs) the time-resolved map displays both the diagonal and off-diagonal peaks which are well reproduced by the model. At larger delays the amplitudes of the two peaks decay. In the experimental data this decay is oscillatory (due to interference with adjacent frequencies22), whereas the calculated maps (where we restrict to coupling to just one mode) show a non-oscillatory decay. It is important to note that the amplitudes of the oscillatory maxima in the measured data show a faster decay for the off-diagonal peak. This trend is confirmed by the modeling, where the decay of the non-oscillatory amplitudes is also faster for the exciton off-diagonal peak, suggesting faster exciton decoherence compared with the more long-lived vibronic coherences. Thus, the experimental and calculated maps at T = 140 fs show comparable on- and off-diagonal amplitudes, whereas the maps around T = 600–640 fs are dominated by a more intense diagonal peak both in the data and in the modeling (Fig. 8).
We conclude that our reduced model provides an explanation of the main features associated with the fast (sub-ps) charge separation via the PD1/PD2 → PD2+PD1− path. Remember that in the full model of the PSII-RC another pathway of charge separation starting from ChlD1 is operational, but in this pathway the first step of electron transfer ChlD1 → ChlD1+PheD1− is slower than the formation of PD2+PD1− (see ref. 9). Note that the involvement of the pigments from the inactive branch (ChlD2 and PheD2) also gives relatively slow (several ps) dynamics (as revealed by the kinetics of exciton population of the 6 core pigments and 4 CTs calculated with the full model of the PSII-RC in ref. 9). Due to this difference in time scales, the reduced model with 3 pigments and just one primary CT state is still capable of illustrating many essential features of coherent charge separation during the delays up to 0.6 ps (Fig. 8) or even 1 ps (Fig. 4–7). Moreover, the simplicity of this reduced model allows an explicit treatment of essential details of the coherent electron–vibrational dynamics in a multidimensional configuration space (which would be too complicated to do with the full model). Although slow components (neglected in our modeling) can give sizable contributions to the whole dynamics during 1 ps, they will not change significantly the character of the fast features determined by the vibration-assisted fast population of the primary CT state.
3. Discussion and conclusions
3.1. Dynamic vs. inner coherence
The observation of quantum coherences in 2DES experiment in combination with theoretical modeling has resulted in intense debates about the role of coherent phenomena in both laser-induced excitation dynamics and natural photosynthesis.37–42 The term ‘coherence’ may have different meanings in such discussions, in particular one should distinguish between the inner and dynamic coherences.Inner coherence reflects a degree of mixing of pigments within the eigenstates (exciton or exciton-vibrational). In the pure exciton picture the coherence between localized (diabatic) states describes their superposition within a collective exciton eigenstate. In the case of exciton-vibrational eigenstates the mixing is determined not only by excitonic interaction between the states, but is also a function of the nuclear coordinates. Notice that the structure of eigenstates (as well as the character of the exciton or exciton-vibrational mixing within them) does not depend on time, so the inner coherences are time-independent.
Dynamic coherence is a coherence that can be created between a pair of eigenstates (under illumination by an ultrashort broadband laser pulse). This coherence results in decaying oscillations in nonlinear spectral responses as can be observed in, for instance, pump–probe and 2DES. These oscillations correspond to the motion of the exciton-vibrational wavepacket along electronic coordinates (corresponding to beats between the excited pigments and CT states) and along effective nuclear coordinates in a multidimensional configuration space. The first, excitonic-type coherence can only be created between eigenstates that each contain coherent mixing of the same electronic diabatic states (for example, between the exciton states of a dimer each composed of a superposition of the two molecular excitations). The second, vibrational coherence can be created even within a localized electronic state, corresponding to a coherent superposition of its vibrational sublevels (with the formation of a vibrational wavepacket moving along the nuclear coordinates). In the general case, i.e. excitonically coupled pigments interacting with vibrations, we are dealing with mixed, exciton-vibrational coherences.
In the measured kinetics the dynamic coherence is always viewed in the eigenstate representation, i.e. as a time-dependent superposition of exciton-vibrational eigenstates. In the modeling we can also switch to the site (diabatic) representation to visualize the dynamics of the site populations and inter-site coherences. Contrary to inter-site (inner) coherences within individual eigenstates, the ‘dynamic’ inter-site coherences (corresponding to a superposition of eigenstates) are oscillating. Their imaginary part decays to zero, whereas the real part at large delays reaches some constant values corresponding to the inner coherence. Examples of dynamic coherences in the eigenstate and site representations are given in Fig. 4 and 5.
Sometimes it can be useful to analyze the degree of exciton (inter-site) mixing present in the coherence between two particular vibronic eigenstates.7,18,35 In this way it is possible to calculate the degree of exciton mixing in a particular oscillating peak in the 2D map (in order to assign it to excitonic, exciton-vibrational, or pure vibrational type).
3.2. Coherent electronic energy transfer (EET) vs. coherent electron transfer (ET)
The effectiveness of electronic energy transfer (EET) in antenna complexes and RCs is strongly dependent on the inner coherence, i.e. on the delocalization of the excited states. For example, a delocalization over Ncoh = 4–5 pigments in the bacterial light-harvesting complex 1 (LH1) core-antenna results in an increase (by a factor of about Ncoh) in the rate of energy transfer to the RC located in the centre of the ring-like LH1 complex.43,44 In the PSII-RC a disorder-dependent delocalization provides directed energy transfer to one of the primary donors, thus allowing a conformation-induced switch between the two charge-transfer pathways.5Notice that the inner coherence is not only affected by the disorder, but can further be destroyed by reorganization (producing dynamic localization). In antenna complexes this phenomenon can be sizable, but not dominant (coherence still exists in pigment–pigment couplings as small as 20 cm−1).45 In the case of electron transfer (ET) in RCs the situation is fundamentally different. The CT states are strongly displaced along the reaction coordinate (in other words, they are characterized by much bigger reorganization energy as compared to the excited states). Mixing of the electronic ZPL transitions of the exciton and CT states is only subtle in this case, so that pure electronic coherence cannot significantly improve the primary charge transfer step. On the other hand, in the presence of vibrations the exciton–CT mixing can be significant even for a very big reorganization. Thus, in ref. 7 we have considered an example, when the exciton–CT reorganization is about 2000 cm−1, whereas the exciton–CT coupling is only 70 cm−1. Mixing between ZPLs is negligible in this case. But when the vibrational quantum is in resonance with the exciton–CT gap the mixing between the exciton ZPL and the vibrational sublevel of CT is almost complete, producing fast ET. Thus, an inner coherence in ET plays an important role, but this is a special type of coherence (i.e. involving a vibrational quantum!). As we have seen (Fig. 5) in the coherent regime a significant part of the excitation density is transferred to the CT state within just 100 fs. This is as fast as pure exciton relaxation between, for instance, excitonic states with a relatively small relative displacement.
Finally, it should be emphasized that the inner coherence, or delocalization (that significantly affects both the EET and ET), is an intrinsic property of each excited state and therefore does not depend on how this state is excited. However, excitation of many states (producing their superposition) will create different initial populations, and therefore, different kinetics. Obviously, kinetics can change dramatically if we compare cases such as (i) selective excitation of a single exciton/vibronic level, or (ii) non-coherent superposition of several eigenstates created by an incoherent source with a broad spectrum, or (iii) coherent superposition produced by a laser pulse. In the latter case the coherent part of the dynamics can produce faster and more directed EET/ET, but these ‘dynamic’ effects will disappear upon natural, non-coherent excitation. In contrast with the laser-induced dynamic coherence, a delocalization within eigenstates (inner coherence) also remains upon natural excitation. Therefore, a significant (several times) speeding-up of EET (via delocalized excitations) and ET (via mixing with resonant vibrations) occurs under natural conditions with essentially non-coherent and non-impulsive excitation by sunlight. For instance, the vibration-assisted mixing of the PD1/PD2 and PD2+PD1− states will always speed up the PD1/PD2 → PD2+PD1− transfer, even upon non-coherent excitation of the primary donor (PD1/PD2). Obviously, when the primary donor from the second pathway (ChlD1) is excited, then ET will occur via the ChlD1 → ChlD1+PheD1− path. Therefore, a broad-band non-coherent excitation by sunlight will result in the co-existence of the two pathways with weight factors of about 0.6 and 0.4, as given by relative populations of PD2+PD1− (mixed with PD1/PD2) and the localized ChlD1 state (see Fig. 4–6).
3.3. Quantum design of ET: what is the reason?
As we have seen, the primary charge separation in photosynthesis is optimized by involving quantum principles. The question is why Nature uses quantum design in order to organize an effective energy conversion? Here we briefly overview some arguments emerging from the present study.First of all, it should be noticed that the charge separation in photosynthetic units (after long-range energy migration within the antenna) should be irreversible in order to prevent back transfers to the antenna (where the excitation may be lost or trapped). To compete with detrapping, the charge separation event starting from some high-energy excited state with subsequent energy localization within a lower in energy CT must be as quick as possible. Quasi-classical hopping between non-mixed exciton and CT states is slow. Mixing (i.e. a quantum superposition) of the two states can create much faster electron transfer.
The problem is that the CT (more strongly coupled to phonons) is characterized by a bigger displacement of its potential along nuclear coordinates as compared to a typical excited state. Excitation in such a set of states is dynamically localized near the bottom of the two potentials. The zero-phonon states localized near the potential minima of the CT state and the excited state are not mixed even in the case of strong electrostatic coupling between the two states. In other words, the classical localized limit is recovered. However, the presence of nuclear modes with the energy of their vibrational quantum close to the energy gap between the two electronic states creates non-classical effects speeding up charge transfer. In such a resonant case quantum superposition of vibrational sublevels can create an effective mixing of the two electronic states, thus promoting a faster penetration of excitation energy within the CT potential. Configuration of a dimer with CT character where intra-molecular vibrational quantum matches the energy gap between the exciton and CT levels is an example of quantum design in natural photosynthesis.
We conclude that the main reason for quantum design is that the classical motion between two potential wells is too slow. The main principles of realization of the quantum scenario are:
1. Quantum delocalization over the electronic states allows a faster transfer between them.
2. If dynamic localization competes with delocalization (as in the case of CT states in RCs), a mixing of the states is still possible via involvement of a vibrational quantum.
3. Vibration-assisted mixing (and the donor–acceptor transfer rate) increases dramatically in the case of electron–vibrational resonance.
It is important that the coherent mixing assisted by vibrations occurs within eigenstates, and therefore, it increases the rate of charge separation along a particular direction (corresponding to a particular pathway) not only upon coherent excitation, but also in natural photosynthesis.
3.4. What we have learned about quantum design of the PSII-RC
Our modeling of primary charge separation in the PSII-RC has shown how quantum effects work in this particular RC. The numerical examples considered above have shown a lot of interesting features. Among them are:1. Mixing of vibrational sublevels of the CT (lying below the excited states manifold) with the exciton ZPLs can dramatically change the structure of the excited states, including borrowing of dipole strength from the exciton levels, splitting of intense exciton ZPLs into two mixed exciton-vibrational states (in the case of resonance), or shifting of the ZPLs (when the vibrational frequency is out of resonance).
2. The exciton–CT mixing assisted by a vibrational quantum is responsible for a fast (100 fs!) coherent phase of charge separation.
3. The exciton–CT coherence creates the possibility of fast energy penetration into the CT, but to make it irreversible a decoherence (dephasing) induced by coupling to the electronic and vibrational baths is needed. We have found that the vibrational bath has a more pronounced effect on the speed of primary charge separation than the electronic bath.
4. The exciton–CT decoherence in the PSII-RC is very fast, i.e. it occurs after the first half-period of quantum beats between the excited states and the CT (corresponding to a coherent population of the CT).
5. The coherent CT population does also exist out of resonance, but the degree of exciton–CT mixing out of resonance is not so high, so the amplitude of the fast component is reduced.
6. The fast component existing out of resonance is connected with the quick coherent population of vibrational sublevels of the CT. But the dynamic localization at the lowest (ZPL) CT level (acting as the intermediate for further charge separation steps) is slower out of resonance.
7. The fast coherent phase can be visible in spectral responses also in the presence of the disorder, but at larger delays, the exciton and exciton-vibrational coherences are washed out due to the spread of their frequencies, so that only vibrational coherences survive.
A. Appendix: theoretical approach
A1. Electron–vibrational Hamiltonian
The system (exciton-vibrational) Hamiltonian in the site (diabatic) representation is given by: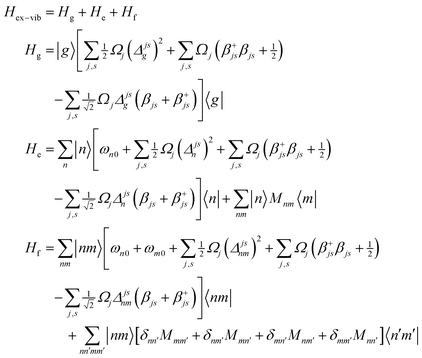 | (A1) |
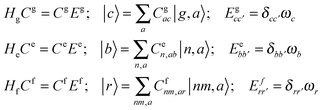 | (A2) |
 | (A3) |
A2. System–bath Hamiltonian
The system–bath Hamiltonian in the site representation is given by: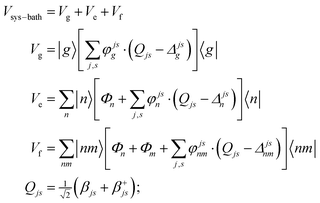 | (A4) |
The coupling of the n-th site to the bath degrees of freedom (phonon and vibrational modes of the environment) are described by the correlation function given by 〈Φn(t)Φn(0)〉. In the frequency domain the system–bath coupling is described by the spectral density C(ω), which is given by the Fourier transformation of this correlation function 〈Φn(t)Φn(0)〉 (a more detailed explanation of these features is given in ref. 18). Switching from the site representation to the exciton basis, one can find that fluctuations of the site energies produce off-diagonal dynamic disorder, i.e. fluctuations connecting different exciton eigenstates (and inducing relaxation between any pair of the exciton states, containing some participation of the n-th site). The Redfield relaxation tensor, which arises from the perturbative treatment of the system–bath interaction in the exciton basis, is proportional to the spectral density C(ω) and to the exciton wavefunction amplitudes (giving participation of the n-th site to the exciton states involved). In this manner, the Φ term in eqn (A4) is responsible for electronic relaxation. Similarly, it can be shown that the fluctuation term represented by the product of φ and the vibrational coordinate Q (counted from the potential minimum) induces relaxation between the neighboring vibrational sublevels (a → a ± 1) of a harmonic oscillator. The combined action of the two terms (acting on the electronic and vibrational system coordinates) describes a relaxation within a mixed exciton-vibrational (vibronic) manifold.
Notice that in eqn (A4) we neglect the off-diagonal coupling, i.e. bath-induced modulation of interaction energies Mnm. We suppose that fluctuations acting on different sites (n), different vibrational modes (j), and different nuclear coordinates (s) are uncorrelated. In the following it is convenient to treat the φg, φn, φnm, and Φn quantities as dimensionless. The matrix elements of the system–bath Hamiltonian in the eigenstate (adiabatic) representation are:
 | (A5) |
A3. Redfield relaxation tensor
The Redfield tensor can be calculated using a standard method:49–51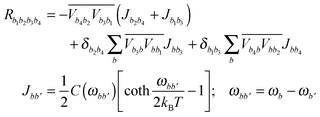 | (A6) |
In the present modeling (4-state model with a single vibration, i.e. n = 1–4, j = 1, s = 1–4) we suppose for simplicity that
 | (A7) |
Acknowledgements
V. I. N. was supported by the Russian Foundation for Basic Research (Grant No. 15-04-02136); E. R. and R. v. G. were supported by the VU University Amsterdam, the Laserlab-Europe Consortium, the TOP grant (700.58.305) from the Foundation of Chemical Sciences part of NWO, the advanced investigator grant (267333, PHOTPROT) from the European Research Council, and the EU FP7 project PAPETS (GA 323901). R. v. G. gratefully acknowledges his Academy Professor grant from the Netherlands Royal Academy of Sciences (KNAW) and J. P. was supported by Ministerío de Economía y Competitividad Project No. FIS2015-69512-R and the Fundación Séneca Project No. 19882/GERM/15.References
- R. van Grondelle, J. P. Dekker, T. Gillbro and V. Sundström, Biochim. Biophys. Acta, Bioenerg., 1994, 1187, 1–65 CrossRef.
- R. E. Blankenship, Molecular Mechanisms Of Photosynthesis., Blackwell Science Ltd, Oxford, 2002 Search PubMed.
- V. I. Novoderezhkin, J. P. Dekker and R. van Grondelle, Biophys. J., 2007, 93, 1293–1311 CrossRef CAS PubMed.
- E. Romero, B. A. Diner, P. J. Nixon, W. J. Coleman, J. P. Dekker and R. van Grondelle, Biophys. J., 2012, 103, 185–194 CrossRef CAS PubMed.
- E. Romero, R. Augulis, V. I. Novoderezhkin, M. Ferretti, J. Thieme, D. Zigmantas and R. van Grondelle, Nat. Phys., 2014, 10, 676–682 CrossRef CAS PubMed.
- F. D. Fuller, J. Pan, A. Gelzinis, V. Butkus, S. Seckin Senlik, D. E. Wilcox, C. F. Yocum, L. Valkunas, D. Abramavicius and J. P. Ogilvie, Nat. Chem., 2014, 6, 706–711 CAS.
- V. I. Novoderezhkin, E. Romero and R. van Grondelle, Phys. Chem. Chem. Phys., 2015, 17, 30828–30841 RSC.
- E. Romero, I. H. M. van Stokkum, V. I. Novoderezhkin, J. P. Dekker and R. van Grondelle, Biochemistry, 2010, 49, 4300–4307 CrossRef CAS PubMed.
- V. I. Novoderezhkin, E. Romero, J. P. Dekker and R. van Grondelle, ChemPhysChem, 2011, 12, 681–688 CrossRef CAS PubMed.
- M. Schröter, S. Ivanov, J. Schulze, S. Polyutov, Y. Yan, T. Pullerits and O. Kühn, Phys. Rep., 2015, 567, 1–78 CrossRef.
- L. Z. Sharp and D. Egorova, J. Chem. Phys., 2013, 139, 144304 CrossRef PubMed.
- C. Kreisberk and T. Kramer, Chem. Phys. Lett., 2012, 3, 2828–2833 CrossRef.
- N. Christensson, H. F. Kauffmann, T. Pullerits and T. Mančal, J. Phys. Chem. B, 2012, 116, 7449–7454 CrossRef CAS PubMed.
- V. Tiwari, W. K. Peters and D. M. Jonas, Proc. Natl. Acad. Sci. U. S. A., 2013, 110, 1203–1208 CrossRef CAS PubMed.
- A. W. Chin, J. Prior, R. Rosenbach, F. Caycedo-Soler, S. F. Huelga and M. B. Plenio, Nat. Phys., 2013, 9, 113–118 CrossRef CAS.
- E. J. O'Reilly and A. Olaya-Castro, Nat. Commun., 2014, 5, 3012 Search PubMed.
- A. G. Dijkstra, C. Wang, J. Cao and G. R. Fleming, Chem. Phys. Lett., 2015, 6, 627–632 CrossRef CAS PubMed.
- P. Malý, O. J. G. Somsen, V. I. Novoderezhkin, T. Mančal and R. van Grondelle, ChemPhysChem, 2016, 17, 1356–1368 CrossRef PubMed.
- C. Kreisbeck, T. Kramer and A. Aspuru-Guzik, J. Phys. Chem. B, 2013, 117, 9380–9385 CrossRef CAS PubMed.
- J. Prior, E. Castro, A. W. Chin, J. Almeida, S. F. Huelga and M. B. Plenio, J. Chem. Phys., 2013, 139, 224103 CrossRef PubMed.
- A. Volpato and E. Collini, Opt. Express, 2015, 23, 20040–20050 CrossRef PubMed.
- E. Romero, J. Prior, A. W. Chin, S. E. Morgan, V. I. Novoderezhkin, M. B. Plenio, R. van Grondelle. Quantum-coherent dynamics in photosynthetic charge separation: wavelet analysis reveals long-lived functional vibronic coherence, submitted.
- G. Raszewski, W. Saenger and T. Renger, Biophys. J., 2005, 88, 986–998 CrossRef CAS PubMed.
- G. Raszewski, B. A. Diner, E. Schlodder and T. Renger, Biophys. J., 2008, 95, 105–119 CrossRef CAS PubMed.
- I. V. Shelaev, F. E. Gostev, M. I. Vishnev, A. Ya. Shkuropatov, V. V. Ptushenko, M. D. Mamedov, O. M. Sarkisov, V. A. Nadtochenko, A. Yu. Semenov and V. A. Shuvalov, J. Photochem. Photobiol., B, 2011, 104, 44–50 CrossRef CAS PubMed.
- K. L. M. Lewis, F. D. Fuller, J. A. Myers, C. F. Yocum, S. Mukamel, D. Abramavicius and J. P. Ogilvie, J. Phys. Chem. A, 2013, 117, 34–41 CrossRef CAS PubMed.
- A. Gelzinis, L. Valkunas, F. D. Fuller, J. P. Ogilvie, S. Mukamel and D. Abramavicius, New J. Phys., 2013, 15, 075013 CrossRef.
- L. Zhang, D.-A. Silva, H. Zhang, A. Yue, Y. Yan and X. Huang, Nat. Commun., 2014, 5, 4170 CAS.
- T. Renger, Phys. Rev. Lett., 2004, 93, 188101 CrossRef PubMed.
- T. Mančal, L. Valkunas and G. R. Fleming, Chem. Phys. Lett., 2006, 432, 301–305 CrossRef.
- S. Vaitekonis, G. Trinkunas and L. Valkunas, Photosynth. Res., 2005, 86, 185–201 CrossRef CAS PubMed.
- V. I. Novoderezhkin, R. Croce, Md. Wahadoszamen, I. Polukhina, E. Romero and R. van Grondelle, Phys. Chem. Chem. Phys., 2016, 18, 19368–19377 RSC.
- V. I. Novoderezhkin, A. G. Yakovlev, R. van Grondelle and V. A. Shuvalov, J. Phys. Chem. B, 2004, 108, 7445–7457 CrossRef CAS.
- S. L. S. Kwa, W. R. Newell, R. van Grondelle and J. P. Dekker, Biochim. Biophys. Acta, 1992, 1099, 193–202 CrossRef CAS.
- M. Ferretti, V. I. Novoderezhkin, E. Romero, R. Augulis, A. Pandit, D. Zigmantas and R. van Grondelle, Phys. Chem. Chem. Phys., 2014, 16, 9930–9939 RSC.
- S. Mukamel, Principles of Nonlinear Optical Spectroscopy, Oxford University Press, Oxford, 1995, p. 549 Search PubMed.
- P. Rebentrost, M. Mohseni and A. Aspuru-Guzik, J. Phys. Chem. B, 2009, 113, 9942–9947 CrossRef CAS PubMed.
- F. Fassioli, A. Olaya-Castro and G. D. Scholes, J. Phys. Chem. Lett., 2012, 3, 3136–3142 CrossRef CAS PubMed.
- A. W. Chin, S. F. Huelga and M. B. Plenio, Philos. Trans. R. Soc., A, 2012, 370, 3638–3657 CrossRef CAS PubMed.
- A. Chenu, P. Malý and T. Mančal, Chem. Phys., 2014, 439, 100–110 CrossRef CAS.
- K. M. Pelzer, T. Can, S. K. Gray, D. K. Morr and G. S. Engel, J. Phys. Chem. B, 2014, 118, 2693–2702 CrossRef CAS PubMed.
- F. Fassioli, R. Dinshaw, P. C. Arpin and G. D. Scholes, J. R. Soc., Interface, 2014, 11, 20130901 CrossRef PubMed.
- V. I. Novoderezhkin and A. P. Razjivin, Chem. Phys., 1996, 211, 203–214 CrossRef CAS.
- R. van Grondelle and V. I. Novoderezhkin, in The Purple Phototrophic Bacteria, Advances in Photosynthesis and Respiration, ed. C. N. Hunter, F. Daldal, M. C. Thurnauer and J. T. Beatty, Springer, The Netherlands, 2008, ch. 13, vol. 28, pp. 231–252 Search PubMed.
- V. I. Novoderezhkin and R. van Grondelle, J. Phys. Chem. B, 2013, 117, 11076–11090 CrossRef CAS PubMed.
- J. M. Jean, R. A. Friesner and G. R. Fleming, J. Chem. Phys., 1992, 96, 5827–5842 CrossRef CAS.
- J. M. Jean, J. Chem. Phys., 1994, 101, 10464–10473 CrossRef CAS.
- J. M. Jean and G. R. Fleming, J. Chem. Phys., 1995, 103, 2092–2101 CrossRef CAS.
- A. G. Redfield, Adv. Magnesium Res., 1965, 1, 1–32 Search PubMed.
- W. T. Pollard and R. A. Friesner, J. Chem. Phys., 1994, 100, 5054–5065 CrossRef CAS.
- W. T. Pollard, A. K. Felts and R. A. Friesner, Adv. Chem. Phys., 1996, 93, 77–134 CrossRef CAS.
Footnote |
| † Electronic supplementary information (ESI) available. See DOI: 10.1039/c6cp07308e |
| This journal is © the Owner Societies 2017 |

