 Open Access Article
Radical recombination in interstellar ices, a not so simple mechanism
Teddy
Butscher
*a,
Fabrice
Duvernay
*a,
Albert
Rimola
*b,
Mireia
Segado-Centellas
*b and
Thierry
Chiavassa
*a
aAix-Marseille Université, Laboratoire PIIM, Team ASTRO, Service 252, Saint Jérôme, Ave. Escadrille Normandie Niemen, 13013 Marseille, France. E-mail: fabrice.duvernay@univ-amu.fr; teddy.butscher@univ-amu.fr
bDepartament de Quimica, Universitat Autonoma de Barcelona, 08193 Bellaterra, Spain. E-mail: Albert.Rimola@uab.cat
First published on 8th December 2016
Abstract
Many complex organic molecules (hereafter COMs) have been detected in different regions of the interstellar medium (ISM). In each region, different energetic processes – UV irradiation, atom bombardments, etc. – that could be linked to the formation of detected COMs may occur depending on the environment. Several formation mechanisms were proposed but increasing attention is paid to radical recombination reactions. Previous studies showed that glycolaldehyde (HC(O)CH2OH) and ethylene glycol (HOCH2CH2OH) are formed by radical recombination between HC˙O and ˙CH2OH, and by ˙CH2OH dimerisation, respectively. Formyl (HC˙O), one of the most famous astrophysically-relevant radical species, has been detected as a gaseous component of the ISM. Its reactivity was already attributed to the formation of several COMs. This work aims to study the dimerisation of formyl radical HC˙O using a cryogenic matrix technique. The evolution of the chemical sample composition is monitored by infrared spectroscopy and by mass spectrometry during temperature programmed desorption (TPD) monitoring. Results indicate that the reaction of one HC˙O with another does not lead to the direct formation of glyoxal (HC(O)C(O)H) but yields H2CO and CO. Results are also compared with those for the reaction between two ˙CH2OH radicals and the recombination between HC˙O and ˙CH2OH. Also, glyceraldehyde was tentatively detected in our experiment using different spectroscopic techniques. A radical mechanism is proposed to explain its formation in our experiments. Complementary quantum chemical calculations provide an atomistic interpretation of the experimental findings.
1 Introduction
Almost 200 molecular species have been detected in the interstellar medium (ISM). Most of them are simple molecules, such as water (H2O), ammonia (NH3) or formaldehyde (H2CO), but larger and more complex molecules also exist. Some of them are complex organic molecules (COMs), molecules with more than 5 atoms containing one or multiple C atoms, and they are the proof of a very complex chemistry occurring in the ISM. The diversity of COMs is impressive; however, only 50 of them were clearly identified in different environments of the ISM such as star-forming regions or small bodies.1 Accordingly, the environment seems to play an important role in the formation of COMs since all COMs are not detected in the same type of observed objects.2–4 A proper understanding of the formation mechanisms can help us explain why a given COM is present in a given environment.5 Unfortunately, in most of the cases, we are unaware of the formation mechanism of COMs.For the most commonly detected/interesting COMs, different formation mechanisms have been proposed. Gas-phase reactions were the first kind of mechanisms proposed but they do not explain all the COM formation. Currently, there is increasing attention paid to radical reactivity in the solid state. In this scenario, radicals can be generated by incidence of UV radiation and cosmic rays on ices, in which iced neutral molecules are homolytically dissociated, and also by hydrogenation of unsaturated iced molecules.6,7 This latter scenario occurs, for instance, during hydrogenation of CO in dark molecular clouds:6,8
 | (1) |
| ˙CH2OH + HC˙O → HOCH2CHO |
| ˙CH2OH + ˙CH2OH → HOCH2CH2OH | (2) |
2 Experimental setup
2.1 Experimental details
A cryogenic matrix system is a technique that isolates molecules in a rare gas matrix under ISM-like conditions. This way, we are able to characterize unstable species such as radicals. The matrix gas used in this experiment is argon Ar (99.999% of purity) and was purchased from air liquide. To form our target radical, our precursor molecule is formaldehyde (H2CO) and was bought as a polymer from Sigma Aldrich with 99.95% of purity. To produce the monomeric form of H2CO in the gas phase, the polymer is heated up to 90 °C under vacuum.The experiments are conducted under high vacuum, between 10−8 mbar and 10−9 mbar, depending on the temperature. The higher the temperature, the lower the pressure. Temperature of our system is monitored using a 21 CTI cold head combined with a resistive heater and a Lakeshore 331 temperature controller. Temperature changes are performed with a 4 K min−1 ramp. Rare gas and monomeric formaldehyde were mixed in the gas phase in a 0.5![[thin space (1/6-em)]](https://www.rsc.org/images/entities/char_2009.gif) :
:![[thin space (1/6-em)]](https://www.rsc.org/images/entities/char_2009.gif) 1000 ratio of H2CO/Ar in a Pyrex vacuum line monitored by standard manometric techniques. This mixture is deposited with a rate of 0.1 mbar s−1 (10 μmol s−1) on a copper surface maintained at 14 K.
1000 ratio of H2CO/Ar in a Pyrex vacuum line monitored by standard manometric techniques. This mixture is deposited with a rate of 0.1 mbar s−1 (10 μmol s−1) on a copper surface maintained at 14 K.
The goal of the VUV photolysis step is to produce radical reactants from the H2CO precursor. The condition of formation is described in Table 1. This was performed using H2 plasma induced by microwaves from a microwave generator (Opthos instruments) and stabilized using a microwave magnetic applicator (Boreal Plasma). The principal wavelength of H2 plasma is 121.6 nm from Lyman α emission.
| Radical species after annealing at 30 K | ˙CH2OH + HC˙O | HC˙O |
| Consumed amount of H2CO | 75% | 99% |
| Irradiation time (Lyman-α) | 22 hours | 47 hours |
| Ref. | Butscher et al. 20157 | This work |
Emitted flux from the plasma is transmitted through a MgF2 window and was estimated at 2.5 × 10¹³ photons cm−2 s−1 using the O2 → O3 actinometry method. Compared to the UV secondary radiation observed in dense molecular cloud in the ISM, this flux is 1010 times larger.
Irradiation plays a major role in the study of reactivity. The objective of our previous work7 and this work is to observe HC˙O reactivity with different astrophysically relevant species. To do so, irradiation time is chosen to monitor the chemical composition inside the matrix. By irradiating H2CO, HC˙O is formed and, depending on the irradiation time, other species are also produced as described in Table 1. The next step is sample annealing. Here, the sample is heated up to 20/30 K for 10 minutes before cooling it down to 14 K. The objective of this manipulation is to weaken the matrix cage. Thus, large molecules can change positions or sites while smaller species could diffuse through the matrix.
These small molecules can form complexes with other molecules or react to produce other molecules. The latter occurs with H-atoms. Thus, the annealing step can induce hydrogenation reactions inside the matrix whenever it is possible. The duration of annealing is chosen to consume all H-atoms during the hydrogenation reaction to form larger molecules, assuring that no more reactions occur in the matrix state after this step.
The last step is the desorption of the rare gas. To do so, the sample is heated up to 35 K and kept at this temperature. Thus, argon progressively desorbs and all radical species react to form COMs. Once the rare gas completely desorbed, the sample is heated up to 300 K with a 4 K min−1 ramp. During the ramp, desorbing species are analysed by mass spectrometry using a residual gas analyzer quadrupole system (MKS Microvision-IP plus) along with a 70 eV impact electronic source and ion current is recorded for a temperature programmed desorption (TPD) profile.
For every step of this experiment, the chemical composition of our ice analogue is analysed by infrared spectroscopy, using a Bruker Tensor 27 Fourier transform infrared (FTIR) spectrometer with a MCT detector in the reflection–absorption mode. Resolution of the spectra is set at 0.5 cm−1 and each spectrum is taken with 20 scans. Reference is averaged over 100 scans with 0.5 cm−1 for a better compensation.
2.2 Computational methods
Quantum chemical calculations have been used to simulate the gas-phase reactivity of HC˙O + HC˙O and formation of glyceraldehyde HC(O)CHOHCH2OH. Calculations were performed using the GAUSSIAN09 program package.13 The structures of the molecular stationary points were fully optimized using the global hybrid M06-2X functional14 combined with the a posteriori Grimme s D3 correction15 to take dispersion interactions into account, and employing Dunning's augmented correlation consistent polarized triple zeta (aug-cc-pvtz) basis set.16 All structures were characterized by the analytical calculation of the harmonic frequencies as minima (reactants, intermediates, and products) and saddle points (transition states) without employing any scaling factor. Thermochemical corrections to the potential energy values to obtain zero-point energy corrected values were carried out using the standard rigid rotor harmonic oscillator formulas.17 For those reactions involving two radical species, the starting guess was open shell broken symmetry.3 Experimental results
3.1 Infrared experiments
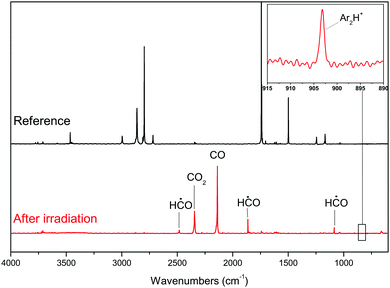
The deposition of the formaldehyde/argon mixture onto the sample at 14 K leads to the infrared spectrum displayed in Fig. 1.Infrared frequencies and assignments of formaldehyde are displayed in Table 2. As shown in Fig. 1 with the reference spectrum, in the Ar matrix the main bands of H2CO are those at 2864, 2798, 1742 and 1499 cm−1. These absorptions correspond to the asymmetric and symmetric CH stretching modes, the C![[double bond, length as m-dash]](https://www.rsc.org/images/entities/char_e001.gif) O stretching mode and the CH bending mode, respectively. These bands are down-shifted upon 13C isotopic substitution.10 Since the infrared signature of the formaldehyde dimer is not detected after the deposition, we can conclude that formaldehyde is trapped as a monomer inside the matrix.18,19 Furthermore, photolysis of the formaldehyde dimer in a matrix is known to produce glycolaldehyde GA HC(O)CH2OH.20 GA remains undetected in our sample, confirming the absence of formaldehyde dimers in our sample.
O stretching mode and the CH bending mode, respectively. These bands are down-shifted upon 13C isotopic substitution.10 Since the infrared signature of the formaldehyde dimer is not detected after the deposition, we can conclude that formaldehyde is trapped as a monomer inside the matrix.18,19 Furthermore, photolysis of the formaldehyde dimer in a matrix is known to produce glycolaldehyde GA HC(O)CH2OH.20 GA remains undetected in our sample, confirming the absence of formaldehyde dimers in our sample.
| Wave numbers (cm−1) | Assignments | |
|---|---|---|
| 12C | 13C | |
| ν: stretching; δ: bending; ρ: rocking; ω: wagging. | ||
| 3464 | 3389 | 2ν(CO) |
| 2997 | 2954 | 2δ(CH) |
| 2864 | 2846 | ν(CH) – a |
| 2798 | 2793 | ν(CH) – s |
| 2719 | 2708 | |
| 1742 | 1704 | ν(CO) |
| 1499 | 1499 | δ(CH) |
| 1245 | 1235 | ρ(CH) |
| 1168 | 1156 | ω(CH) |
The target of this work is to study the dimerisation reaction of the formyl HC˙O radical. Thus, the environment has to be controlled to make this reaction predominant. To do so, we irradiate the sample for 47 hours to consume almost all the initial formaldehyde to produce HC˙O. Remarkably, this also produces H atoms that can be trapped inside the matrix.
The bottom spectrum of Fig. 1 shows the recorded IR spectrum after the irradiation and Table 3 shows the associated IR assignments. The HC˙O radical is clearly identified by the bands at 2482, 1863 and 1085 cm−1, which correspond to its CH stretching, C![[double bond, length as m-dash]](https://www.rsc.org/images/entities/char_e001.gif) O stretching and CHO bending vibrational modes,10 respectively. CO and CO2 are also visible and characterized by their bands at 2138 cm−1 and 2345 cm−1 respectively, corresponding to the CO stretching mode. Finally, a band at 903 cm−1 is detected after photolysis. Its intensity increases with the irradiation duration, proving that it is a product of VUV photolysis. According to Kunttu et al.21 this band can be assigned to Ar2H+ since small hydrides are known to form ionic complexes in rare gas matrices.22
O stretching and CHO bending vibrational modes,10 respectively. CO and CO2 are also visible and characterized by their bands at 2138 cm−1 and 2345 cm−1 respectively, corresponding to the CO stretching mode. Finally, a band at 903 cm−1 is detected after photolysis. Its intensity increases with the irradiation duration, proving that it is a product of VUV photolysis. According to Kunttu et al.21 this band can be assigned to Ar2H+ since small hydrides are known to form ionic complexes in rare gas matrices.22
| Wave numbers (cm−1) | Assignments | Molecules | Evolution after annealing step | |
|---|---|---|---|---|
| 12C | 13C | |||
| ν: stretching; δ: bending; ρ: rocking; ω: wagging. | ||||
| 2482 | 2476 | ν(CH) | HC˙O | ↗ |
| 2345 | 2279 | ν(CO) | CO2 | — |
| 2138 | 2091 | ν(CO) | CO | ↗ |
| 1863 | 1823 | ν(CO) | HC˙O | ↗ |
| 1085 | 1078 | δ(CHO) | HC˙O | ↗ |
| 1039 | 1023 | ν(C–O) | CH3OH:CO | ↘ |
| 903 | 903 | ν(ArH) as | Ar2H+ | ↗ |
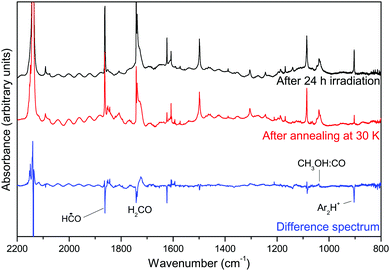
After VUV irradiation, we heat the sample up to 30 K for a short lapse of time (avoiding matrix desorption) and afterwards we cooled down the system to 14 K, described as the annealing step in the Experimental details. The recorded infrared spectrum indicates the presence of new species. Fig. 2 shows the difference spectrum between before and after annealing. Positive bands correspond to formed species and negative bands to consumed species. This spectrum is centred at 2200–800 cm−1 since there are no contributions outside this section.
One can observe that the difference spectrum presented is wave-shaped. This behaviour is due to the optic effect of the matrix. Indeed, the presence of matrix cages causes diffraction and dispersion of the light, which appear as interference figures in the spectrum. Heating the sample causes the matrix to be more flexible, allowing small chemical species to diffuse through the matrix. It is also known that this step could neutralize the Ar2H+ complex releasing H atoms, which in turn can diffuse inside the matrix and react with other molecules via hydrogenation reactions.21 This phenomenon is observed with the disappearance of the 903 cm−1 infrared band after annealing. At the same time, hydrogenation reactions occur, since the CO band at 2138 cm−1 decreases.
Although HC˙O is reformed via CO hydrogenation, formyl radical bands in general decrease, particularly the 1854 cm−1 C![[double bond, length as m-dash]](https://www.rsc.org/images/entities/char_e001.gif) O stretching contribution, proving that it is more consumed to form H2CO than produced. No traces of the hydroxymethyl (˙CH2OH) radical were detected but a band at 1039 cm−1 appears after annealing. This contribution is attributed to the CH3OH:CO complex and was already observed in previous works.7,23 Its presence can be explained by two phenomena. First, thanks to photolysis, H-atoms were produced and trapped inside the matrix. Annealing will trigger H-atom diffusion, thus the hydrogenation reaction will occur on H2CO and will lead to the formation of CH3OH. Secondly, CO diffuses in the vanishing matrix environment24 and encounters CH3OH thus forming a CH3OH:CO complex.
O stretching contribution, proving that it is more consumed to form H2CO than produced. No traces of the hydroxymethyl (˙CH2OH) radical were detected but a band at 1039 cm−1 appears after annealing. This contribution is attributed to the CH3OH:CO complex and was already observed in previous works.7,23 Its presence can be explained by two phenomena. First, thanks to photolysis, H-atoms were produced and trapped inside the matrix. Annealing will trigger H-atom diffusion, thus the hydrogenation reaction will occur on H2CO and will lead to the formation of CH3OH. Secondly, CO diffuses in the vanishing matrix environment24 and encounters CH3OH thus forming a CH3OH:CO complex.
To sum up, after annealing, the present species are CO, HC˙O, traces of H2CO and CH3OH forming an intermolecular complex with CO.
The last step is rare gas desorption, which in the case of Ar takes place at 35 K. At this temperature, matrix cages disappear and all trapped species become free and available to react. The sample changes from the matrix state to a solid film. This results in the broadening of the infrared contributions since intermolecular interactions are not prevented. At this temperature, CO is also desorbing. Thus, the only species remaining in large quantities inside the sample are CO2 and HC˙O. No reaction between these two species is expected (or at least it has not been reported yet). Thus, we consider that the main reactivity arises from different HC˙O species. This assumption is supported by the fact that CO2 is still detected in a high quantity at a higher temperature. The initial assumption is the occurrence of C–C coupling between two HC˙O molecules to form glyoxal (HC(O)C(O)H). Thus, it is expected that its IR features should be clearly recorded and identified in the IR spectrum recorded on the solid film obtained after Ar desorption.
Fig. 3 displays the infrared spectrum of the solid film obtained after rare gas desorption at 45 and 120 K. It was reported in the literature that HC˙O can be present in solid films submitted to VUV irradiation12 meaning that it could be present after rare gas desorption without reacting. However, in our experiments, no characteristic spectral signatures of HC˙O were identified after argon desorption.
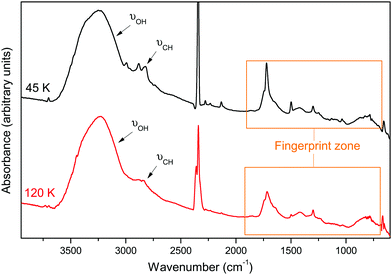 | ||
| Fig. 3 Infrared spectra of the solid film after rare gas desorption at 45 K and 120 K. The orange delimited zone is the fingerprint zone 2000–900 cm−1. | ||
This means that most of the formyl radical has already reacted during Ar desorption. In addition, during the warming of the solid film from 45 K to 120 K, despite formaldehyde desorption, no other changes are observed in the IR spectrum shown in Fig. 3 confirming that most of the reactive species already reacted after Ar desorption.
All the infrared bands and assignments present in Fig. 3 are listed in Table 4. A broad OH stretching band at 3238 cm−1 is detected in the solid film. It is mostly due to the presence of H2O in our sample but it could also arise from the contribution of other hydroxyl-bearing molecules. Another band centred at 2843 cm−1 and corresponding to the CH stretching mode of one or more molecules is also detected in both spectra. The zone covering the 2000–900 cm−1 range presents multiple and complex signatures. This region is called the fingerprint zone and is crucial for the proper identification of the species present in the sample.
| Wave numbers (cm−1) | Assignments | Molecules | |
|---|---|---|---|
| 12C | 13C | ||
| a ν: stretching; δ: bending; ρ: rocking; ω: wagging. Tentative assignment. | |||
| 3238 | 3238 | ν(OH) | H2O |
| 2843 | 2838 | ν(CH) | H2CO |
| 2345 | 2276 | ν(CO) | CO2 |
| 1735 | 1710 |
ν(C![[double bond, length as m-dash]](https://www.rsc.org/images/entities/char_e001.gif) O) O) |
HC(O)CHOHCH2OHa |
| 1715 | 1683 |
ν(C![[double bond, length as m-dash]](https://www.rsc.org/images/entities/char_e001.gif) O) O) |
H2CO |
| 1638 | 1629 | δ(OH) | H2O |
| 1500 | 1500 | δ(CH2) | H2CO |
| 1300 | 1287 | δ(CH) | CH4 |
| 1035 | 1035 | — | O3 |
| 700 | 700 | Libration mode | H2O |
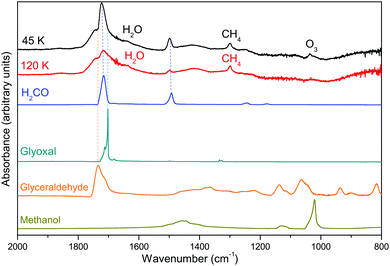
Fig. 4 displays the infrared spectrum of the solid film at 45 K and 120 K in the 2000–900 cm−1 zone. The intense band detected at 1715 cm−1 is assigned to the C![[double bond, length as m-dash]](https://www.rsc.org/images/entities/char_e001.gif) O stretching mode. One possible source for this band is formaldehyde. The C
O stretching mode. One possible source for this band is formaldehyde. The C![[double bond, length as m-dash]](https://www.rsc.org/images/entities/char_e001.gif) O stretching of formaldehyde is detected close to 1715 cm−1, and its C–H stretching and bending modes are associated with the large bands at 2855 cm−1 and 1500 cm−1, respectively. By comparing the infrared signatures of formaldehyde in the matrix state and in the solid state after matrix desorption, it seems that the amount of this species increases after rare gas desorption. However, the difference of the band strength in the two environments; i.e., the matrix and solid state, makes difficult to confirm this aspect.
O stretching of formaldehyde is detected close to 1715 cm−1, and its C–H stretching and bending modes are associated with the large bands at 2855 cm−1 and 1500 cm−1, respectively. By comparing the infrared signatures of formaldehyde in the matrix state and in the solid state after matrix desorption, it seems that the amount of this species increases after rare gas desorption. However, the difference of the band strength in the two environments; i.e., the matrix and solid state, makes difficult to confirm this aspect.
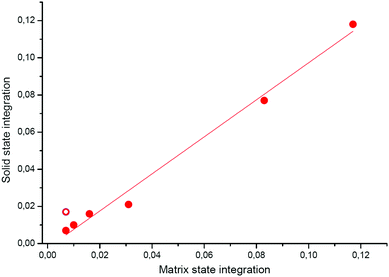
In order to have deeper insights into this point, we carried out additional experiments by trapping different amounts of H2CO in the Ar matrix and comparing the integration of the 1494 cm−1 band in the matrix state and in the solid state after matrix desorption, which is plotted in Fig. 5. With this plot, we are able to see the correlation between formaldehyde integration in two environments, matrix and solid states.
The plot exhibits a linear behaviour, proving that the band strength in both states is proportional. It also shows that if formaldehyde is not formed or consumed during the phase transition, the ratio of integration in both states should appear on this linear plot. In our experiment, this ratio appears shifted from the linear plot, as shown in Fig. 5. As it is slightly higher than the linear plot, we can assume that formaldehyde was effectively formed during the transition, thus after the rare gas desorption.
The peak centred at 1715 cm−1 can also be contributed by other molecules formed during the experiments. According to our references, there are two possible candidates: (i) glyoxal (HC(O)C(O)H); or (ii) glyceraldehyde (HOC(O)OCHOHCH2OH), whose reference IR spectra are shown in Fig. 4.
Glyoxal, in addition to the band close to 1700 cm−1, also presents another band at 2881 cm−1. However, in our experiments, this band is overlapped by the C–H stretching mode of multiple species.
Glyceraldehyde presents other contributions aside from 1735 cm−1, at 1366, 1137 and 1066 cm−1. In our experiment, considering the intensity of the C![[double bond, length as m-dash]](https://www.rsc.org/images/entities/char_e001.gif) O stretching mode, these secondary peaks would be barely detectable.
O stretching mode, these secondary peaks would be barely detectable.
The spectrum recorded at 120 K presents a band near 1035 cm−1, which is missing in the spectrum recorded at 45 K. This band is attributed to the ozone (O3) O–O bending mode. Surprisingly, no major contributions of methanol CH3OH are detected after rare gas desorption, although it was detected inside the matrix (see above). Finally, two other species can also be identified. A peak at 1300 cm−1 hints the presence of methane (CH4) in our sample. Other CH4 contributions are probably present but overlapped by other species contributions. An unresolved peak is also detectable near 1600 cm−1, which is assigned to the OH bending mode of water (H2O).
At this stage, formaldehyde (H2CO), ozone (O3), methane (CH4) and water (H2O) are clearly identified but, only based on IR analysis, we are not able to determine if glyoxal and/or glyceraldehyde is formed.
3.2 Temperature programmed desorption experiments
Temperature programmed desorption (TPD) using a quadrupole mass spectrometer (QMS) was also monitored to identify species formed by radical reactivity during their thermal desorption. Due to a better sensitivity, this technique will allow us to confirm the presence of glyoxal or glyceraldehyde, as these two molecules do not have the same fragmentation pattern.This technique, however, has some disadvantages since it is based on the desorption of species from the sample holder. Each compound has its own desorption temperature, which is determined by performing reference desorption experiments of the pure compounds. In the case of mixtures, nonetheless, intermolecular interactions influence the desorption temperatures of the mixed species. That is, if one of the components desorbs first, intermolecular interactions induce the other components also to desorb although their desorption temperatures are higher. Also, if a compound is refractory, it can prevent volatile species to sublimate.
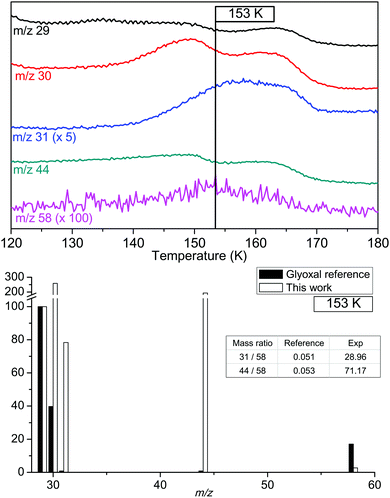
Fig. 6 displays the TPD evolutions of the characteristic masses of glyoxal. According to our references, glyoxal is known to desorb near 160 K. Its characteristic m/z values are 29, 30, 31, 44 and 58. In our experiment, detection of glyoxal is made by the presence of a m/z 58 signal in the TPD spectrum, which corresponds to the molecular ion peak of glyoxal. The mass of this peak is detected at 153 K. The intensity of the m/z 58 signal is very low compared to other masses. Fig. 6 shows the reference mass spectrum of glyoxal and two ratios between characteristic masses of glyoxal: m/z 44-over-m/z 58 and m/z 31-over-m/z 58 ratios. A difference appears between reference ratios and ratios of this experiment. Such a difference proves that glyoxal is far from being the dominant product at this temperature. Such low intensities indicate that glyoxal is present in very small quantities. Therefore, the 1735 cm−1 band cannot exclusively be explained by the presence of glyoxal alone. Other molecules must be present to reproduce the IR spectrum completely. To identify them, we focus on other masses. Other m/z also holds detectable signals at this temperature but they are shifted compared to the peak at m/z 58. The explanation of such shifts is the desorption of other present species.
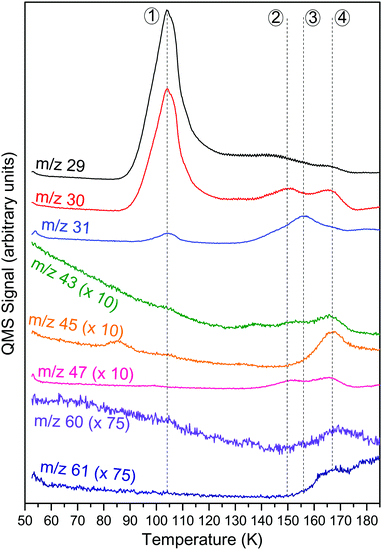
Other important TPD masses are displayed in Fig. 7. We identified four relevant characteristic peaks which are highlighted in the figure (from ① to ④), associated with at least four different species. The IR spectrum proves us that formaldehyde is present from 60 to 180 K. Thus, whenever a species desorbs, formaldehyde co-desorbs so every masses detected at a certain temperature will be a combination of masses from formaldehyde and from another molecule.
Peak ① appears at T = 100 K. At this temperature, the main peaks are at m/z 29 and m/z 30, which shift to m/z 30 and m/z 31, respectively, in the isotopic substitution 13C experiment. By comparing ① with references taken in our laboratory, we assign this peak to formaldehyde (H2CO). This is consistent with the disappearance of most of the formaldehyde IR signature at 100 K on the solid film spectrum. All the characteristic masses of formaldehyde were detected at this temperature. Moreover, a small contribution from m/z 31 is detected, related to the natural abundance of H213CO.
Peak ② displays important responses for m/z 29 and 30 at T = 148 K but other masses are also detected. The diversity of the responses makes impossible to assign this peak to one molecule alone, thus indicating the co-desorption of multiple species. An important change is detected in the infrared spectrum at this temperature. The contribution of water (H2O) is getting sharper, especially for the O–H stretching band at 3238 cm−1. This is due to a structural change of water from an amorphous to the crystalline state. This state change has important effects in the desorption of present species. According to Smith et al.25 this phase transition triggers the desorption of volatile species trapped in the water by a phenomenon called molecular volcano. Amorphous water ice is known to be more porous than the crystalline one. During the phase change, cracks and fissures can appear in the ice, creating a connection between porous bulk and the surface. In this way, part of the volatile compounds is able to desorb from the sample while the rest are trapped in the crystalline phase. According to the detected masses, we identify this peak as an indication of the state change of H2O and not a particular desorbing species.
At T = 157 K and 165 K (peaks ③ and ④), two responses are detected. They have several masses in common – m/z 29, 30, 31 – but also present their own specific masses. Peak ③ holds m/z 47 whereas peak ④ holds m/z 43, 45, 47, 60 and 61. For peak ④, almost all masses could be assigned to glyceraldehyde, which was already tentatively assigned in the IR spectrum, but m/z 45 and 47 could not be explained by this assignment alone. Although desorption temperatures are different, peaks ③ and ④ hold MS responses that are linked to the same kind of species: small formaldehyde polymers, so-called formaldehyde oligomers. Butscher et al.9 presented different fragmentation patterns from these formaldehyde oligomers, X–(CH2O)n–Y. The common m/z can be explained by the unit of the polymer whereas the specific masses are related to the chain ends. Moreover, the temperature desorption and the relative intensity of m/z give hints concerning the length of the oligomer: the longer the oligomer, the higher the desorption temperature and the common m/z intensities. Thus, MS responses of ③ and some MS responses of ④ are tentatively assigned to two different formaldehyde oligomers. By comparing relative intensities of the TPD responses and by observing the IR spectrum at these temperatures, we tentatively assign ③ to a formaldehyde oligomer and ④ to a mixture of a longer formaldehyde oligomer and glyceraldehyde.
By combining infrared and mass spectrometries, we clearly detect the formation of H2CO, CH3OH, O3, H2O, and tentatively glyceraldehyde HC(O)CHOHCH2OH and formaldehyde oligomers. In addition, mass spectrometry analysis confirms the assumption made during IR analysis that is the negligible formation of glyoxal while HCO was the dominant radical species before Ar desorption.
4 Theoretical results and discussion
The goal of these experiments is to study the reactivity of HC˙O in an environment where it is the only radical species. As radical coupling is a barrierless reaction, it is supposed that the main reaction channel is formation of glyoxal HC(O)C(O)H when HC˙O is released from the matrix. However, only traces of glyoxal were detected with mass spectrometry, a very sensitive method. This hints that other formyl radical reactions are dominant, in detriment of glyoxal HC(O)C(O)H formation.To understand what are the final products, formyl radical reactivity was computed using quantum chemical methods.
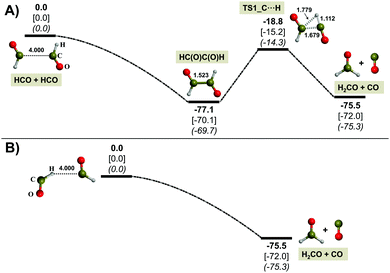
Fig. 8 displays the results for the reactivity between two HC˙O molecules. We found that two different reactions are possible: (i) C–C coupling to form glyoxal (Fig. 8A); and (ii) formation of CO + H2CO via H transfer from one HC˙O to the other (Fig. 8B). The occurrence of one reaction or the other depends on the relative orientation of the initial guess structures (i.e., before geometry optimization). When the C atoms are pointing one toward the other glyoxal is formed, whereas when the H atom of one HC˙O is pointing towards the C atom of the other HC˙O the H atom transfers forming H2CO + CO. Both cases are barrierless (and hence the absence of transition structures) since the systems collapse to the products spontaneously upon geometry optimization. Similar processes have been reported for the reactivity between HC˙O + ˙CH3.26 Moreover, in the case of glyoxal formation, we also calculated the intramolecular H transfer from one CH group to the other to form H2CO + CO (shown in Fig. 8A). Although the calculated intrinsic energy barrier is about 55 kcal mol−1, this transition state remains energetically below the HC˙O + HC˙O asymptote so we can assume that, after glyoxal formation, the system is in a high vibrational state and has enough internal energy to overcome the energy barrier to form H2CO + CO. The results also indicate that formation of glyoxal and H2CO + CO presents similar formation energies (−70.1 and −72.0 kcal mol−1, respectively). However, due to the increase of temperature during our experimental procedure formation of H2CO + CO is dominant over glyoxal due to entropic effects, as the calculated free energy values at 120 K indicate.
It has been shown in the gas phase that the dimerisation of HC˙O leads to the formation of formaldehyde and carbon monoxide while no traces of glyoxal were detected. Other experiments were performed to observe formyl radical dimerisation in the solid phase. Before this work, Fedoseev et al.27 and Chuang et al.28 identified the formation of glycolaldehyde (HC(O)CH2OH) and ethylene glycol (HOCH2CH2OH) through recombination of radicals formed via H-atom addition and abstraction reactions at different stages of the CO hydrogenation network. They suggested the formation of glyoxal from HCO dimerisation as an intermediate molecule, since its successive hydrogenation is supposed to yield glycolaldehyde and ethylene glycol but no clear detection of glyoxal was observed. This behaviour hints that the mechanism proposed in Fig. 8 could also be applied under our conditions. Studies of Fedoseev et al.27 and Chuang et al.28 are based on H bombardment of solid ices of CO, H2CO and CH3OH, whereas our experiments are based on the photolysis of H2CO in a cryogenic matrix of Ar. Although they seem to be different, all these procedures mimic the same process, namely hydrogenation of CO. In our experiment, the sample is heated up to 35 K to desorb the noble gas from our sample. This temperature also enhances the diffusion of our radicals inside the ice analogue we made, triggering radical recombination. As quantum calculations showed, formaldehyde and CO are expected to be the dominant products. One can think that due to the presence of a solid environment, energetic dissipation from HCO dimerisation should be enhanced and glyoxal could be formed. However, due to the temperature increase during rare gas desorption, the formyl radical is able to move slightly, increasing the chances of the H-abstraction mechanism. Moreover, to desorb the argon from our sample, the temperature is set to 35 K. At this temperature, CO can diffuse and even sublimate, displacing the equilibrium to the formation of formaldehyde as the two compounds are not in contact. Due to these two mechanisms – H-abstraction and shift of equilibrium due to CO desorption – the formation of glyoxal is really unlikely compared to the production of formaldehyde and CO.
Important identified side products are formaldehyde oligomers and glyceraldehyde HC(O)CH2CH2OH, tentatively assigned thanks to infrared and mass spectrometries performed on the solid film. The formation mechanism of formaldehyde oligomers is based on polymerisation reactions. Indeed, formyl radical HC˙O is able to initiate the polymerisation reaction with an unsaturated formaldehyde (H2CO),9 two abundant molecules in our experiment.
| HC˙O + H2CO → HC(O)CH2O˙ | (3) |
| HC(O)CH2O˙ + H2CO → HC(O)CH2OCH2O˙ |
| HC(O)CH2OCH2O˙ + nH2CO → HC(O)[CH2O]n+1CH2O˙ | (4) |
For glyceraldehyde, a sugar of astrophysical interest,29,30 the mechanism is quite different. The product of eqn (4) could initiate polymerisation to form POM but could also perform H-abstraction on a formyl radical HC˙O, leading to the formation of glycolaldehyde HC(O)CH2OH and CO. Glycolaldehyde, due to its carbonyl bond, can react with another HC˙O molecule to form a larger radical species. Eventually, this radical will take a H-atom from last HC˙O to produce glyceraldehyde and CO, as shown in eqn (5).
| HC(O)CH2O˙ + HC˙O → HC(O)CH2OH + CO |
| HC(O)CH2OH + HC˙O → HC(O)CHO˙CH2OH |
| HC(O)CHO˙CH2OH + HC˙O → HC(O)CHOHCH2OH + CO | (5) |
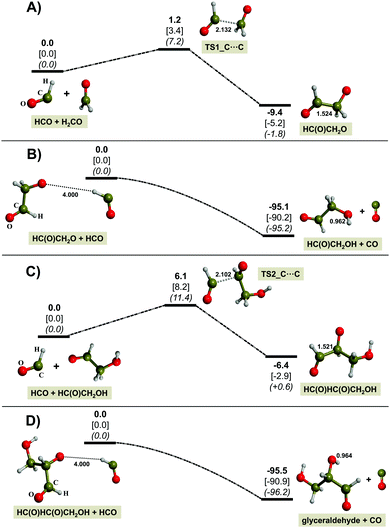
As mentioned before, the first step (Fig. 9A) involves the coupling of HC˙O with H2CO, which leads to the formation of the HC(O)CH2O˙ radical. Its formation is energetically favorable as it has a large and negative reaction energy and a very low energy barrier. The next step (Fig. 9B) involves the hydrogenation of HC(O)CH2O˙ to form HC(O)CH2OH as stable intermediate species. In this case, the source of hydrogenation is HC˙O, since a spontaneous H transfer from HC˙O to the radical O atom of HC(O)CH2O˙ takes place, which in turn yields CO as a by-product. This hydrogenation is barrierless and brings associated a very favorable reaction energy. Final formation of glyceraldehyde involves the same two steps with HC(O)CH2OH; namely, first reaction with HCO (Fig. 9C) followed by hydrogenation from another HC˙O molecule (Fig. 9D). The energetics of these two steps are quite similar to the first two steps. These results, thus, indicate that this mechanism is doable and can explain formation of glyceraldehyde in our experiments.
These assignments remain tentative and further experiments and calculations will be performed to confirm or rule out these mechanisms.
5 Conclusions
In this work, we generate the formyl radical HC˙O by using matrix isolation techniques and VUV irradiation on formaldehyde (H2CO). This irradiation was performed until the amount of precursor molecules became negligible and HC˙O the main reactant. The subsequent steps, annealing and desorption of the rare gas, lead to the formation of several fundamental species; i.e., CO, H2CO, O3, CH4, and H2O, and also some COMs derived from formaldehyde oligomers and glyceraldehyde HC(O)CHOHCH2OH. In contrast, glyoxal HC(O)C(O)H is not detected in the experiments. Quantum chemical calculations indicate that the absence of glyoxal is because, once it is formed by dimerization of HC˙O, it can undergo an intramolecular H-transfer leading to H2CO + CO, and also because the direct H-transfer from one HC˙O to the other yielding H2CO + CO is a competitive reaction channel. Thus, radical recombination in interstellar ices is not a simple mechanism. All proposed mechanisms are consistent with our experimental conditions assuming our tentative assignment of glyceraldehyde in our experiment and are summarized in Fig. 10. We also tentatively assigned one formed species in our work to glyceraldehyde. Although this characterization cannot be clearly confirmed, calculations give a consistent mechanism for glyceraldehyde formation at low temperature, which is initiated by the reaction of H2CO with HC˙O. The mechanism is based on alternative steps of the radical reaction with H-abstractions. The theoretical results also predict the reactivity of HC˙O + ˙CH2OH and ˙CH2OH + ˙CH2OH, in which radical coupling and H-transfer processes are competitive reactions.Acknowledgements
This work has been funded by the French national programme Physique Chimie du Milieu Interstellaire (PCMI), the Centre National des Etudes Spatiales (CNES), and the Provence-Alpes-Cote d Azur region (PACA). AR is indebted to Programa Banco de Satander for a UAB distinguished postdoctoral research contract. Financial support from MINECO (project CTQ2015-62635-ERC and CTQ2014-60119-P) and DIUE (project 2014SGR482) is gratefully acknowledged.References
- P. M. Woods, B. Slater, Z. Raza, S. Viti, W. A. Brown and D. J. Burke, Astrophys. J., 2013, 777, 90 CrossRef.
- J. M. Hollis, F. J. Lovas and P. R. Jewell, Astrophys. J., Lett., 2000, 540, L107 CrossRef CAS.
- J. Hollis, S. Vogel, L. Snyder, P. Jewell and F. Lovas, Astrophys. J., Lett., 2001, 554, L81 CrossRef CAS.
- J. M. Hollis, F. J. Lovas, P. R. Jewell and L. Coudert, Astrophys. J., Lett., 2002, 571, L59 CrossRef CAS.
- K. I. Öberg, R. T. Garrod, E. F. Van Dishoeck and H. Linnartz, Astron. Astrophys., 2009, 504, 891–913 CrossRef.
- T. Hama and N. Watanabe, Chem. Rev., 2013, 113, 8783–8839 CrossRef CAS PubMed.
- T. Butscher, F. Duvernay, P. Theule, G. Danger, Y. Carissan, D. Hagebaum-Reignier and T. Chiavassa, Mon. Not. R. Astron. Soc., 2015, 453, 1587–1596 CrossRef.
- C. Pirim, L. Krim, C. Laffon, P. Parent, F. Pauzat, J. Pilmé and Y. Ellinger, J. Phys. Chem. A, 2010, 114, 3320–3328 CrossRef CAS PubMed.
- T. Butscher, F. Duvernay, G. Danger and T. Chiavassa, Astron. Astrophys., 2016, 593, A60 CrossRef.
- D. E. Milligan and M. E. Jacox, J. Chem. Phys., 1969, 51, 277–288 CrossRef CAS.
- M. E. Jacox and D. E. Milligan, J. Mol. Spectrosc., 1973, 47, 148–162 CrossRef CAS.
- C. J. Bennett and R. I. Kaiser, Astrophys. J., 2007, 661, 899 CrossRef CAS.
- M. J. Frisch, G. W. Trucks, H. B. Schlegel, G. E. Scuseria, M. A. Robb, J. R. Cheeseman, G. Scalmani, V. Barone, B. Mennucci, G. A. Petersson, H. Nakatsuji, M. Caricato, X. Li, H. P. Hratchian, A. F. Izmaylov, J. Bloino, G. Zheng, J. L. Sonnenberg, M. Hada, M. Ehara, K. Toyota, R. Fukuda, J. Hasegawa, M. Ishida, T. Nakajima, Y. Honda, O. Kitao, H. Nakai, T. Vreven, J. A. Montgomery Jr, J. E. Peralta, F. Ogliaro, M. Bearpark, J. J. Heyd, E. Brothers, K. N. Kudin, V. N. Staroverov, R. Kobayashi, J. Normand, K. Raghavachari, A. Rendell, J. C. Burant, S. S. Iyengar, J. Tomasi, M. Cossi, N. Rega, J. M. Millam, M. Klene, J. E. Knox, J. B. Cross, V. Bakken, C. Adamo, J. Jaramillo, R. Gomperts, R. E. Stratmann, O. Yazyev, A. J. Austin, R. Cammi, C. Pomelli, J. W. Ochterski, R. L. Martin, K. Morokuma, V. G. Zakrzewski, G. A. Voth, P. Salvador, J. J. Dannenberg, S. Dapprich, A. D. Daniels, Ö. Farkas, J. B. Foresman, J. V. Ortiz, J. Cioslowski and D. J. Fox, Gaussian 09 Revision D.01, Gaussian Inc., Wallingford CT, 2009 Search PubMed.
- Y. Zhao and D. G. Truhlar, Theor. Chem. Acc., 2008, 120, 215–241 CrossRef CAS.
- S. Grimme, J. Antony, S. Ehrlich and H. Krieg, J. Chem. Phys., 2010, 132, 154104–154119 CrossRef PubMed.
- T. H. Dunning, J. Chem. Phys., 1989, 90, 1007–1023 CrossRef CAS.
- D. A. McQuarrie, Statical Mechanics, Harper & Row, New York, 1976 Search PubMed.
- B. Nelander, J. Chem. Phys., 1980, 73, 1026–1033 CrossRef CAS.
- B. Nelander, J. Chem. Phys., 1980, 72, 77–84 CrossRef CAS.
- J. R. Sodeau and E. K. Lee, Chem. Phys. Lett., 1978, 57, 71–74 CrossRef CAS.
- H. Kunttu, J. Seetula, M. Räsänen and V. Apkarian, J. Chem. Phys., 1992, 96, 5630–5635 CrossRef CAS.
- M. Pettersson, L. Khriachtchev, R.-J. Roozeman and M. Räsänen, Chem. Phys. Lett., 2000, 323, 506–513 CrossRef CAS.
- M. Diem and E. K. Lee, Chem. Phys., 1979, 41, 373–377 CrossRef CAS.
- H. Dubost and L. Abouaf-Marguin, Chem. Phys. Lett., 1972, 17, 269–273 CrossRef CAS.
- R. S. Smith, C. Huang, E. Wong and B. D. Kay, Phys. Rev. Lett., 1997, 79, 909 CrossRef CAS.
- J. Enrique-Romero, A. Rimola, C. Ceccarelli and N. Balucani, Mon. Not. R. Astron. Soc.: Lett., 2016, 459, L6–L10 CrossRef.
- G. Fedoseev, H. Cuppen, S. Ioppolo, T. Lamberts and H. Linnartz, Mon. Not. R. Astron. Soc., 2015, 448, 1288–1297 CrossRef CAS.
- K.-J. Chuang, G. Fedoseev, S. Ioppolo, E. van Dishoeck and H. Linnartz, Mon. Not. R. Astron. Soc., 2016, 455, 1702–1712 CrossRef.
- C. Meinert, I. Myrgorodska, P. De Marcellus, T. Buhse, L. Nahon, S. V. Hoffmann, L. L. S. d'Hendecourt and U. J. Meierhenrich, Science, 2016, 352, 208–212 CrossRef CAS PubMed.
- P. de Marcellus, C. Meinert, I. Myrgorodska, L. Nahon, T. Buhse, L. L. S. d'Hendecourt and U. J. Meierhenrich, Proc. Natl. Acad. Sci. U. S. A., 2015, 112, 965–970 CrossRef CAS PubMed.
| This journal is © the Owner Societies 2017 |

