
 Open Access Article
 This Open Access Article is licensed under a Creative Commons Attribution-Non Commercial 3.0 Unported Licence
Growth and structure of ultrathin praseodymium oxide layers on ruthenium(0001)
Jan
Höcker
a,
Jon-Olaf
Krisponeit
ab,
Julian
Cambeis
a,
Alexei
Zakharov
c,
Yuran
Niu
c,
Gang
Wei
 d,
Lucio
Colombi Ciacchi
bd,
Jens
Falta
ab,
Andreas
Schaefer
e and
Jan Ingo
Flege
*ab
d,
Lucio
Colombi Ciacchi
bd,
Jens
Falta
ab,
Andreas
Schaefer
e and
Jan Ingo
Flege
*ab
aInstitute of Solid State Physics, University of Bremen, Otto-Hahn-Allee 1, D-28359 Bremen, Germany. E-mail: flege@ifp.uni-bremen.de
bMAPEX Institute for Materials and Processes, University of Bremen, D-28359 Bremen, Germany
cMAX IV Laboratory, Box 118, 221 00 Lund, Sweden
dBremen Center for Computational Materials Science, Am Fallturm 1, D-28359 Bremen, Germany
eDivision of Synchrotron Radiation Research, Lund University, 221 00 Lund, Sweden
First published on 2nd November 2016
Abstract
The growth, morphology, structure, and stoichiometry of ultrathin praseodymium oxide layers on Ru(0001) were studied using low-energy electron microscopy and diffraction, photoemission electron microscopy, atomic force microscopy, and X-ray photoelectron spectroscopy. At a growth temperature of 760 °C, the oxide is shown to form hexagonally close-packed (A-type) Pr2O3(0001) islands that are up to 3 nm high. Depending on the local substrate step density, the islands either adopt a triangular shape on sufficiently large terraces or acquire a trapezoidal shape with the long base aligned along the substrate steps.
Introduction
The current and upcoming challenges connected with climate change, sustainable and clean energy production and limited natural resources drive the search for new technologies and materials systems. New routes in catalytic chemical reactions, energy conversion and storage are necessary. Cerium oxide has become one of the most important rare earth oxides (REOs) and is employed in the chemical industry since several decades as an essential component of the automotive catalytic converter because of its oxygen storage capacity.1 Past and ongoing research on cerium oxide has brought to light its potential for a plethora of other applications as, e.g., fuel cells, oxidation and partial hydrogenation of organic compounds, but also photocatalysis and water splitting.2 Tuning ceria catalysts by mixing with other oxides and doping with transition metals has recently been reported for reactions like the water–gas shift or dry and steam reforming reactions, respectively.3–6 Ceria has also been intensely investigated employing surface science methodology for the study of fundamental structural and chemical properties.7,8 However, when it comes to the study of other oxides of the lanthanide series especially systematic surface science studies are scarce.As one of the only three oxides in the lanthanide series that can form a dioxide, the oxide of cerium's direct neighbor, praseodymium, is a not less fascinating material. Praseodymia has been investigated in catalytic reactions as, e.g., the oxidative coupling of methane, NO reduction, or CO oxidation.9–11 Also, Pr ions are used as a dopant to enhance the oxygen mobility of ceria.12 Praseodymium oxide appears in stoichiometries ranging from the dioxide PrO2 to the sesquioxide Pr2O3. In between these limits many substoichiometric phases exist, among them the most stable phase under ambient conditions, Pr6O11, in which the Pr ions exist in +3 and +4 oxidation states. The preferential stoichiometry found under conditions near ultra-high vacuum (UHV) is Pr2O3,13,14 which crystallizes in the hexagonal closed packed (A-type) structure (P![[3 with combining macron]](https://www.rsc.org/images/entities/char_0033_0304.gif) 2/m1) with lattice constants of a = 0.3857 nm, c = 0.6016 nm, or the cubic bixbyite structure (Ia) with a lattice constant of 1.1152 nm.15 The dioxide PrO2 adopts the cubic fluorite structure (Fmm) (a = 0.5393 nm),16,17 which is also present for substoichiometric PrO2−x phases.
2/m1) with lattice constants of a = 0.3857 nm, c = 0.6016 nm, or the cubic bixbyite structure (Ia) with a lattice constant of 1.1152 nm.15 The dioxide PrO2 adopts the cubic fluorite structure (Fmm) (a = 0.5393 nm),16,17 which is also present for substoichiometric PrO2−x phases.
The study of thin films of praseodymia has so far been limited to films on silicon substrates grown by physical vapor deposition (PVD) or chemical vapor deposition (CVD), mostly in the context of microelectronic applications.14,18 To the best of our knowledge, only one study exists on praseodymia films grown on a Ru(0001) metal substrate, focusing on CO and C2H4 adsorption on Rh loaded films.19 However, in that particular study the praseodymia film was not crystalline and did not exhibit a diffraction pattern, rendering an atomistic interpretation of the role of the oxide virtually impossible. Furthermore, we are not aware of any investigation focusing on the growth and structure of praseodymia on a metal substrate, which we, in analogy to the ceria–transition-metal inverse catalytic system, believe to be of considerable importance for studying the complex redox chemistry of praseodymium oxide in isolation as well as its interplay with catalytically active transition metals. Consequently, the aim of our work is the detailed study of praseodymia growth on a Ru(0001) single crystal to prepare well ordered oxide nanostructures in the spirit of an inverse model system20–22 for studies of catalytic processes. We will show that, at growth temperatures of 760 °C, praseodymia grows as islands of few nanometer thickness adopting the hexagonal lattice structure, exposing the Pr2O3(0001) surface. This finding is in contrast to the related ceria/Ru(0001) system, for which, at similar conditions, the growth of triangular CeO2(111) islands is observed.23,24 Nevertheless, this hexagonal praseodymia structure is essential for bridging the materials gap to catalytic studies employing powder catalysts that, at temperatures exceeding 600 °C, have identified a phase transition to A-type Pr2O3.11
Experimental details
The growth and characterization experiments were carried out in identical fashion in three different UHV chambers. The growth was investigated in situ in a commercial Elmitec LEEM III microscope (Elmitec, Clausthal-Zellerfeld, Germany) installed at the University of Bremen employing LEEM and micro-illumination low-energy electron diffraction (μLEED). For chemical characterization, X-ray photoelectron spectroscopy (XPS) measurements were performed in a second UHV chamber at the University of Bremen equipped with an Omicron DAR 400 X-ray gun and an Omicron EA 125 hemispherical energy analyzer. Furthermore, X-ray absorption spectroscopy (XAS) data, μLEED patterns, and dark-field LEEM images were acquired in an Elmitec spectroscopic photoemission and low energy electron microscope (SPELEEM III) at beamline I311 at the MAX-lab synchrotron radiation facility in Lund, Sweden, allowing the direct correlation between structural and chemical data. Beamline I311 is equipped with a modified SX700 monochromator, which provides light in the energy range from 43 to 1500 eV. The photon energy experimental resolution was better than 80 meV at the photon energies employed in this study; the photoelectrons were recorded in normal incidence – normal emission geometry. In the XAS measurements, special attention was paid to minimize the effect of photon beam damage to avoid possible changes in the oxidation state of praseodymia due to prolonged exposure to the photon beam. In all setups the base pressure was at 1 × 10⁻¹⁰ Torr, samples were e-beam heated, and temperatures were read using standard W–Re thermocouples fixed to the sample support in close proximity to the sample. Ex situ atomic force microscopy (AFM) images were recorded in contact mode with a NanoWizard 3 NanoScience atomic force microscope from JPK Instruments. Images were analyzed and processed using the open source software packages Gxsm2, Gwyddion, ImageJ and Vesta.25–28Prior to the praseodymia growth the polished Ru(0001) single crystal (Mateck, miscut less than 0.1°) was cleaned in each chamber by several cycles of oxidation at 250 °C in 2 × 10⁻⁷ Torr oxygen ambient and subsequent flash-annealing to 1600 °C.29,30 The cleanliness of the surface was checked by XPS, LEEM, and LEED.
Praseodymia was grown by reactive molecular beam epitaxy at a sample temperature of 760 °C as follows: at the growth temperature, oxygen was leaked in at a partial pressure of 5 × 10⁻⁷ Torr. The surface was then equilibrated for several minutes, leading to an oxygen adlayer.31 Then, at the same O2 partial pressure, Pr was deposited from a home-built evaporator employing e-beam heating of a molybdenum crucible filled with Pr metal (ChemPur, purity 99.9%). A praseodymia growth rate of 0.2 nm min−1 was determined by subsequent AFM measurements. After the deposition, the sample was kept at the growth temperature for an additional 60 s and then cooled down to room temperature in oxygen backfilling for further characterization. Based on XPS, XAS as well as intensity–voltage (I(V)) LEEM characterization no evidence for any form of alloying between Pr and the Ru support was found.
Results
The presentation of the results is organized in subsections dealing first with the growth observed by LEEM and the morphology of the praseodymia on Ru(0001) as measured by AFM. Subsequently the chemical composition of the sample is characterized by X-ray photoelectron spectroscopy and local X-ray absorption spectroscopy (μXAS). Finally the crystal structure of the grown praseodymia will be inferred combining the results from the preceding subsections and results from low-energy electron diffraction (LEED) measurements.Praseodymia growth and morphology
As observed by LEEM the clean Ru(0001) surface is composed of areas with up to 3 μm large terraces, which are separated by atomic steps (thin dark lines) or step bunches (broad dark lines) as shown in Fig. 1a, and of areas with much higher atomic step densities and narrower terrace widths of only few hundreds of nanometers (not shown). As soon as Pr deposition in O2 background starts, praseodymia nucleates at either side of the Ru step edges and forms small islands (Fig. 1b). These straight-shaped islands grow along the Ru step edges exhibiting regular shapes with 60° or 120° corners (cf.Fig. 1c). As depicted in Fig. 1d, during the ongoing deposition a darker phase nucleates preferentially at the position of the underlying Ru step edges where also the brighter phase had nucleated previously. The second phase forms small triangles (Fig. 1e), which appear inverted compared to the orientation of the triangle-like islands of the bright praseodymia layer. The darker phase is tentatively assigned to a second praseodymia layer exhibiting a thickness contrast in LEEM and thus appearing darker than the underlying first praseodymia layer.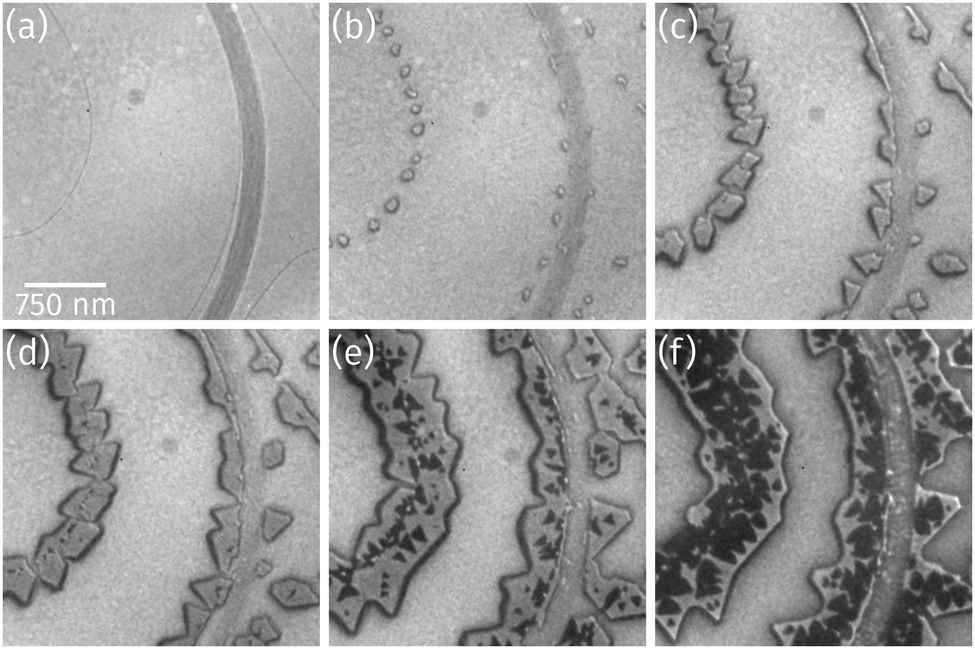 | ||
| Fig. 1 LEEM time-lapse sequence (electron energy: 17.0 eV) acquired during Pr deposition in 5 × 10⁻⁷ Torr O2 background on Ru(0001) at 760 °C sample temperature: (a) clean Ru(0001) surface, after (b) 9 s, (c) 59 s, (d) 75 s, (e) 160 s, and (f) 250 s of deposition. | ||
Further Pr deposition leads to a continuous growth of the first as well as the second layer, yet the second layer is growing faster, finally covering large parts of the first layer (cf.Fig. 1f), indicative of a competition between layer-by-layer growth and a three-dimensional growth mode.
Closer inspection of a different sample with a higher coverage (Fig. 2a) reveals the presence of a bright praseodymia phase along the original position of the Ru step edge (cf.Fig. 1a and b). Apparently the substrate steps exert a high influence on the praseodymia growth because they serve as nucleation centers for each additional praseodymia layer. This becomes even more obvious in regions with lots of steps on the substrate as imaged in Fig. 2b: almost the complete substrate surface is covered by praseodymia probably due to the high nucleation density caused by the high step density of the Ru substrate. Moreover, in contrast to the large terrace area in Fig. 2a where the bright phase is only observable in the center of the praseodymia islands, in the highly stepped area this phase forms truncated triangular (trapezoidal) islands as the islands continue to grow only parallel to the steps without crossing them. Hence, at this point we may already conclude that the growth behavior for praseodymia on Ru(0001) is different from the related system CeO2/Ru(0001), for which a carpet-like growth mode and a more two-dimensional row-by-row growth have been observed previously.32,33 In the carpet mode, the ceria islands overgrow single to few-layer atomic steps and smoothen the corrugation of the substrate such that its influence on sequential ceria growth is reduced considerably, thereby inducing a pronounced three-dimensional mode. In the present case, however, as the praseodymia is seen to nucleate on both sides of the atomic Ru steps, even at the later stages of growth the influence of the substrate is largely preserved, reflecting a mixed two/three-dimensional mode.
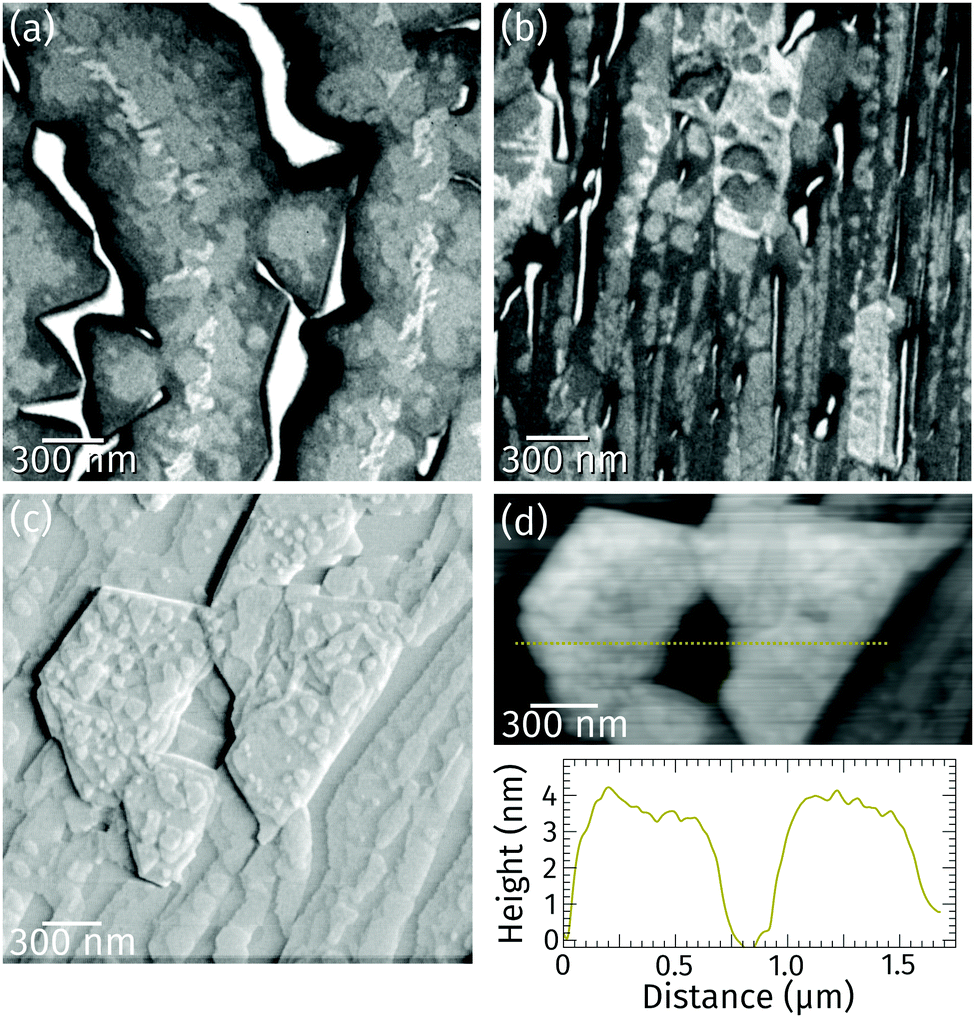 | ||
| Fig. 2 LEEM images of praseodymia grown at 760 °C on Ru(0001) of areas with (a) large terraces recorded at 5.7 eV and (b) higher step density recorded at 5.6 eV. (c) Ex situ vertical deflection AFM image of an area similar to (b). (d) Height image of an area in (c) and corresponding height profile along the highlighted path. | ||
Ex situ atomic force microscopy of a stepped area reveals that the trapezoidal islands are 3 nm to 4 nm high (cf. line profile in Fig. 2d). The top facets of these islands are not smooth (cf.Fig. 2c) but covered by various steps about 0.3 or 0.6 nm high. These values correspond to the height of half a unit cell and one unit cell in hexagonal Pr2O3(0001), or, in the cubic polymorphs, one to two trilayer-like (O–Pr–O) layers of Pr2O3(111) and PrO2(111), respectively. Moreover, the side facets of the trapezoidal islands are found to be quite steep, whereas their top facets are rougher than the substrate.
Local praseodymia stoichiometry
The stoichiometry of the praseodymia films grown at 760 °C on Ru(0001) was probed by in situ XPS and μXAS.The Pr 3d core level spectrum shown in Fig. 3a obtained by integral XPS measurements using a standard laboratory source exhibits the characteristic Pr 3d3/2 and Pr 3d5/2 splitting in four peaks caused by initial and final state effects, which is typical for a stoichiometry of Pr2O3 and well known from literature.13,34 This implies that the vast majority of the praseodymia islands on the Ru(0001) surface consists of Pr2O3; however, local variances of the oxidation state below the detection limit of standard lab XPS might still be possible. Therefore, local X-ray absorption spectroscopy at the Pr NIV,V-edge was applied. Fig. 3b shows an XPEEM image of the surface area corresponding to Fig. 2a at 143 eV photon energy, which essentially yields three levels of intensity within the praseodymia islands: bright central parts surrounded by the homogeneous but less intense island bodies, and finally quite narrow edges with less than half of the intensity of the center regions. Because the local X-ray absorption intensity is in the first place depending on the local amount of absorbing material (Pr), the local brightness may be taken as a measure of the local film thickness. Hence, the latter observation of darker island edges fits well to the previous interpretation of the LEEM and AFM data in Fig. 2, corroborating the presence of thicker island centers and narrow, thin edges. Furthermore, the shape of the local absorption spectra of the center and body regions coincide except for a simple scaling factor of 1.6, whereas the shape of the spectrum of the edge region shows small deviations at the maximum at around 124 eV as well as on the high energy side. From the identical spectra it can be concluded that the praseodymium in the central and body parts is in an identical chemical environment, i.e., Pr3+ oxidation state. This finding is in very good agreement with earlier studies targeting praseodymia growth on silicon surfaces,14 indicating that conversion from Pr3+ to Pr4+ may only be reached by extended oxygen plasma treatment.13 It can also be assumed that differences at the island edges are related to their low thickness, which may lead to small electronic changes, like charge transfer from the substrate, that may become observable only at the thin edges.
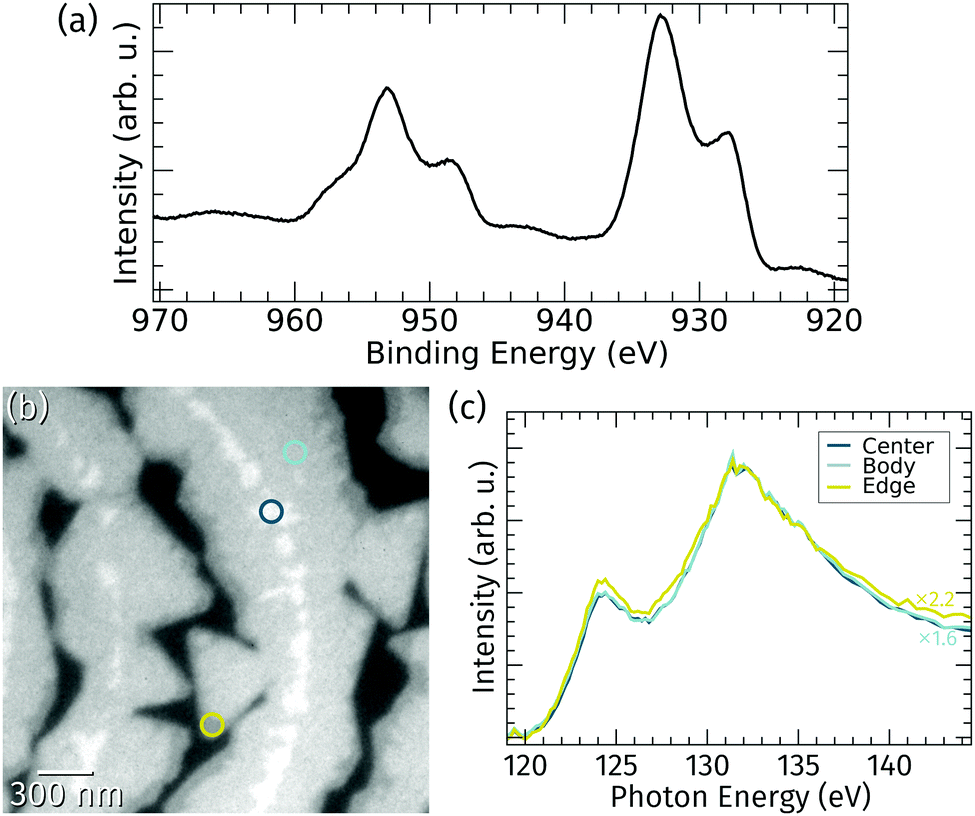 | ||
| Fig. 3 (a) X-ray photoemission spectrum of the Pr 3d core-level after praseodymia growth on Ru(0001). (b) XAS-PEEM image of the surface area corresponding to Fig. 2a recorded at 143 eV photon energy. (c) Local X-ray absorption spectra at the Pr NIV,V-edge gathered from the three spots highlighted in (b) representing the different observable intensity levels (scaled and normalized at 132 eV). | ||
Structural investigation
Based on the conclusion from the XPS and XAS data in Fig. 3a and c that the stoichiometry of the oxide is Pr2O3, there are only three alternatives for the structure of the praseodymium oxide film: (i) the cubic fluorite structure with randomly distributed oxygen vacancies, (ii) the cubic bixbyite structure, and (iii) the hexagonal close-packed structure. To determine the structure and the orientation of the islands' top facet, LEED images were recorded from the surface as shown in Fig. 4a. The hexagonal pattern with three rotational domains yields a (1.4 × 1.4) superstructure with respect to the Ru(0001) surface mesh, thus indicating either a cubic fluorite Pr2O3(111) or a hex-Pr2O3(0001) lattice. A (111) oriented cubic bixbyite lattice can be ruled out due to its about 16 times larger surface unit mesh than hex-Pr2O3(0001), which would lead to the presence of additional superstructure spots. While we cannot distinguish between the cases (i) and (iii) due to the very similar size and geometry of the unit mesh, we note that a fluorite-like structure with randomly distributed O vacancies has been brought forward for TbO1.5+δ.35,36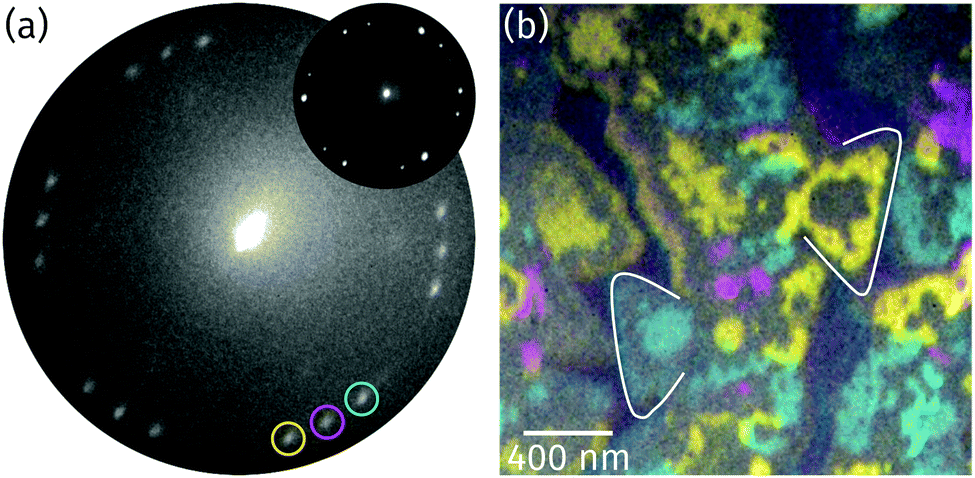 | ||
| Fig. 4 (a) LEED image recorded from the surface at 22.3 eV electron energy (illuminated area: 5 μm). The reflection marked by a magenta circle is aligned to the main axes of the Ru substrate (Ru reflections not visible due to the too low electron energy). The inset presents a μLEED pattern recorded from a single praseodymia island at 28.0 eV (illuminated area: 250 nm). (b) Color-coded composite LEEM image obtained by superimposing single colored dark-field images recorded by the three reflections highlighted by similar colors as in (a). To guide the eye and simplify the comparison with the respective bright-field image (Fig. 2a), two triangular islands are marked. | ||
The two domains observed in the LEED pattern in Fig. 4a are rotated by ±(11.5 ± 0.5)° with respect to the middle reflections (as highlighted by a magenta circle), which stem from praseodymia that is aligned to the main axis of the Ru substrate. In order to determine the spatial distribution of the rotated islands, dark field imaging was applied.37Fig. 4b shows the superposition of the single dark field images where the intensity gained by each of the highlighted reflections in Fig. 4a is color coded corresponding to the color of the circle. As can be seen in Fig. 4b, the rotated grains form large domains within the praseodymia islands. Interestingly these are interrupted by areas that appear gray in Fig. 4b but are covered by praseodymia, as can be concluded by comparing with the XPEEM image in Fig. 3b. It is also interesting that the gray areas often separate single colored praseodymia island edges from the body, which has the same color as the edges, and that the gray areas correspond to areas which were identified as layers of similar height in Fig. 2. Thus the praseodymia covering the gray areas does not scatter in one of the three highlighted reflections. Hence, the sixfold LEED pattern in Fig. 4a has to be interpreted as a superposition of two subsets of threefold symmetry each showing groups of three reflections of rotational domains. Utilizing μLEED from a single praseodymia island (see inset in Fig. 4a) readily verifies the threefold symmetry of the LEED pattern. This necessary condition is fulfilled by both candidate praseodymia structures – the (111) oriented cubic fluorite and the (0001) oriented hexagonal close-packed structures. Assuming that the colored and gray areas correspond to different film thicknesses, it follows that terraces of different height must exhibit an inversion (change) of the unit mesh, explaining the strongly reduced diffraction from the gray areas into the reflections encircled in Fig. 4a.
The identification of an alternating unit mesh for adjacent praseodymia terraces is key to determine its crystallographic structure. From the model in Fig. 5 it is obvious that the hex-Pr2O3(0001) unit mesh experiences an inversion after a step of half a unit cell height c/2, which corresponds to a step height of 0.3 nm as measured by AFM. In principle, a step height of 0.3 nm would also be compatible with the cubic fluorite structure in (111) orientation, which is constructed by O–Pr–O trilayers of 0.3 nm height, but this structure yields no unit mesh inversion after a monolayer step. Thus the structure can be determined to hex-Pr2O3(0001), where single praseodymia terraces are separated by steps of c/2 or odd multiples which yield the observed color–gray-color-sequence in Fig. 4b.
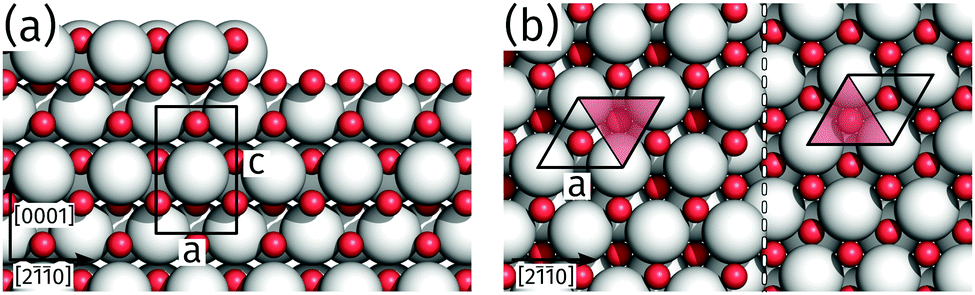 | ||
| Fig. 5 Structure model of hex-Pr2O3(0001) with a step of about c/2. Pr atoms are represented by white spheres, oxygen atoms by red spheres. (a) Side view. The black rectangle illustrates the hex-Pr2O3 unit cell with its lattice constants a and c. (b) Top view. The step edge is indicated by a dashed line, the surface unit mesh (lattice constant a) by a parallelogram. The A/B stacking of the Pr cations is indicated by the open and filled half-spaces of the unit mesh, which appear to be inverted after a step of 0.3 nm. | ||
Finally, we address the influence of the substrate lattice on the growth of the praseodymia film. As illustrated in the qualitative model in Fig. 6, the observed rotation of ±(11.5 ± 0.5)° actually fits very well to a matching registry between the Ru substrate and the hex-Pr2O3(0001) lattice under a rotation of ±11.7° extending over (9 × 9) Pr2O3(0001) lattice constants yielding a  superstructure. In this configuration, the Pr2O3(0001) is compressively strained by less than 0.6%, which suggests it to be energetically favorable. Note that a rotation of ±5.8° with respect to the Ru(0001) main axes results in a second favorable superstructure of
  with an even smaller compressive strain of 0.2%. Indeed, along with the ±11.7° domains, also such rotational domains have been observed in another preparation (not shown).
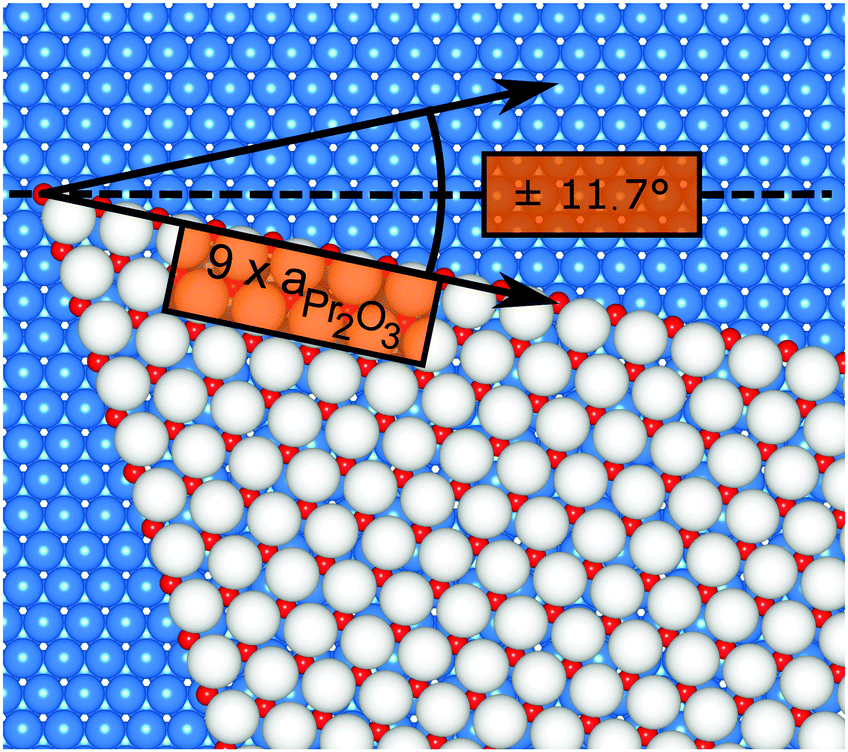 | ||
| Fig. 6 Qualitative model of a praseodymia island rotated by 11.7° on the Ru(0001) surface. The colors of the Pr and O atoms are chosen as in Fig. 5. Ru atoms are depicted as blue spheres. The registry of the Ru(0001) and the Pr2O3(0001) unit mesh is highlighted by black arrows. | ||
Whereas the rotated praseodymia domains are large, triangular, and seem to nucleate preferentially (cf.Fig. 4b), such off-axis domains are not observed for ceria on Ru(0001) at growth temperatures beyond 850 °C on single crystals23 and very smooth Ru(0001) thin films,33 suggesting these off-axis domains to be energetically less favorable than the aligned counterparts. However, on Pt(111) the CeO2(111) domains exhibit off-axis rotations of about 5° when grown on large terraces, i.e., in step-free areas, which coincides with the formation of a coincidence lattice at the interface.38 Together with the present case of preferential off-axis alignment for Pr2O3(0001), these findings clearly illustrate the delicate thermodynamic balance that needs to be struck during REO growth between the surface free energies for the various possible crystallographic REO polymorphs in isolation and their individual strain energies. The former are mainly governed by the oxygen chemical potential, the latter are apparently minimized by establishing a well-defined registry with the underlying support for essentially bulk-like lattice parameters in the REO film.
Conclusion
We have presented the first structural study targeting the growth, morphology, and crystal structure of thin praseodymium oxide films deposited on the Ru(0001) surface. At a growth temperature of 760 °C LEEM imaging showed heterogeneous nucleation of the individual praseodymia layers at the step edges of the substrate. Under the conditions employed, the growth follows a Stranski–Krastanov-like mode and yields up to 3 nm high praseodymia islands as measured by AFM at the original nucleation sites. The oxidation state was determined to Pr3+ by integral XPS as well as by local XAS, corresponding to a stoichiometry of Pr2O3. The LEED patterns obtained from the praseodymia islands showed a hexagonal unit mesh with periodicity of (1.4 × 1.4) related to the Ru substrate as well as by ±(11.5 ± 0.5)° rotated domains. Combining the results from XPS, AFM, and darkfield LEEM imaging the structure of the praseodymia film could be determined to be hexagonal close-packed Pr2O3(0001), which also enabled an explanation of the rotated domains by the formation of a coincidence lattice at low residual compressive praseodymia strain. The presented results pave the road for further in depth studies of A-type praseodymia in an inverse model catalyst architecture.Acknowledgements
This research has been supported by the Institutional Strategy of the University of Bremen, funded by the German Excellence Initiative. Furthermore, support from MAX-lab staff is kindly acknowledged.References
- Catalysis by Ceria and Related Materials, ed. P. F. Alessandro Trovarelli, Imperial College Press, 2nd edn, 2013 Search PubMed.
- T. Montini, M. Melchionna, M. Monai and P. Fornasiero, Chem. Rev., 2016, 116, 5987–6041 CrossRef CAS PubMed.
- J. Graciani and J. F. Sanz, Catal. Today, 2015, 240(part B), 214–219 CrossRef CAS.
- Z. Liu, S. D. Senanayake and J. A. Rodriguez, Appl. Catal., B, 2016, 197, 184–197 CrossRef CAS.
- Z. Liu, D. C. Grinter, P. G. Lustemberg, T.-D. Nguyen-Phan, Y. Zhou, S. Luo, I. Waluyo, E. J. Crumlin, D. J. Stacchiola, J. Zhou, J. Carrasco, H. F. Busnengo, M. V. Ganduglia-Pirovano, S. D. Senanayake and J. A. Rodriguez, Angew. Chem., Int. Ed., 2016, 55, 7455–7459 CrossRef CAS PubMed.
- Z. Liu, T. Duchon, H. Wang, D. C. Grinter, I. Waluyo, J. Zhou, Q. Liu, B. Jeong, E. J. Crumlin, V. Matolin, D. J. Stacchiola, J. A. Rodriguez and S. D. Senanayake, Phys. Chem. Chem. Phys., 2016, 18, 16621–16628 RSC.
- D. R. Mullins, Surf. Sci. Rep., 2015, 70, 42–85 CrossRef CAS.
- P. Luches and S. Valeri, Materials, 2015, 8, 5278 CrossRef.
- M. G. Poirier, R. Breault, S. Kaliaguine and A. Adnot, Appl. Catal., 1991, 71, 103–122 CrossRef CAS.
- Y. Takasu, M. Matsui and Y. Matsuda, J. Catal., 1982, 76, 61–64 CrossRef CAS.
- P. Sonström, J. Birkenstock, Y. Borchert, L. Schilinsky, P. Behrend, K. Gries, K. Müller, A. Rosenauer and M. Bäumer, ChemCatChem, 2010, 2, 694–704 CrossRef.
- A. Logan and M. Shelef, J. Mater. Res., 1994, 9, 468–475 CrossRef CAS.
- A. Schaefer, S. Gevers, V. Zielasek, T. Schroeder, J. Falta, J. Wollschläger and M. Bäumer, J. Chem. Phys., 2011, 134, 054701 CrossRef CAS PubMed.
- G. Niu, M. H. Zoellner, T. Schroeder, A. Schaefer, J.-H. Jhang, V. Zielasek, M. Baumer, H. Wilkens, J. Wollschlager, R. Olbrich, C. Lammers and M. Reichling, Phys. Chem. Chem. Phys., 2015, 17, 24513–24540 RSC.
- G. Adachi and N. Imanaka, Chem. Rev., 1998, 98, 1479–1514 CrossRef CAS.
- L. Eyring and N. C. Baenziger, J. Appl. Phys., 1962, 33, 428–433 CrossRef CAS.
- C. H. Gardiner, A. T. Boothroyd, P. Pattison, M. J. McKelvy, G. J. McIntyre and S. J. S. Lister, Phys. Rev. B: Condens. Matter Mater. Phys., 2004, 70, 024415 CrossRef.
- R. Lo Nigro, G. Malandrino, R. Toro and I. Fragalà, Chem. Vap. Deposition, 2006, 12, 109–124 CrossRef CAS.
- D. Mullins, Surf. Sci., 2004, 556, 159–170 CrossRef CAS.
- M. Sock, S. Surnev, M. Ramsey and F. Netzer, Top. Catal., 2000, 14, 15–23 CrossRef CAS.
- F. P. Leisenberger, S. Surnev, G. Koller, M. G. Ramsey and F. P. Netzer, Surf. Sci., 2000, 444, 211–220 CrossRef CAS.
- J. A. Rodriguez, P. Liu, J. Graciani, S. D. Senanayake, D. C. Grinter, D. Stacchiola, J. Hrbek and J. Fernández-Sanz, J. Phys. Chem. Lett., 2016, 7, 2627–2639 CrossRef CAS PubMed.
- B. Kaemena, S. D. Senanayake, A. Meyer, J. T. Sadowski, J. Falta and J. I. Flege, J. Phys. Chem. C, 2013, 117, 221–232 CAS.
- T. Hasegawa, S. M. F. Shahed, Y. Sainoo, A. Beniya, N. Isomura, Y. Watanabe and T. Komeda, J. Chem. Phys., 2014, 140, 044711 CrossRef PubMed.
- P. Zahl, T. Wagner, R. Möller and A. Klust, J. Vac. Sci. Technol., B, 2010, 28, C4E39–C4E47 CAS.
- D. Nečas and P. Klapetek, Cent. Eur. J. Phys., 2012, 10, 181–188 Search PubMed.
- C. A. Schneider, W. S. Rasband and K. W. Eliceiri, Nat. Methods, 2012, 9, 671–675 CrossRef CAS PubMed.
- K. Momma and F. Izumi, J. Appl. Crystallogr., 2011, 44, 1272–1276 CrossRef CAS.
- T. E. Madey, H. A. Engelhardt and D. Menzel, Surf. Sci., 1975, 48, 304–328 CrossRef CAS.
- J. I. Flege, J. Hrbek and P. Sutter, Phys. Rev. B: Condens. Matter Mater. Phys., 2008, 78, 165407 CrossRef.
- E. E. Krasovskii, J. Höcker, J. Falta and J. I. Flege, J. Phys.: Condens. Matter, 2015, 27, 035501 CrossRef CAS PubMed.
- J. I. Flege, B. Kaemena, S. D. Senanayake, J. Höcker, J. T. Sadowski and J. Falta, Ultramicroscopy, 2013, 130, 87–93 CrossRef CAS PubMed.
- M. Sauerbrey, J. Höcker, M. Wellbrock, M. Schowalter, J.-O. Krisponeit, K. Müller-Caspary, A. Rosenauer, G. Wei, L. Colombi Ciacchi, J. Falta and J. I. Flege, Cryst. Growth Des., 2016, 16, 4216–4224 CAS.
- S. Gevers, J. I. Flege, B. Kaemena, D. Bruns, T. Weisemoeller, J. Falta and J. Wollschläger, Appl. Phys. Lett., 2010, 97, 242901 CrossRef.
- W. Cartas, R. Rai, A. Sathe, A. Schaefer and J. F. Weaver, J. Phys. Chem. C, 2014, 118, 20916–20926 CAS.
- J. Höcker, W. Cartas, A. Schaefer, M. Bäumer, J. F. Weaver, J. Falta and J. I. Flege, J. Phys. Chem. C, 2015, 119, 14175–14184 Search PubMed.
- J. I. Flege, W. X. Tang and M. S. Altman, in Low-Energy Electron Microscopy, ed. E. N. Kaufmann, John Wiley & Sons, Inc., 2012 Search PubMed.
- M. Sauerbrey, G. Gasperi, P. Luches, J. Falta, S. Valeri and J. I. Flege, Top. Catal., 2016 DOI:10.1007/s11244-016-0716-6.
| This journal is © the Owner Societies 2017 |