 Open Access Article
Creative Commons Attribution 3.0 Unported Licence
Stabilization of carbocations CH3+, C2H5+, i-C3H7+, tert-Bu+, and cyclo-pentyl+ in solid phases: experimental data versus calculations†
Evgenii S.
Stoyanov
 *ab and
Anton S.
Nizovtsev
 bc
bc
aVorozhtsov Institute of Organic Chemistry, Siberian Branch of Russian Academy of Sciences, Novosibirsk 630090, Russia. E-mail: evgenii@nioch.nsc.ru
bDepartment of Natural Sciences, National Research University, Novosibirsk State University, Novosibirsk 630090, Russia
cNikolaev Institute of Inorganic Chemistry, Siberian Branch of Russian Academy of Sciences, Novosibirsk 630090, Russia
First published on 13th February 2017
Abstract
Comparison of experimental infrared (IR) spectra of the simplest carbocations (with the weakest carborane counterions in terms of basicity, CHB11Hal11−, Hal = F, Cl) with their calculated IR spectra revealed that they are completely inconsistent, as previously reported for the t-Bu+ cation [Stoyanov E. S., et al. J. Phys. Chem. A, 2015, 119, 8619]. This means that the generally accepted explanation of hyperconjugative stabilization of the carbocations should be revised. According to the theory, one CH bond (denoted as  ) from each CH3/CH2 group transfers its σ-electron density to the empty 2pz orbital of the sp2 C atom, whereas the σ-electron density on the other CH bonds of the CH3/CH2 group slightly increases. From experimental IR spectra it follows that donation of the σ-electrons from the
  bond to the 2pz C-orbital is accompanied by equal withdrawal of the electron density from other CH bonds, that is, the electrons are supplied from each CH bond of the CH3/CH2 group. As a result, all CH stretches of the group are red shifted, and IR spectra show typical CH3/CH2 group vibrations. Experimental findings provided another clue to the electron distribution in the hydrocarbon cations and showed that the standard computational techniques do not allow researchers to explain a number of recently established features of the molecular state of hydrocarbon cations.
Introduction
The research on carbocation stabilization is one of the most important trends in carbocation chemistry. Experimental studies mainly deal with gas phase infrared (IR) mass spectroscopy,1–4 IR and NMR characterization in superacidic media,5–12 and X-ray structural analysis.13–17 As shown by ab initio calculations, the isolated carbocations are stabilized due to the intramolecular charge distribution under the influence of hyperconjugation1,18–22 and polarization.23 The simplest carbocation, CH3+, is subject to only the polarization effect.23 For the gaseous C2H5+ cation, the theory predicts and experiments confirm that the hyperconjugative interaction between the CH3 group and the empty 2pz orbital in the carbon atom of the CH2 group is so strong that a bridged-proton symmetrical structure is formed.3 The isolated i-propyl (i-Pr+) cation has been the subject of extensive ab initio calculations.24–27 In its lowest-energy C2 conformer, two C–H bonds are aligned with the up and down lobes of the 2pz orbital of the sp2 C-atom, suggesting that these C–H bonds are involved in strong hyperconjugation.Most attention has been given to the tert-butyl cation, whose hyperconjugative delocalization of the positive charge has been used as a textbook explanation of its stability. As predicted by quantum chemical calculations, the most energetically stable t-Bu+ cation (Cs symmetry) has three CH bonds, one from each CH3 group, which are aligned in parallel with the empty 2pz orbital of the central sp2 carbon atom.1,18–20 This situation makes donation of its σ-electron density to this orbital possible, resulting in σ-pz hyperconjugation (Scheme 1). These three C–H bonds (one of them is marked with  in Scheme 1) are weakened and their νCH frequencies are significantly decreased, whereas the remaining C–H bonds (CH′ and CH′′ in Scheme 1) are slightly strengthened and their νCH increases.
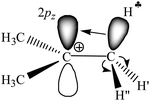 | ||
| Scheme 1 Schematic representation of the electron density redistribution in accordance with the classical understanding of the mechanism of hyperconjugation stabilization in t-Bu+. | ||
Thus, ab initio calculations predict a coherent picture of the mechanism underlying positive charge dispersion in the naked cations C2H5+, (CH3)2CH+ (i-Pr+), and (CH3)3C+ (t-Bu+) primarily via the hyperconjugative effect. It is clear that the polarization effect must play an important role in cation stabilization although convincing data based on calculations are actually absent.
Our recent experimental study of the t-Bu+ cation in condensed phases, together with interpreted IR spectra of gaseous t-Bu+, showed28 that empirical findings contradict the generally accepted hyperconjugation mechanism (Scheme 1). It follows from the experiments that all C–H bonds of the two CH3 groups of t-Bu+ donate σ-electrons to the carbon's 2pz orbital (Scheme 2), and the third CH3 group is mostly affected by polarization.
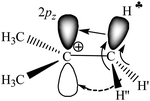 | ||
| Scheme 2 Schematic representation of electron density redistribution in t-Bu+ according to empirical data.28 | ||
It should be noted that in condensed phases, there is an additional intermolecular effect of carbocation stabilization: hydrogen bonding with the immediate surroundings. It leads to the strengthening of hyperconjugation and contributes to the scattering of the positive charge to the environment.17,28
In the present work we expanded the comparison of the computational results explaining stabilization of carbocations (structurally optimized and having the lowest energy) with empirical findings in IR spectra of carbocations in the series CH3+, C2H5+, i-C3H7+, t-Bu+, and cyclo-C5H9+, with the carborane counterions (CHB11Hal11−, Hal = F, Cl; hereinafter abbreviated as {Hal11−}, see Fig. 1), whose conjugated acids are the strongest pure Brønsted superacids available today.29,30 We established that IR spectra of {F11−} or {Cl11−} in ionic carbocation salts are not dependent on the nature of the cation and therefore are not considered here. The aims of the present study were (i) to determine whether t-Bu+ is a special case of a cation or a common representative of saturated carbocations and (ii) to verify the compatibility of the theoretical data with experimental results for a range of simplest carbocations. We focused on the C–H stretch vibrations because they are mostly sensitive to hyperconjugation and polarization effects. Despite the importance of intermolecular hydrogen bonding for carbocation stabilization in the condensed phase, this effect will not be examined here in detail because it does not change the hyperconjugation mechanism when going from vacuum to a condensed phase as shown previously.17,28
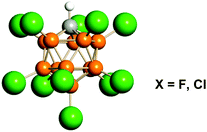 | ||
| Fig. 1 Icosahedral carborane anions of CHB11Hal11− type (Hal = F, Cl) abbreviated as {F11−} or {Cl11−}. Halogen atoms are depicted in green. | ||
Experimental
All sample handling was carried out in an inert atmosphere (H2O, O2 < 1 ppm) in a dry box. Carborane acids H{Hal11} and their CH3{Hal11} salts were prepared as previously described.30–33 The salts of C2H5+ and C3H7+ cations with the {F11−} anion were obtained by reacting CH3F with H{F11} in an IR cell-reactor with simultaneous recording of the IR spectra of the formed cations.33The spectrum of the C3H7+{F11−} salt was also obtained in another way: instead of the H{F11} acid, Et3Si{F11} was used, synthesized as described in ref. 30. A small drop of liquid 2-Cl-propane was added to an excess of solid Et3Si{F11} placed on the surface of the diamond attenuated total reflectance (ATR) accessory. A rapid reaction takes place
| Et3Si{F11} + C3H7Cl → C3H7+{F11−} + Et3SiCl↑, | (1) |
The cyclo-C5H9+{F11−} salt was obtained by means of direct interaction of liquid cyclo-pentane with a powder of H{F11} in accordance with eqn (2):
| cyclo-C5H10 + H{F11} → C5H9+{F11−} + H2 | (2) |
IR spectra of isopropyl and cyclo-pentyl carbocations with the {Cl11−} counterion were obtained as follows. A grain of the H{Cl11} acid was placed on the top face of the diamond crystal of the attenuated total reflectance (ATR) IR accessory and was wetted with a small drop of liquid 2-chloropropane or chloro-cyclo-pentane; this amount was not sufficient for full acid utilization. This approach ensures stoppage of the reaction at the first-stage, as illustrated in eqn (3) (an example of preparation of the i-Pr+ salt):
| C3H7Cl + H{Cl11} → C3H7+{Cl11−} + HCl. | (3) |
IR spectra were recorded on a Perkin Elmer Spectrum-100 spectrometer in the 4000–400 cm−1 frequency range in transmission or ATR mode. The spectrometer was installed inside the dry box. The spectra were manipulated using GRAMMS/A1 (7.00) software from Thermo Scientific.
Computational details
Geometric parameters of the species under study were optimized at the B3LYP-D3/def2-TZVPD level of theory34–37 using ultrafine grids. Equilibrium structures of compounds R{F11} and t-Bu{Cl11} were also calculated in a dichloroethane (DCE) solution (ε = 10.125) using the SMD solvation model.38 All stationary points were characterized as minima by a vibrational analysis (the number of imaginary frequencies [NImag] was equal to zero), unless stated otherwise. Zero-point energies (ZPEs) were computed from the corresponding vibrational frequencies without scaling factors. (SMD-)B3LYP-D3/def2-TZVPD optimized structures were used in all subsequent computations.To compare calculated and experimental vibrational frequencies, (SMD-)B3LYP-D3/def2-TZVPD harmonic frequencies were scaled by a factor of 0.9674 as recommended by Kesharwani et al.39 To obtain more accurate relative energies of some isomers, single-point high-level CCSD(T)/def2-TZVPD coupled-cluster computations40 within a frozen core approximation were additionally performed.
The energy decomposition analysis (EDA)41 was carried out for the most stable compounds at the B3LYP-D3/TZ2P level of theory using the scalar relativistic (SR) zeroth-order regular approximation (ZORA) Hamiltonian (core potentials were not used, and the quality of the Becke numerical integration grid was set to the keyword good).42
SR-ZORA-B3LYP-D3/TZ2P computations were performed using the ADF2016 software,43–45 while the remaining gas-phase calculations in the gas phase and in a DCE solution were conducted using the Gaussian09 software.46 The natural bond orbital (NBO) analysis47,48 was performed for the species of interest as implemented in Gaussian09. def2-TZVPD basis sets were taken from the EMSL database.49,50
Density functional theory (DFT) calculations with periodic boundary conditions were performed using the PBE functional51 with D3 dispersion correction36 using the VASP software package.52,53 The projector augmented wave (PAW) method54 was used to analyze the core states along with a plane-wave energy cutoff of 400 eV. Only the Γ point was used for sampling the Brillouin zone.
The convergence criteria for electronic and structural optimization were set to 10−6 eV and 10−5 eV Å−1, respectively. Harmonic vibrational frequencies were calculated by the finite difference method using the central difference with a step size of 0.015 Å.
All compounds were considered in their ground states. The spin-restricted formalism was employed for both DFT and CCSD(T) computations.
Results and discussion
Characterization of carbocations on the basis of calculations
To obtain a unified computational view, we considered all carbocations (R+) under study and their complexes with Ar and {F11−} in the gas phase and in solution at the same level of theory. The lowest-energy structures were chosen for subsequent analysis (see Fig. S1–S4 in ESI† for a complete list of isomers). The results obtained for the R+, R+⋯Ar and R{F11} species are given in Tables S1–S5 in ESI.† The stretching vibrations and some valent angles for naked and solvated carbocations are compared in Table 1.| Compound | C2H5+⋯Ar | i-Pr+ | i-Pr+⋯Ar | t-Bu+ | t-Bu+⋯Ar | c-C5H9+ | c-C5H9+Ar | ||||
|---|---|---|---|---|---|---|---|---|---|---|---|
a
E(CCSD(T)/def2-TZVPD//B3LYP-D3/def2-TZVPD) + ZPE(B3LYP-D3/def2-TZVPD).
b The θ angle is shown in Scheme 3. Averaged values of angle θ are presented.
c The characteristic frequencies of  bonds mostly affected by hyperconjugation are boldfaced. bonds mostly affected by hyperconjugation are boldfaced.
|
|||||||||||
| Symmetry | C s | C 2 | C 2v | C 1 | C s | C 1 | C s | C 1 | C 1 | C 2 | C 1 |
| NImag | 0 | 0 | 1 | 0 | 1 | 0 | 1 | 0 | 0 | 0 | 0 |
Relative energy,a kcal mol−1![[thin space (1/6-em)]](https://www.rsc.org/images/entities/char_2009.gif) |
0 | 0 | 0.2 | 0 | 0.1 | 0 | 0 | 0 | 0.1 | 0 | 0 |
| Dihedral angle θ, degreesb | 0 | 17 | 36 | 13 | 20 | 21 | 2 | 1 | 14 | 13 | 12 |
 angle, degrees angle, degrees |
92.6 | 102 | 107.8 | 101.4 | 104.6 | 104.9 | 103.3 | 103.2 | 103.9 | 98.1 | 98.1 |
| 102 | 107.8 | 102.8 | 104.6 | 105.9 | 104.1 | 104.1 | 104.3 | 98.1 | 98.6 | ||
| 106.8 | 104.1 | 104.1 | 105.2 | ||||||||
Scaled CH stretches,c cm−1![[thin space (1/6-em)]](https://www.rsc.org/images/entities/char_2009.gif) |
2612 (154) | 2764 (224) | 2841 (239) | 2766 (145) | 2803 (141) | 2853 (91) | 2835 (109) | 2840 (78) | 2842 (93) | 2704 (130) | 2711 (83) |
| 2777 (7) | 2855 (1) | 2799 (59) | 2815 (54) | 2864 (64) | 2838 (85) | 2843 (104) | 2851 (53) | 2712 (15) | 2735 (45) | ||
| 2881 (34) | 2852 (19) | 2855 (9) | 2871 (33) | ||||||||
| 2985 (17) | 2942 (54) | 2856 (0) | 2938 (28) | 2921 (53) | 2931 (16) | 2974 (5) | 2976 (3) | 2952 (12) | 2961 (0) | 2962 (0) | |
| 3024 (8) | 2944 (0) | 2856 (64) | 2960 (16) | 2923 (11) | 2944 (15) | 2975 (2) | 2977 (5) | 2970 (8) | 2969 (8) | 2970 (9) | |
| 3071 (11) | 3022 (0) | 3022 (1) | 3032 (0) | 3032 (1) | 2953 (10) | 2977 (8) | 2981 (5) | 2972 (5) | 2984 (22) | 2982 (12) | |
| 3128 (28) | 3053 (7) | 3062 (9) | 3053 (7) | 3059 (8) | 3050 (2) | 3044 (3) | 3045 (2) | 3048 (2) | 2986 (0) | 2994 (8) | |
| 3058 (9) | 3068 (5) | 3060 (8) | 3067 (5) | 3052 (3) | 3046 (1) | 3049 (2) | 3049 (2) | 3037 (0) | 3036 (1) | ||
| 3042 (1) | 3042 (1) | ||||||||||
The hyperconjugation effect is assumed to be the case starting from naked C2H5+. In this cation, the hyperconjugation strength is so significant that the  proton is converted to the bridge state leading to a symmetrical structure3 (II.1 in Fig. S1 in ESI†), which does exist in the condensed phase. Thus, we excluded the bridged structure from further analyses.
The C2H5+ structure becomes asymmetrical after solvation by the Ar atom via the C center. The  bond is oriented strictly parallel to the 2pz orbital of the sp2 C atom (θ = 0, see Scheme 3) and the
  angle is reduced (92.6°, Table 1); these data indicate a strong hyperconjugative interaction. The similar orientation of the
  bond from each CH3 group relative to the 2pz orbital of the sp2 C atom has only naked t-Bu+ (Cs, θ = 2°) and t-Bu+⋯Ar solvate (C1, θ = 1°).This finding corresponds to the generally accepted mechanism of carbocation hyperconjugative stabilization (Scheme 1). Nevertheless, the θ angles of t-Bu+ (C1), despite almost the same relative energy as in t-Bu+ (Cs), are increased by ca. 20°. The θ angle reaches values of 36° and 20° for the low-lying isomers of i-Pr+ (C2v) and i-Pr+⋯Ar (Cs) respectively (Fig. S2 and S3 in ESI†), which means that one C–H bond from each CH3 group is perpendicular to the vacant 2pz orbital, and two other C–H bonds are equivalently affected by hyperconjugation (Scheme 4). An intermediate case takes place in c-C5H9+ and c-C5H9+⋯Ar species, with θ ranging from 12° to 13°. Thus, rotation of the CH3 group by angle θ has a weak influence on the carbocation hyperconjugation stabilization.
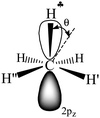 | ||
Scheme 3 A schematic representation of C2H5+–Ar (C3v, Ar is omitted) along the C–C bond. Dihedral angle θ shows deviation of the  plane from the direction of carbon's 2pz orbital. plane from the direction of carbon's 2pz orbital. | ||
The strong hyperconjugation influence on the CH3 group in asymmetric C2H5+⋯Ar (Scheme 3) leads to a strong decrease in the  stretch to 2612 cm−1, whereas frequencies of the other two CH′ and CH′′ bonds (νCH2) are changed much less as compared to neutral hydrocarbons (Table 1). The
  and νCH2 frequencies are highly characteristic and are not mixed (Fig. S5b in ESI†). Unlike C2H5+, solvation of other carbocations with Ar via the sp2 C atom has a slight effect on the calculated IR spectra (Table 1). The spectra of all carbocations under study (both naked and solvated with Ar) show similar features: (i) the bands of C–H stretches affected by hyperconjugation are significantly red shifted and have increased intensity (bold faced in Table 1); (ii) frequencies of the other C–H bonds of CH3/CH2 groups are rather increased or are in the frequency region common for neutral hydrocarbons; (iii) the normal vibrations of these bonds or groups have a highly characteristic nature.
To gain insights into the bonding situation for the representative R+⋯Ar and R{F11} complexes, we performed the EDA (Table S1 in ESI†) and NBO analyses (Table S2 in ESI†). The results of our gas-phase calculations for the carbocations paired with the {F11−} anion indicate the following: (a) in the case of R = C2H5, the hyperconjugation effect is the weakest one because of a covalent bond between ethyl and {F11} leading to a modest energy gain corresponding to hyperconjugative stabilization (ΔE(2)ij = 9.2 kcal mol−1; Table S2, ESI†) and rather weak IR intensity of the corresponding CH stretch vibration (Table S4, ESI†); (b) the spectrum of i-Pr+ (Table S4 in ESI†) shows only some signs of weak hyperconjugation (two slightly decreased frequencies at 2923 and 2916 cm−1 with somewhat increased intensity), suggesting that the bonding between i-Pr and {F11} moieties is still covalent (ΔE(2)ij = 11.7 kcal mol−1; Table S2, ESI†); (c) the spectra of cyclo-pentyl+ and t-Bu+ (Table S4 in ESI†) show greater resemblance to those of the corresponding Ar-solvated cations, as compared to the lighter carbocations.
NBO analysis revealed a polar covalent two-center two-electron C–F bond populated by 2.0 |e| at R = CH3, C2H5, and i-Pr. Indeed, according to the EDA (Table S1 in ESI†), the electrostatic interaction (ΔEelstat, 52–79%) between R+ and {F11−} moieties dominates over orbital (ΔEorb) and dispersion (ΔEdisp) interactions in all compounds. On the other hand, the energy of orbital interactions makes a noticeable contribution to the total attractive interactions when R = CH3 (47%), C2H5 (42%), and i-Pr (34%), in line with the calculated IR spectra. Thus, a covalent contribution to the C–F bond is present in all cases and gradually decreases in the order R = CH3 < C2H5 < i-Pr < cyclo-pentyl ≤ t-Bu simultaneously with the increase of hyperconjugative stabilization in the same order as can be seen from the corresponding ΔE(2)ij values (Table S2, ESI†).
However, as will be illustrated below, all solid R{F11} compounds, except for CH3{F11}, are characterized by ionic bonding. The reason is the bulk effect, which most clearly manifests itself in the example of alkali halides. They are ionic in the solid state, but their neutral diatomics are linked covalently in the gas phase showing stretch vibration (for example, νNa–Cl at 364.6 cm−1).55 So, the crystal lattice promotes ionic binding.
To model the effect of the environment taking place in the condensed phase, we performed NBO and EDA analyses of the R{F11} species when they are transferred from the gas phase to a DCE solution. This change of the phase is accompanied by an increase of the R–{F11} distance (Tables S1 and S2, ESI†), which is relatively small for R = CH3 (Δr = 0.033 Å) and pronounced when R = C2H5 (Δr = 0.120 Å), making the C–F bond more polar but retaining its covalent nature (ΔEorb, 38–48%). In the case of i-C3H7{F11}, the lengthening of C–F is the most pronounced (Δr = 0.604 Å), indicating that the character of the bond changes to presumably ionic (ΔEorb, 16%; ΔEelstat, 78%). Replacing i-C3H7+ with c-C5H9+ further increased the C–F separation to 2.584 Å, increasing the ionicity of the bond (ΔEorb, 12%). Finally, the t-C4H9{F11} compound has the C–F distance typical for ionic species (>2.6 Å, ΔEorb, 11%; Table S4, ESI†). Similar results were obtained in SMD-B3LYP-D3/def2-TZVPD calculations for DCE solutions: the dielectric medium increased the separation between R and {Hal11} fragments (Fig. S4, ESI†), which made C–Hal bonds more ionic. The C–Cl distance in t-Bu{Cl11} became very close to that in an ionic salt (3.545 Å, Fig. S6, ESI†), resulting in a small covalent contribution—to the bonding between the ions (ΔEorb, 14%; Table S1, ESI†)—approaching that in the solid phase. The calculated CH stretch frequencies for both phases also correlate well (Table S5, ESI†).
Increasing the ionicity of the R{F11} compounds in the series R = C2H5 < i-Pr < cyclo-pentyl < t-Bu strengthens the effect of hyperconjugation, as followed from the corresponding ΔE(2)ij values (Table S2, ESI†) and from the increase in the red-shift and intensity of the bands of CH stretches involved in hyperconjugation (Table S4, ESI†). It should be noted that the condensed phase enhances both ionicity and the effect of hyperconjugation in this series of R{F11} compounds gradually; this result contradicts experimental findings.
We have proved previously56 that “effective” basicity of {F11−} in the solid salt, (HCO)+{F11−}, is close to the basicity of the Ar atom, and the calculated spectra of the Ar⋯H+–CO and CO–H+⋯Ar solvates agree well with the experimental spectra of ionic compound (CO)H+{F11−}. Therefore, the experimental IR spectra of the ionic bulk salts under study are expected to better match the calculated IR spectra of weakly bound R+–Ar solvates rather than R+–{F11−} species with a notable covalent contribution (Table S1 in ESI†). The same conclusion follows from DFT calculations for t-Bu{Cl11}: the structure of t-Bu+ in the t-Bu{Cl11} crystal (Fig. S7 in ESI†) is similar to that in the naked or Ar-solvated carbocation rather than to the structure of molecular compound t-Bu{Cl11} with a distorted t-Bu+ moiety (Fig. S6a in ESI†). To sum up, computational results obtained for R+–Ar (or naked R+) should be used for comparison with the presented experimental findings.
Experimental IR spectra and properties of the carbocations
The CH3+ cation has an extremely high ability to bind to the bases. Even in the CH3{F11} compound with the weakest basic ion {F11−}, the methyl group forms a highly polar covalent bond.33The CH3+ cation is the most convenient object for evaluating the influence of the polarization effect on charge scattering over the methyl group in the absence of hyperconjugation.
Polarization is responsible for the transfer of some electron density from hydrogens to the central carbon. This effect leads to an increase of the CH stretch frequencies and strengthening of the force constants of CH bonds.23,28,33 For methyl carboranes, CH3{Hal11}, the dependence of νasCH3 on anion basicity is linear and extrapolates to zero basicity (neat CH3+) at 3103 cm−1.33 This value corresponds to the true CH3+ cation in the condensed phase, and is very close to that obtained with the B3LYP-D3/def2-TZVPD approximation (3108 cm−1, see Table S3 in ESI†).
The IR spectrum of the ethyl carborane, C2H5{Cl11}, revealed another extreme case:32 all C–H stretch frequencies are in the region 2933–3057 cm−1 indicating covalent binding between C2H5 and {Cl11} moieties, which prevents the hyperconjugation effect. The frequencies of the CH2 group of C2H5{Cl11} (3057 and 2976 cm−1) are slightly higher than those of the chloronium cation (C2H5)2Cl+ (3038 and 2974 cm−1), pointing to the more polar C–Cl bond in the case of C2H5{Cl11}.
The C2H5+ cation was obtained in the form of ionic salt C2H5+{F11−}. Its formation through an unstable salt of fluoronium cation, (CH3)2F+, is accompanied by the formation of i-Pr+.33 IR spectra showed the bands of both cations, whose intensities vary depending on the ratio of cations (Fig. 2a). Obtaining the difference between the spectra of the samples with a low and high portion of i-Pr+ (Fig. 2, red and black)—up to full compensation of the absorption from i-C3H7+—allowed us to obtain a spectrum of the C2H5+ cation (Fig. 2b). Reverse subtraction of the spectra (“black” minus “red”) did not fully remove the spectrum of the C2H5+ cation but allowed us to see the main features of the i-C3H7+ spectrum (Fig. 2c). The absorption contour of CH stretches affected by hyperconjugation is asymmetric for both cations and can be broken down into at least two components (Fig. 2b and c).
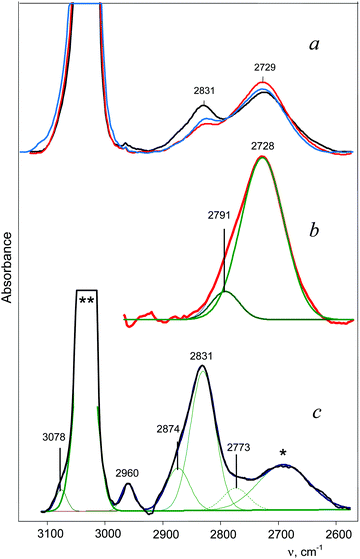 | ||
| Fig. 2 IR spectra of (a) a mixture of C2H5+{F11−} and i-Pr+{F11−} salts,33 showing the transformation of C2H5+ into i-Pr+ (red-blue-black); (b) the C2H5+ cation spectrum obtained by subtracting the black spectrum (a) from the red spectrum (a) until full compensation of the band at 2831 cm−1 of i-Pr+; (c) the i-C3H7+ spectrum isolated by reverse subtraction of the spectra: black (a) minus red (a). An uncompensated remnant from C2H5+ absorption is marked by an asterisk. The bands 3078 and 2960 cm−1 belong to the methyl group of the unreacted CH3{F11} salt. The strong band, marked with **, belongs to the {F11−} counterion. | ||
The IR spectrum of the i-C3H7+{F11−} salt obtained in reaction (1) differs from the spectrum shown in Fig. 2c. This means that two isomers of i-C3H7+ can form. This issue will be discussed below.
We did not succeed in obtaining a high-quality spectrum of the i-C3H7+{Cl11−} salt according to eqn (3) because formation of this salt is accompanied by formation of the chloronium cation (C3H7)2Cl+. Superimposition of the two spectra allowed us to determine only the maximum of the absorption from the C–H stretches of i-C3H7+ disturbed by hyperconjugation (Fig. S8 in ESI†).
The patterns observed in the IR spectra of the carbocations
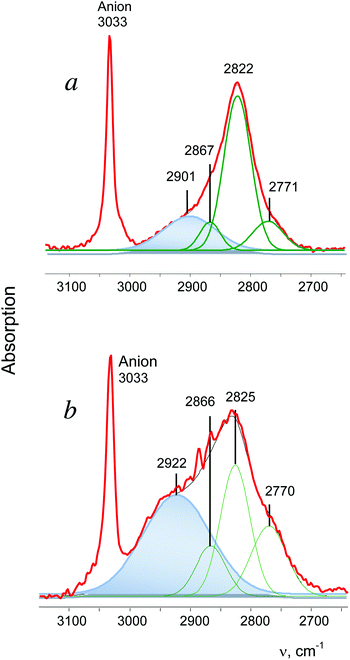
t-Bu+ is the most actively studied carbocation. On the basis of experimental data from the gaseous and condensed phase experiments, two CH3 groups of the t-Bu+ cation were proven to be involved in hyperconjugation.28 All three CH bonds of each group donate σ-electrons to the 2pz orbital of the sp2 C atom (Scheme 2) and their CH stretches appear in IR spectra as group vibrations, νsCH3 and νasCH3, with significantly decreased frequencies (at 2867, 2822 and 2771 cm−1 in the case of the salt with {F11−} counterion, Fig. 5a). The third CH3 group (marked as CH3*) is predominantly polarized and shows three higher-frequency bands in the gas phase. This observation is supported by important experimental evidence: the stretch vibrations of CH3 and CH3* groups in t-Bu+ show a good correlation (Table 2), which confirms their attribution to group vibrations and indicates that both types of CH3 groups are isoelectronic.| Group | ν asCH3 | ν sCH3 | |
|---|---|---|---|
| CH3* | 3038 | 2965 | 2913 |
| CH3 | 2880 | 2839 | 2793 |
| Ratio | 1.055 | 1.044 | 1.043 |
In addition, the C–H stretch frequencies of t-Bu+ involved in hyperconjugation very well correlate with those of the isoelectronic planar trimethyl boron (CH3)3B57 (Table 3). This observation confirms that the types of local CH3 normal vibrations for both compounds coincide, and the electron distributions in their methyl groups are identical.
| Group | ν asCH3 | ν sCH3 | |
|---|---|---|---|
| t-Bu+ gas | 2880 | 2839 | 2793 |
| (CH3)3B gas | 3000 | 2975 | 2875 |
| Ratio | 0.960 | 0.954 | 0.971 |
Finally, a good correlation was also observed between the frequencies of the CH3* group in t-Bu+ and those of the strongly polarized methyl group in CH3{F11}33 (Table 4), confirming the above-mentioned conclusions.
| Group | ν asCH3 | ν sCH3 | |
|---|---|---|---|
| t-Bu+ gas | 3038 | 2965 | 2913 |
| CH3{F11} solid | 3098 | 3086 | 2975 |
| Ratio | 0.981 | 0.961 | 0.979 |
In the condensed phases, t-Bu+ forms noticeable H-bonds with the nearest surroundings favoring involvement of the CH3* group in hyperconjugation, which is, however, weaker than that formed by its other two CH3 groups.28 This phenomenon is accompanied by enhanced dynamic properties of the H atoms of CH3*, resulting in collapse of the three bands of CH3* vibrations into one broad absorption (with an intensity of ca. 30% of that from all CH stretches) at a lower frequency28 (Fig. 5a).
The spectrum of i-Pr+ obtained in reaction (1) differs from that shown in Fig. 2b, but is very similar to the spectrum of t-Bu+ (Fig. 5). It shows a broad absorption pattern at 2922 cm−1 with intensity ca. 50% of the total intensity of the CH stretch vibrations of i-Pr+. The three bands at a lower frequency belong to the second CH3 group involved in stronger hyperconjugation (the ratio of their intensity values may change, depending on the conditions of separation of the bands, but the number of bands is always three). Thus, the above-mentioned i-Pr+ isomer is an analog of t-Bu+, with similar asymmetry, and will be designated as i-Pras+.
The spectrum of the second i-Pr+ isomer contains only two bands of CH3 groups involved in hyperconjugation (the third band was obviously not resolved) without the broad absorption (Fig. 2c). Thus, both CH3 groups equally participate in hyperconjugation. Hereinafter, we will refer to this symmetrical isomer as i-Prsym+.
The frequencies of hyperconjugated CH3 groups for both i-Pr+ isomers are close (Fig. 2c and 5b), which means that i-Pras+ and i-Prsym+ have roughly equal energy. Therefore, the efficiency of the positive charge redistribution over the CH3 and CH3* groups in carbocations is energetically equivalent.
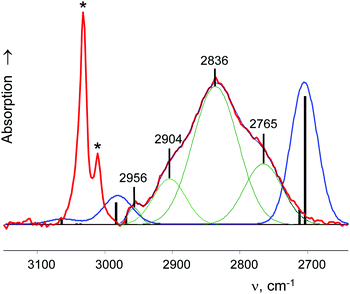
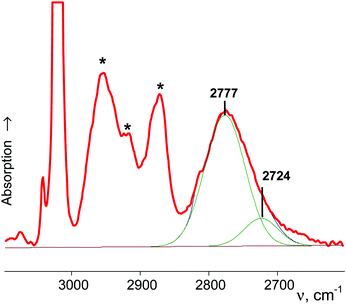
A charged C3 core of the cyclo-C5H9+ cation is similar to that of i-Prsym+. Its IR spectrum does not contain the broad absorption pattern (Fig. 3), indicating that this cation is symmetric. CH stretches of the two equivalent CH2α groups involved in hyperconjugation (Scheme 5) result in two low-frequency bands at 2836 and 2765 cm−1. The remote CH2β groups yield the bands νas at 2956 and νs at 2904 cm−1. Moreover, the ratio of frequencies for these bands coincides (Table 5). This finding implies identical assignment of frequencies for CH2α and CH2β groups and their isoelectronic character, as established for two types of CH3 groups of t-Bu+ (Table 2). This result leads to a major conclusion: both CH bonds of CH2α groups equally donate σ-electrons to the 2pz orbital of the sp2 C atom, in agreement with the case of t-Bu+.
| Group | ν asCH2 | ν sCH2 |
|---|---|---|
| CH2α | 2836 | 2765 |
| CH2β | 2956 | 2904 |
| Ratio | 0.959 | 0.952 |
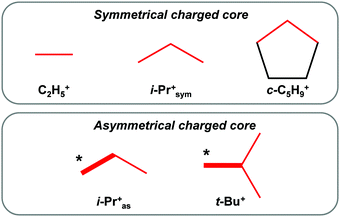
The C2H5+ spectrum shows two bands from the CH3 group vibrations, which are similar to those observed in the i-Prsym+ spectrum (Fig. 2b and c). The broad absorption pattern, of course, is absent. This finding points to some generic relation between C2H5+ and i-Prsym+. The overall picture of the generic relations between the analyzed carbocations with hyperconjugative stabilization is shown in Fig. 6.
One can see that there are two kinds of carbocations: (i) carbocations with one type of hyperconjugated CH3/CH2 groups (C2H5+, i-Prsym+, and c-C5H9+), which form a symmetrical C3 charged core; (ii) carbocations with an asymmetrical C3 or C4 charged core formed by two types of CH3 groups.
The frequencies of the CH3/CH2 groups mostly affected by hyperconjugation for all carbocations under study are summarized in Table 6. The decrease in the frequencies from {F11−} to {Cl11−} salts is due to the formation of H-bonds.17
| Cation | Anion | νCH3/νCH2 | ||
|---|---|---|---|---|
| a The most intense bands are boldfaced. b Not determined. | ||||
| C2H5+ | {F11−} | 2791 | 2728 | |
| i-Prsym+ | {F11−} | 2874 | 2831 | |
| i-Pras+ | {F11−} | 2866 | 2825 | 2770 |
| t-Bu+ | {F11−} | 2867 | 2822 | 2771 |
| Cyclo-pentyl+ | {F11−} | 2836 | 2765 | |
| i-Pr+ | {Cl11−} | 2780 | ||
| t-Bu+ 28 | {Cl11−} | 2830 | 2791 | 2746 |
| Cyclo-pentyl+ | {Cl11−} | 2777 | 2724 | |
All CH stretch vibrations of C2H5+, i-Pr+, cyclo-pentyl+, and t-Bu+ cations were observed in IR spectra with the exception of those from CH2 and CH groups at the sp2 C atom in C2H5+ and i-Pr+, respectively, which are weak and located in the frequency region of the intense C–H stretches from {F11−} or {Cl11−} anions.
| Carborane, X | Covalent compounds, R–X | Ionic salts, R+X− |
|---|---|---|
| {F11−} | H3C–X | R = C2H5+ and larger |
| {Cl11−} | H3C–X, C2H5–X | R = i-C3H7+ and larger |
CHB11Me5Br6−![[thin space (1/6-em)]](https://www.rsc.org/images/entities/char_2009.gif) 58 58 |
H3C–X, C2H5–X, i-C3H7–X | R = t-C4H9+ and larger |
As the calculations revealed, the experimental spectra of carbocations in condensed phases must be compared with those calculated for naked carbocations or carbocations solvated by argon, taking into account that the nature of hyperconjugative stabilization of carbocations does not depend on the phase state. This comparison of cations C2H5+, i-Pr+, and t-Bu+ is shown in Fig. 7. It uncovered some similarities and some significant discrepancies, already found for t-Bu+.28
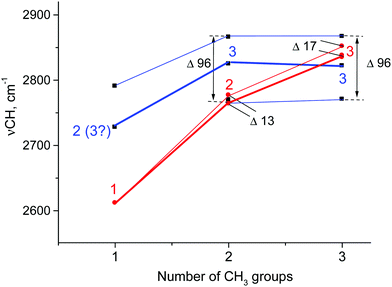
The discrepancies can be summarized as follows: (1) the calculated frequencies of hyperconjugated C–H bonds continuously increase as the number of CH3 groups in carbocations increases (C2H5+, i-Pr+, and t-Bu+; Fig. 7, red), but this is not the case for the empirically determined dependence (Fig. 7, blue). (2) The calculated frequencies are notably lower than empirical ones for C2H5+ and i-Pr+ and actually coincide only for t-Bu+, which is mentioned in the literature as proof of a good match between theory and experiment.1 Judging by the above results, it is obvious that this coincidence is rather accidental. (3) According to calculations, the number of C–H stretches of hyperconjugated CH bonds is equal to the number of CH3 groups: one for C2H5+, two for i-Pr+, and three for t-Bu+. The experiments imply that these numbers are 2(3), 3 and 3 respectively. (4) The calculated splitting of the bands is rather small (13–17 cm−1) and cannot be detected in the condensed-phase IR spectra because the corresponding bands should be merged into one slightly broadened (degenerated) band. In contrast, experimental spectra show three common bands for CH3 group vibrations separated by 96 cm−1.
A comparison of the calculated frequencies for the cyclo-pentyl+ cation (C2 symmetry) with the experimental spectrum of cyclo-C5H9+{F11−} revealed (Fig. 3) that there is also a significant discrepancy between theory and experiment, as in the case of C2H5+ and i-Pr+ cations. From the experimental spectrum it follows that both CH bonds of the CH2α group of cyclo-pentyl+ are equally influenced by hyperconjugation, and CH2α and CH2β are isoelectronic and have the same type of normal vibrations. The same is true for t-Bu+ (and i-Pras+): three C–H bonds of CH3 are equally involved in hyperconjugation, and both CH3 and CH3* groups are isoelectronic, with the same type of local group vibrations. Unfortunately, these results contradict computational data.
To try to reconcile the quantum-chemical calculations with the experiment, we performed PBE-D3 computations with periodic boundary conditions for the t-Bu{Cl11} crystal lattice previously determined by X-ray crystallography.17 No significant structural changes were found in the fully relaxed unit cell, as compared to the experiment. In contrast, the calculated vibrational frequencies of t-Bu+ in the crystal lattice were found to have the same features as those in gaseous t-Bu+ (Table S5 in ESI†), which again contradict the experimental findings. Similar results follow from the calculations when experimental atomic coordinates were used without relaxation (Table S5 in ESI†). Thus, the origin of inconsistencies in the mechanisms of carbocation hyperconjugation stabilization that follow from calculations and experiments has yet to be established.
Conclusions
According to the experiment, two sets of carbocations exist: with a symmetric and an asymmetric charged core. Our DFT calculations predict no carbocations with an asymmetrical charged core and their results in general contradict the experimental data.The standard theoretical representation of the mechanism of hyperconjugation predicts that σ-electron density is transferred to the empty 2pz orbital of the sp2 C atom from one preferred  bond of each CH3 group. At the same time, the σ-electron density on the other CH′ and CH′′ bonds slightly increases (Scheme 1). It looks like σ-electrons of the three C–H bonds of the CH3 group do not merge into molecular orbitals with the generalized electrons. This phenomenon manifests itself in calculated IR spectra, including high-level CCSD(T) computations,18 as a strong reduction in the
  frequency (much stronger than in the experiment) making it highly characteristic. Accordingly, vibrations of C–H′ and C–H′′ bonds also appear to be highly characteristic ones, which are not mixed with those of the
  bond. To the best of our knowledge, this case is unknown in the practice of vibrational spectroscopy.
From the experimental data it follows that donation of the σ-electrons from the  bond to the empty 2pz orbital of the sp2 C atom is accompanied by an equal withdrawal of the electron density from C–H′ and C–H′′ bonds. That is, the electrons are supplied from each CH bond of the CH3 group, and the
  bond does not act as the predominant donor. Thus, all three bonds of CH3 groups are equivalent. As a result, the CH stretches manifest themselves as typical CH3 group vibrations with a smaller red shift (∼60–100 cm−1) as compared with that predicted by calculations for
  stretches (100–200 cm−1). The vibrations of the stronger polarized CH3* group also appear to be common CH3 group vibrations with equivalent C–H bonds.
Because calculations revealed that the impact of hyperconjugation on the CH3 group weakly depends on the dihedral θ angle (the CH3 rotation around the C–C bond), the donation of the σ-electron density from CH3 to the empty 2pz orbital of the sp2 C atom may take place not only via the  bond, but also via CH′ and CH′′ bonds. This mechanism is indicated in Scheme 2 by a dashed arrow.
The aforementioned inconsistencies are valid for all quantum-chemical calculations of naked carbocations known to date. Furthermore, our DFT calculations for the t-Bu+{Cl11−} crystal and R{Hal11} molecular compounds in a DCE solution turned out to be comparable with those for naked carbocations, leading to the generally accepted mechanism of hyperconjugative stabilization rather than the mechanism deduced from our experiments.
We can hypothesize that fine electronic structure of carbocations that has not yet been taken into account may be responsible for the observed theory-versus-experiment discrepancies. It seems that potential energy surfaces of the carbocations under study are more complicated than expected and cannot be analyzed by the standard quantum-chemical methods such as conventional DFT. This is the subject of our ongoing research.
Undoubtedly, further computational studies in this field, possibly based on the more advanced methods, will result in convergence of the theory with experiment and will allow researchers to explain a number of recently detected features of carbocations, such as the energy equivalence of the CH3 and CH3* groups in asymmetric carbocations; why increasing the number of methyl groups from two (i-Pr+) to three (t-Bu+) does not influence the frequencies of C–H stretches; and the abrupt change in the state of the CH3* group when t-Bu+ is transferred from gaseous to condensed phases.28
Acknowledgements
This work was supported by grant # 16-13-10151 from the Russian Science Foundation and by the Ministry of Education and Science of the Russian Federation within the Project of the joint Laboratories of the Siberian Branch of the Russian Academy of Sciences and National Research Universities. Quantum chemical calculations were supported by the Russian Foundation for Basic Research (grant # 16-03-00357). The Siberian Supercomputer Center is acknowledged for providing computational resources. The authors thank Irina S. Stoyanova for providing the carborane acids and technical support.References
- G. E. Douberly, A. M. Rocks, B. W. Ticknor, P. V. R. Schleyer and M. A. Duncan, J. Am. Chem. Soc., 2007, 129, 13782 CrossRef CAS PubMed.
- M. A. Dunkan, J. Phys. Chem. A, 2012, 116, 11477 CrossRef PubMed.
- A. M. Ricks, G. E. Douberly, P. V. R. Schleyer and M. A. Dunkan, Chem. Phys. Lett., 2009, 480, 17 CrossRef CAS.
- B. Chiavarino, M. E. Crestoni, S. Fornarini, J. Lemaire, L. M. Aleese and P. Maitre, ChemPhysChem, 2004, 5, 1679 CrossRef CAS PubMed.
- G. Olah, E. B. Baker, J. C. Evans, W. S. Tolgyesy, J. S. McIntyre and I. J. Bastien, J. Am. Chem. Soc., 1964, 86, 1360 CrossRef CAS.
- H. Vančik, K. Percač and D. E. Sunko, J. Am. Chem. Soc., 1990, 112, 7418 CrossRef.
- D. M. Brouwer and E. L. Mackor, Proc. Chem. Soc., 1964, 147 CAS.
- G. A. Olah, Science, 1970, 168, 1298 CAS.
- D. M. Brouwer and H. Hogeveen, Prog. Phys. Org. Chem., 1972, 9, 179 CAS.
- G. A. Olah, J. M. Bollinger, C. A. Cupas and J. Lukas, J. Am. Chem. Soc., 1967, 89, 2692 CrossRef CAS.
- G. A. Olah, J. R. DeMember, A. Commeyras and J. L. Bribes, J. Am. Chem. Soc., 1971, 93, 459 CrossRef CAS.
- H. Vančik and D. E. Sunko, J. Am. Chem. Soc., 1989, 111, 3742 CrossRef.
- T. Laube, Acc. Chem. Res., 1996, 28, 399 CrossRef and references cited therein.
- T. Kato and C. A. Reed, Angew. Chem., Int. Ed., 2004, 43, 2908 CrossRef CAS PubMed.
- F. Scholz, D. Himmel, H. Scherer and I. Krossing, Chem. – Eur. J., 2013, 19, 109 CrossRef CAS PubMed.
- S. Hollenstein and T. Laube, J. Am. Chem. Soc., 1993, 115, 7240 CrossRef CAS.
- E. S. Stoyanov, I. V. Stoyanova, F. S. Tham and C. A. Reed, Angew. Chem., Int. Ed., 2012, 51, 9149 CrossRef CAS PubMed.
- H. Feng, W. Sun, Y. Xie and H. F. Schaefer III, Chem. – Eur. J., 2011, 17, 10552 CrossRef CAS.
- S. Sieber, P. Buzek, P. V. R. Schleyer, W. J. Koch and W. de M. Carneiro, J. Am. Chem. Soc., 1993, 115, 259 CrossRef CAS.
- G. Rasul, J. L. Chen, G. K. S. Prakash and G. A. Olah, J. Phys. Chem. A, 2009, 113, 6795 CrossRef CAS PubMed and references therein.
- J. Racine and S. Humbel, Chem. – Eur. J., 2014, 20, 12601 CrossRef CAS PubMed.
- J. I.-C. Wu and P. von R. Schleyer, Pure Appl. Chem., 2013, 5, 921 Search PubMed.
- K. B. Wiberg, P. V. R. Schleyer and A. Streitwieser, Can. J. Chem., 1996, 74, 892 CrossRef.
- W. Koch, B. Liu and P. V. R. Schleyer, J. Am. Chem. Soc., 1989, 111, 3479 CrossRef CAS.
- J. B. Nicholas, T. Xu, D. H. Barich, P. D. Torresa and J. F. Haw, J. Am. Chem. Soc., 1996, 118, 4202 CrossRef CAS.
- D. Fărcaşiu and D. Hâncu, J. Phys. Chem. A, 1997, 101, 8695 CrossRef.
- G. Rasul, J. L. Chen, G. S. Prakash and G. A. Olah, Comput. Theor. Chem., 2011, 964, 193 CrossRef CAS.
- E. S. Stoyanov and G. P. Gomes, J. Phys. Chem. A, 2015, 119, 8619 CrossRef CAS PubMed.
- C. Reed, Chem. Commun., 2005, 1669 RSC.
- M. Nava, I. V. Stoyanova, S. Cummings, E. S. Stoyanov and C. A. Reed, Angew. Chem., Int. Ed., 2014, 53, 1131 CrossRef CAS PubMed.
- M. Juhasz, S. Hoffmann, E. S. Stoyanov, K. Kim and C. A. Reed, Angew. Chem., Int. Ed., 2004, 43, 5352 CrossRef CAS PubMed.
- E. S. Stoyanov, I. V. Stoyanova, F. S. Tham and C. A. Reed, J. Am. Chem. Soc., 2010, 132, 4062 CrossRef CAS PubMed.
- E. S. Stoyanov, submitted for publication.
- A. D. Becke, J. Chem. Phys., 1993, 98, 5648 CrossRef CAS.
- C. Lee, W. Yang and R. G. Parr, Phys. Rev. B: Condens. Matter Mater. Phys., 1988, 37, 785 CrossRef CAS.
- S. Grimme, J. Antony, S. Ehrlich and H. Krieg, J. Chem. Phys., 2010, 132, 154104 CrossRef PubMed.
- F. Weigend and R. Ahlrichs, Phys. Chem. Chem. Phys., 2005, 7, 3297 RSC.
- A. V. Marenich, C. J. Cramer and D. G. Truhlar, J. Phys. Chem. B, 2009, 113, 6378 CrossRef CAS PubMed.
- M. K. Kesharwani, B. Brauer and J. M. L. Martin, J. Phys. Chem. A, 2015, 119, 1701 CrossRef CAS PubMed.
- G. D. Purvis III and R. J. J. Bartlett, Chem. Phys., 1982, 76, 1910 Search PubMed.
- M. von Hopffgarten and G. Frenking, Wiley Interdiscip. Rev.: Comput. Mol. Sci., 2012, 2, 43 CrossRef CAS.
- E. van Lenthe, E.-J. Baerends and J. G. Snijders, J. Chem. Phys., 1993, 99, 4597 CrossRef CAS.
- ADF2016, SCM, Theoretical Chemistry, Vrije Universiteit, Amsterdam, The Netherlands, http://www.scm.com.
- C. F. Guerra, J. G. Snijders, G. te Velde and E. J. Baerends, Theor. Chem. Acc., 1998, 99, 391 CAS.
- G. te Velde, F. M. Bickelhaupt, E. J. Baerends, C. Fonseca Guerra, S. J. van Gisbergen, J. G. Snijders and T. Ziegler, J. Comput. Chem., 2001, 22, 931 CrossRef CAS.
- M. J. Frisch, G. W. Trucks, H. B. Schlegel, G. E. Scuseria, M. A. Robb, J. R. Cheeseman, G. Scalmani, V. Barone, B. Mennucci and G. A. Petersson, et al., Gaussian 09, Revision D.01, Gaussian Inc., Wallingford, CT, 2013 Search PubMed.
- J. P. Foster and F. Weinhold, J. Am. Chem. Soc., 1980, 102, 7211 CrossRef CAS.
- A. E. Reed, L. A. Curtiss and F. Weinhold, Chem. Rev., 1988, 88, 899 CrossRef CAS.
- D. Feller, J. Comput. Chem., 1996, 17, 1571 CrossRef CAS.
- K. L. Schuchardt, B. T. Didier, T. Elsethagen, L. Sun, V. Gurumoorthi, J. Chase, J. Li and T. L. Windus, J. Chem. Inf. Model., 2007, 47, 1045 CrossRef CAS PubMed.
- J. P. Perdew, K. Burke and M. Ernzerhof, Phys. Rev. Lett., 1996, 77, 3865 CrossRef CAS PubMed.
- G. Kresse and J. Hafner, Phys. Rev. B: Condens. Matter Mater. Phys., 1993, 48, 13115 CrossRef CAS.
- G. Kresse and J. Furthmuller, Phys. Rev. B: Condens. Matter Mater. Phys., 1996, 54, 11169 CrossRef CAS.
- P. E. Blöchl, Phys. Rev. B: Condens. Matter Mater. Phys., 1994, 50, 17953 CrossRef.
- P. Brumer and M. Karplus, J. Chem. Phys., 1973, 58, 3903 CrossRef CAS.
- E. S. Stoyanov and S. E. Malykhin, Phys. Chem. Chem. Phys., 2016, 18, 4871 RSC.
- W. J. Lehmann, C. O. Wilson and I. Shapiro, J. Chem. Phys., 1959, 31, 1071 CrossRef CAS.
- T. Kato, E. S. Stoyanov, J. Geier, H. Grutzmacher and C. A. Reed, J. Am. Chem. Soc., 2004, 126, 12451 CrossRef CAS PubMed.
Footnote |
| † Electronic supplementary information (ESI) available. See DOI: 10.1039/c6cp06839a |
| This journal is © the Owner Societies 2017 |


