
Structure of aqueous NaOH solutions: insights from neural-network-based molecular dynamics simulations†
Matti
Hellström
and
Jörg
Behler
*
Lehrstuhl für Theoretische Chemie, Ruhr-Universität Bochum, 44780 Bochum, Germany. E-mail: joerg.behler@theochem.ruhr-uni-bochum.de
First published on 26th October 2016
Abstract
Sodium hydroxide, NaOH, is one of the most widely-used chemical reagents, but the structural properties of its aqueous solutions have only sparingly been characterized. Here, we automatically classify the cation coordination polyhedra obtained from molecular dynamics simulations. We find that, for example, with increasing concentration, octahedral coordination geometries become less favored, while the opposite is true for the trigonal prism. At high concentrations, the coordination polyhedra frequently deviate considerably from “ideal” polyhedra, because of an increased extent of interligand hydrogen-bonding, in which hydrogen bonds between two ligands, either OH2 or OH−, around the same Na+ are formed. In saturated solutions, with concentrations of about 19 mol L−1, ligands are frequently shared between multiple Na+ ions as a result of the deficiency of solvent molecules. This results in more complex structural patterns involving certain “characteristic” polyhedron connectivities, such as octahedra sharing ligands with capped trigonal prisms, and tetrahedra sharing ligands with trigonal bipyramids. The simulations were performed using a density-functional-theory-based reactive high-dimensional neural network potential, that was extensively validated against available neutron and X-ray diffraction data from the literature.
1 Introduction
Sodium hydroxide, NaOH, is one of the most widely-used commodity chemicals, that is frequently used to increase the pH of aqueous solutions in synthetic or analytical chemistry. Highly concentrated NaOH solutions are formed in the chloralkali process,1 and are used, for example, in the Bayer process for aluminium production,2 to clean Si solar cell wafers,3 and as solvents for the synthesis of various inorganic nanostructures.4 Because of their widespread usage, the properties, structure, and reactivity of NaOH solutions of different concentrations are of significant fundamental and practical interest. NaOH has an unusually high water solubility, 108.3 g/100 g H2O (52 weight% or 33 mol%), at 20 °C.5 In a saturated solution, there are only two H2O molecules per formula unit NaOH.In dilute solutions, the sodium cation Na+ weakly coordinates 5 or 6 aqua ligands,6 and the hydroxide anion OH− has been shown to prefer a “hypercoordinated” state, accepting four hydrogen bonds, one more than what would be the case from the traditional Lewis picture, and donating none.7–9 At higher concentrations, the structures of NaOH solutions were characterized by Soper and coworkers,8,10,11 who performed neutron diffraction experiments with isotopic substitution (NDIS), and Megyes et al.,9 who performed X-ray diffraction (XRD) experiments. They concluded, for example, that direct-contact Na+–OH− ion pairs are rare at low concentrations, but become increasingly common at higher concentrations. However, several questions were left unanswered, such as what the coordination geometries around Na+ are, as well as the extent of interligand hydrogen-bonding, i.e., hydrogen-bonding between two ligands around the same central ion. Those questions are addressed in the present article.
To interpret the reciprocal-space structure functions in terms of real-space radial distribution functions, the NDIS experiments were complemented by Monte Carlo simulations,8,11 and the XRD experiments by molecular dynamics simulations.9 Simulations can provide extremely detailed structural information, but the results normally depend on the underlying framework that is used to describe the atomic interactions. The OH− ion is notoriously difficult to model,12,13 because it can act as an acceptor in proton-transfer events, the description of which should be included in any realistic model of NaOH solutions. Megyes et al.9 found that better structural agreement, as compared to their XRD data, was obtained in ab initio molecular dynamics (AIMD) simulations than in simulations employing a classical potential that did not allow for proton-transfer events. Such events for OH− have previously been modeled using, for example, a multi-state-empirical-valence-bond-derived (MS-EVB) potential,14–17 the ReaxFF reactive force-field,18 or AIMD.7,9,19–21
Recently, we analyzed the proton-transfer reactivity in NaOH solutions and found that the predominant proton-transfer mechanism has a pronounced concentration dependence, as a result of structural changes in the environments around OH− and H2O.22 We developed and used an interatomic potential based on high-dimensional neural networks (HDNNs),23–25 that was directly fitted to density functional theory (DFT) reference data. The flexible functional form of HDNNs allow them to reproduce ab initio potential surfaces very accurately, and they have previously been used to, for example, investigate phase transitions in Si,26 crystallization kinetics in GeTe,27 the interface between Cu/Au nanoparticles and water molecules,28 and to explain the density anomality of liquid water.29 HDNNs are ideal for modelling NaOH solutions, since they by construction are “reactive”, i.e., allowing for proton-transfer events, and their low computational cost (only a fraction of that required by ab initio methods) allows for simulations of large systems for long times.
Here, we use our high-dimensional neural network potential22 to characterize the structure of NaOH solutions. We first extensively validate the neural network by calculating structure functions that can be directly compared to those from neutron and X-ray diffraction experiments.8–11 We then characterize the environment around the Na+ cations in detail, and go beyond the characterization in previous works8,9,11,20 in several ways: (i) we investigate the orientation of the aqua and hydroxido ligands relative to the Na+–O bonds, (ii) we observe an increased propensity for interligand hydrogen-bonding at higher concentrations, (iii) we use a scheme based on Steinhardt order parameters30 to automatically classify the structure of different coordination polyhedra around Na+, (iv) we investigate how frequently each kind of coordination polyhedron occurs and find that some are more favored at low concentrations while others are favored at higher concentrations, (v) we find that interligand hydrogen-bonding, as well as the presence hydroxido ligands, are more likely for some certain polyhedra (of some certain sizes), (vi) we investigate, for a saturated solution of NaOH(aq), connectivity patterns of polyhedra, and how certain polyhedra are more likely to be “linked” (share ligands) to some polyhedra than to others.
These results provide in-depth insights into the different structural features that are present in, and likely to govern the reactivity of, NaOH solutions, that constitute one of the most widely-used chemical reagents.
2 Method
2.1 Simulations with a high-dimensional neural network potential
We describe the potential energy surface of liquid NaOH(aq) solutions using a high-dimensional neural network (HDNN) potential.23–25,31 We previously showed that our HDNN, over the entire solubility range of NaOH(aq), gives only small errors for both energies (RMSE = 1.6 meV per atom) and forces (RMSE = 0.14 eV Bohr−1), as compared to a reference “testing” set of DFT calculations that were not included in the parameterization procedure.22 The HDNN was parameterized towards DFT calculations at the RPBE-D3 level of theory. The RPBE functional32 (or the closely related revPBE), together with dispersion corrections like Grimme's D3,33 have previously been shown to describe both the structure of liquid water,29,34–36 and the hydration of Na+,37,38 very well.An HDNN is constructed from a set of element-specific feed-forward NNs. For each atom i in the system, the output of the corresponding element-specific NN is the “atomic energy” Ei, and the total energy of the system  . The input data to an element-specific NN consists of all of the coordinates of all of the atoms in the system, that are suitably transformed via a set of rotationally-invariant so-called symmetry functions.23,24 We use two types of symmetry functions, with radial (Grad) or radial + angular (Gang) dependencies, that for the atom i of element I (in the I-specific NN) are calculated as:
 | (1) |
 | (2) |
The values of the set of symmetry functions are unitless and form the input layer to the element-specific feed-forward NN. The input layer is processed by the feed-forward NN via a series of linear combinations and “activation functions”, that in the end yield the output layer, which here is the atomic energy Ei. This procedure involves, for each element-specific NN, a set of weights, that are parameters fitted during the HDNN parameterization in order to minimize the overall RMSE towards a set of reference calculations at a high level of theory. Large training sets are required because of the substantial number of weight parameters of the HDNN. We used a training set with more than 16![[thin space (1/6-em)]](https://www.rsc.org/images/entities/char_2009.gif) 000 structures including ice, water, and different concentrations of NaOH(aq). More information about the technical details of our HDNN for NaOH(aq) solutions is provided in the ESI,† as well as in ref. 22.
000 structures including ice, water, and different concentrations of NaOH(aq). More information about the technical details of our HDNN for NaOH(aq) solutions is provided in the ESI,† as well as in ref. 22.
A detailed description of the HDNN methodology, as well as a tutorial review on the construction of HDNN potentials, can be found in ref. 39.
2.2 Molecular dynamics simulations
We identify the solutions using the mole fraction xNaOH, which is defined as | (3) |
| x NaOH | w% | N NaOH | N H2O | L (Å) | c (mol L−1) | ρ (g cm−3) |
|---|---|---|---|---|---|---|
| 0.000 | 0 | 0 | 512 | 25.63 | 0.0 (0.0) | 0.91 (1.00) |
| 0.008 | 1.7 | 4 | 504 | 25.35 | 0.4 (0.4) | 0.93 (1.02) |
| 0.016 | 3.5 | 8 | 496 | 25.35 | 0.8 (0.9) | 0.94 (1.04) |
| 0.049 | 10 | 24 | 464 | 24.84 | 2.6 (2.9) | 1.01 (1.11) |
| 0.085 | 17 | 40 | 432 | 24.39 | 4.6 (5.1) | 1.07 (1.19) |
| 0.123 | 24 | 56 | 400 | 23.97 | 6.8 (7.5) | 1.14 (1.26) |
| 0.143 | 27 | 64 | 384 | 23.76 | 7.9 (8.8) | 1.17 (1.30) |
| 0.185 | 34 | 80 | 352 | 23.37 | 10.4 (11.4) | 1.24 (1.36) |
| 0.255 | 43 | 104 | 304 | 22.81 | 14.5 (15.8) | 1.35 (1.46) |
| 0.306 | 49 | 120 | 272 | 22.49 | 17.5 (18.8) | 1.42 (1.52) |
| 0.333 | 53 | 128 | 256 | 22.31 | 19.1 (20.4) | 1.46 (1.55) |
2.3 Simulated X-ray diffraction
In X-ray scattering experiments, the structure function S(Q) is obtained as a function of the momentum transfer Q = 4πsin(θ)/λ, where the detector is at an angle 2θ to the direction of the incident beam, and λ is the wavelength. Such structure functions were obtained for NaOH solutions by Megyes et al.9
In simulations, S(Q) can be estimated as
 | (4) |
| fi(Q) = (1 + αie−Q2/2δi2)fi*(Q), | (5) |
 | (6) |
| Species | a 1 | b 1 (Å2) | a 2 | b 2 (Å2) | a 3 | b 3 (Å2) | a 4 | b 4 (Å2) | c | α | δ (Å−1) |
|---|---|---|---|---|---|---|---|---|---|---|---|
| Na+ | 3.25650 | 2.66710 | 3.93620 | 6.11530 | 1.39980 | 0.200100 | 1.00320 | 14.0390 | 0.404000 | 0 | — |
| O | 3.04850 | 13.2771 | 2.28680 | 5.70110 | 1.54630 | 0.323900 | 0.867000 | 32.9089 | 0.250800 | 0.15 | 2.2 |
| H | 0.489918 | 20.6593 | 0.262003 | 7.74039 | 0.196767 | 49.5519 | 0.049879 | 2.20159 | 0.001305 | −0.60 | 2.2 |
The functional form of fi(Q) in eqn (5) was introduced by Sorenson et al.44 Here, we use the charge-transfer parameters αO = 0.15 and αH = −4αO = −0.60 proposed in ref. 43, corresponding to the transfer of 0.6 e− from each H in an H2O molecule to the O, and δO = δH = 2.2 Å−1. The calculated structure functions S(Q) are not very sensitive to the choices of α and δ.
Finally, hij(Q) in eqn (4) is calculated from the partial radial distribution functions gij(r):
 | (7) |
The structure function S(Q) can be used to calculate the “total” radial distribution function gtot(r), that was one of the quantities in focus in the X-ray diffraction study by Megyes et al.:9
 | (8) |
2.4 Simulated neutron diffraction
In neutron diffraction, the neutrons are scattered by the atomic nuclei, and the scattering lengths bi (not to be confused with bk in eqn (6) and Table 2) are not Q-dependent, unlike the form factors fi(Q).Soper and coworkers8,10,11 performed neutron diffraction for NaOH(aq) using different concentrations of deuterium. The scattering lengths for H and D are very different (bH = −0.373 fm, bD = +0.676 fm),45 and they could thus extract three sets of “composite partial structure factors” (CPSFs) SHH(Q), SXH(Q), and SXX(Q), where X represents both Na and O. We make some direct comparisons to their CPSFs, that are calculated as
 | (9) |
 | (10) |
| SHH(Q) − 1 = hHH(Q), | (11) |
In ref. 10, the authors also reported the interference scattering cross-sections F(Q) at one concentration of NaOH, where
 | (12) |
2.5 Coordination polyhedra around Na+
The automatic classification of atomic or crystalline environments from molecular dynamics simulations is a challenging task, and constitutes an active field of research.46–50 Some of the possible applications include, for example, to distinguish between liquid and solid phases during crystallization,47 or to identify defects in solids.48 Even classifying the coordination polyhedron around a cation in aqueous solution is not straightforward, because small displacements of the ligands can change the overall shape of the coordination polyhedron, and the coordination geometry might deviate considerably from “ideal” geometries like trigonal-bipyramidal, octahedral, etc. Clark and coworkers51 developed a method based on distance-dependent connectivities between the ligands, that uniquely identified polyhedra using a PageRank-like algorithm, and applied it to different cations in water,52 as well as to Na+ in various mixtures of water/methanol.53Here, we use the so-called Steinhardt order parameters,30 that do not depend on any distances but only on the ∠L1ML2 angles, where M is the central ion and L1 and L2 are ligands. Such rotationally-invariant order parameters are typically used to, for example, distinguish between hcp and fcc packing in metals, or to classify coordination polyhedra in solids,54 but as far as we are aware, have not previously been used to classify coordination polyhedra around ions in aqueous solution.
Teich et al.55 used the Steinhardt order parameters to investigate packing of polyhedra in spherical confinement. In doing so, they classified polyhedra by comparing calculated values of the order parameters to reference values of ideal polyhedra. Here, we applied a similar approach, but we iteratively expanded the library of reference values to include values for some distorted polyhedra, until only very few polyhedra were misassigned (as judged from manual inspection).
The lth Steinhardt order parameter Ol for an ion with N (mono-dentate) ligands is:
 | (13) |
 | (14) |
The values of the reference O-vectors are given in Table 3. Most polyhedra have more than one reference vector associated to it, due to the iterative expansion of the set of reference vectors. We only assign polyhedra if the error E < 0.15, which leaves about 5–30% (depending on the number of ligands and on the concentration) of coordination polyhedra unassigned and discarded in the subsequent analysis.
| Polyhedron | O ref1 | O ref2 | O ref3 | O ref4 | O ref5 |
|---|---|---|---|---|---|
| N = 4 | |||||
| See-saw | 0.2499 | 0.3308 | 0.4239 | 0.7255 | 0.3375 |
| 0.1798 | 0.3675 | 0.4522 | 0.6887 | 0.3784 | |
| 0.1430 | 0.3778 | 0.4615 | 0.6767 | 0.4173 | |
| 0.3163 | 0.2365 | 0.4865 | 0.6585 | 0.4978 | |
| 0.1017 | 0.4041 | 0.5681 | 0.3893 | 0.6301 | |
| 0.1627 | 0.3365 | 0.5712 | 0.5035 | 0.5727 | |
| 0.3382 | 0.3250 | 0.4923 | 0.5141 | 0.5712 | |
| 0.3757 | 0.2489 | 0.4608 | 0.5694 | 0.6372 | |
| Square planar | 0.0000 | 0.5000 | 0.0000 | 0.8292 | 0.0000 |
| 0.3333 | 0.3333 | 0.4074 | 0.5844 | 0.6727 | |
| Tetrahedron | 0.0000 | 0.0001 | 0.7454 | 0.5092 | 0.0002 |
| 0.1089 | 0.1058 | 0.7143 | 0.5177 | 0.2778 | |
| 0.0594 | 0.1021 | 0.7266 | 0.5137 | 0.2188 | |
| N = 5 | |||||
| Flap pyramid | 0.1088 | 0.2929 | 0.3293 | 0.5955 | 0.5038 |
| Pentagonal | 0.0000 | 0.5000 | 0.0002 | 0.3750 | 0.7016 |
| 0.0269 | 0.4999 | 0.0302 | 0.3813 | 0.6911 | |
| Square pyramid | 0.2000 | 0.2000 | 0.2000 | 0.7746 | 0.2000 |
| 0.2584 | 0.1985 | 0.1343 | 0.7493 | 0.3414 | |
| 0.1479 | 0.1983 | 0.2888 | 0.7498 | 0.1950 | |
| 0.1511 | 0.2100 | 0.3018 | 0.7277 | 0.2359 | |
| 0.0984 | 0.0877 | 0.5292 | 0.4889 | 0.4793 | |
| 0.1705 | 0.2225 | 0.4443 | 0.5693 | 0.3701 | |
| 0.0846 | 0.2139 | 0.4052 | 0.6279 | 0.3885 | |
| Trigonal bipyramid | 0.0001 | 0.1000 | 0.4743 | 0.6250 | 0.3137 |
| 0.0804 | 0.1112 | 0.4721 | 0.6081 | 0.3460 | |
| 0.0750 | 0.1238 | 0.4723 | 0.6066 | 0.3362 | |
| N = 6 | |||||
| Double flap octahedron | 0.1261 | 0.0997 | 0.4026 | 0.4305 | 0.4831 |
| 0.0699 | 0.1961 | 0.4136 | 0.3314 | 0.5114 | |
| Trigonal prism | 0.0813 | 0.0998 | 0.3660 | 0.4416 | 0.5895 |
| 0.0811 | 0.1047 | 0.3549 | 0.4590 | 0.5791 | |
| 0.1426 | 0.1538 | 0.3119 | 0.4837 | 0.5088 | |
| 0.1080 | 0.1769 | 0.4039 | 0.3368 | 0.5484 | |
| Flap octahedron | 0.0876 | 0.1035 | 0.2893 | 0.5814 | 0.4294 |
| Octahedron | 0.0000 | 0.0000 | 0.0000 | 0.7638 | 0.0000 |
| 0.0445 | 0.0020 | 0.0661 | 0.7525 | 0.1281 | |
| 0.0538 | 0.0145 | 0.0838 | 0.7461 | 0.1563 | |
| 0.1723 | 0.0350 | 0.2672 | 0.5896 | 0.4261 | |
| 0.1691 | 0.1111 | 0.2253 | 0.5875 | 0.4530 | |
| N = 7 | |||||
| Capped trigonal prism | 0.1587 | 0.1046 | 0.2366 | 0.3538 | 0.5941 |
| 0.1582 | 0.1092 | 0.2238 | 0.3701 | 0.5861 | |
| Pentagonal bipyramid | 0.0000 | 0.0714 | 0.0001 | 0.5536 | 0.5011 |
| 0.0405 | 0.0802 | 0.0525 | 0.5441 | 0.5023 | |
| 0.0467 | 0.2325 | 0.1448 | 0.4324 | 0.5054 | |
| Capped octahedron | 0.1429 | 0.1429 | 0.1429 | 0.5990 | 0.1429 |
| 0.1647 | 0.1430 | 0.1658 | 0.5900 | 0.1434 | |
We consider OH2 (aqua) and OH− (hydroxido) to be ligands around a particular Na+, if the Na+–O distance is smaller than the distance at which the first minimum in the gNaOwater(r) and gNaOhydroxide(r) appears. The cutoff distances vary, from low to high concentration, between 3.27–3.24 Å for OH2 and between 2.96–3.11 Å for OH−.
To classify species as either H2O molecules or OH− ions, we consider each H to be covalently bound to its nearest O atom. O atoms that are bound to two H atoms are water oxygens, and O atoms that are bound to one H are hydroxide oxygens. This method gives a constant number of H2O and OH− species throughout the simulation.
3 Results and discussion
3.1 Structure functions and radial distribution functions
We here characterize the average liquid structure obtained from our neural network-based simulations to those obtained in X-ray diffraction experiments by Megyes et al.9 and neutron diffraction experiments by Soper and coworkers.8,10,11Here, we similarly compute gtot(r) but also calculate S(Q) directly and compare to the experimental data of Megyes et al.9Fig. 1 shows the calculated structure functions, and there is in general good agreement between our simulations and their experiment. As the concentration increases, the first peak at 2.2–2.5 Å−1 grows and the peak at 2.9–3.4 Å−1 shrinks somewhat. Both peaks move towards greater values of Q. For the highest concentrations, there are some visible differences between the simulations and the experiment at Q > 4 Å−1, where the peaks/valleys are higher and deeper in the simulation, and also shifted towards somewhat smaller Q-values.
 | ||
| Fig. 1 Experimental (symbols, digitally extracted from ref. 9) and neural-network-potential-simulated (lines, this work) structure functions S(Q) (subtracted by 1 and multiplied by Q to show more of the wiggles at large Q, as done in ref. 9) for different mole fractions xNaOH (experimental values within parentheses). | ||
Fig. 2 shows the experimental and calculated gtot(r): as the concentration increases, the first minimum in gHDNNtot(r) around 3.5 Å first becomes shallower (xNaOH = 0.05) and then becomes deeper as it moves towards a smaller r of ≈3 Å (xNaOH = 0.09–0.31). This trend is largely similar to the trend in gexpttot(r), although the first “minima” (that are not always true minima, but sometimes only depressions after the first peak) are shallower in gexpttot(r) than in gHDNNtot(r), indicating that the HDNN might give somewhat “overstructured” solutions. The first peak in gHDNNtot(r), at around 2.9 Å for water, becomes smaller and broader as xNaOH increases. In addition, a peak at r ≈ 2.4 Å begins to grow. In the experimental data gexpttot(r), there are more pronounced concentration-dependent changes of the first peak, but they are largely similar to the HDNN-calculated ones. The most significant difference between the experimental data and the HDNN simulations, is that for the highest xNaOH = 0.31, the first peak in gexpttot(r) is at r = 2.4 Å, while the corresponding peak in gHDNNtot(r) is at larger r = 2.6 Å. The second peak progressively moves towards smaller values of r as xNaOH increases, for both gHDNNtot(r) and gexpttot(r). Overall, our calculated gHDNNtot(r) curves for the different mole fractions, and their agreement with the experimentally obtained curves, are quite similar to the AIMD simulations of Megyes et al.9
 | ||
| Fig. 2 Total radial distribution functions gtot(r) from experiment (symbols; calculated by us using eqn (8) and the digitally extracted S(Q) from ref. 9 shown in Fig. 1), and from HDNN simulations (lines), for different mole fractions xNaOH (experimental values within parentheses). | ||
The atoms in the NaOH solutions that primarily scatter X-rays are Na and O, and so the main contributors to gtot(r) are gNaNa(r), gNaO(r), and gOO(r). Note, that gtot(r) is not a simple linear combination of these contributions since the scattering factors fi(Q) depend on Q. Fig. 3 shows the calculated gtot(r), gNaNa(r), gNaO(r), and gOO(r) for the solutions with the same mole fractions as in Fig. 1 and 2. The peak growing at r ≈ 2.4 Å in gtot(r) clearly appears as a result of the characteristic Na–O distance, evident from the peak at 2.4 Å in gNaO(r). The height of the first peak in gNaO(r) decreases significantly as the concentration increases, and the first minimum becomes less pronounced. This indicates that the first solvation shell around Na+ becomes less well-defined at higher concentrations (see also Section 3.2.1).
 | ||
| Fig. 3 Simulated X-ray total radial distribution functions gtot(r) (black; they are the same as the lines in Fig. 2), together with primary components gNaNa(r) (red), 0.5gNaO(r) (green; multiplied by 0.5 for clarity), and gOO(r) (blue). | ||
At xNaOH = 0.31, the first peak in gexpttot(r) is at 2.4 Å, the same distance as the first peak in gHDNNNaO(r). However, in gHDNNtot(r), the first peak is at somewhat larger r = 2.6 Å. This implies that the relative weighting of the gNaNa(r) and gOO(r) functions in the calculation of gtot(r) might be erroneous. A possible reason for this lies in the simplified assumptions that go into the calculation of the scattering factors fi(Q). For example, we weight all O atoms equally, no matter if they form part of H2O molecules or OH− ions, or if they are coordinated to 0, 1, 2, or 3 Na+ ions.
The first peak of gHDNNOO(r) moves, with increasing concentration, towards shorter distances as a result of the HOH⋯OH− hydrogen bonds being shorter than HOH⋯OH2. Another peak, at 3.5 Å, successively grows, corresponding to the distance between adjacent ligands around the same Na+ ion.
The first peak in gNaNa(r) grows significantly as xNaOH increases, and moves from r ≈ 3.8 Å at xNaOH = 0.05 to 3.6 Å at xNaOH = 0.31. That there is a “nearest-neighbor” Na–Na peak even at the small mole fraction xNaOH = 0.05, implies that Na+ ions dynamically form and break ligand-separated (solvent-separated) like-charged ion pairs, i.e., that one or more H2O (or OH−) bridge two Na+ ions. However, the average Na–Na “coordination number” at this low concentration is still small: if the running coordination number for gNaNa(r) is calculated up to the first minimum at 5.0 Å, the average coordination number becomes only 0.1.
:H2O = 1:5.12; xNaOH = 0.163), while other parts indicate that it was 16 mol L−1 (NaOH:H2O ratio 1:3, xNaOH = 0.25). Because the same authors in ref. 8 referred to the work in ref. 10 as a “1:3” solution, we here compare our calculated interference scattering cross sections FH(Q), Fmix(Q) and FD(Q) for the 1:3 (xNaOH = 0.25) HDNN-simulated solution to those measured in ref. 10 by Bruni et al. Here, Fmix(Q) refers to a system with a 1:1 H:D ratio. Fig. 4a shows that the agreement is excellent for FD(Q) and Fmix(Q), while the calculated and experimental FH(Q)-curves coincide for most Q-values but differ somewhat for small Q (<3.5 Å−1). Overall, however, the agreement to the neutron diffraction experiments is very good.
The interference functions F(Q) in Fig. 4a can be transformed into the partial composite structure factors SHH(Q), SXH(Q), and SXX(Q), shown in Fig. 4b (still for xNaOH = 0.25). Again, the agreement to experimental curves from Botti et al.8 is very good, despite the differences in FH(Q) for small Q.
 | ||
| Fig. 4 (a) Neutron diffraction interference scattering cross-sections FH(Q), Fmix(Q) (for a 1:1 H:D ratio), and FD(Q) at xNaOH = 0.25. The experimental data (symbols, T = 300 K) has been digitally extracted from ref. 10. (b) Composite partial structure factors (CPSFs) SXH(Q), SHH(Q), and SXX(Q) at xNaOH = 0.25, and SXX(Q) at xNaOH = 0.14 and 0.085. Experimental data (symbols, T = 300 K, mole fractions within parentheses) has been digitally extracted from ref. 8 and 11. | ||
Finally, Imberti et al.11 presented SXX(Q)-functions for a series of different concentrations of NaOH(aq). We show their measured structure functions in Fig. 4b for xNaOH = 0.15 and 0.077 and compare to our calculated ones at xNaOH = 0.14 and 0.085. The agreement is quite good for all concentrations: in both the experimental and HDNN-simulated functions, the first peak at 2.1–2.2 Å−1 grows and shifts towards larger Q as xNaOH increases, and the second peak at 3.0–3.1 Å−1 becomes smaller and also shifts towards larger Q.
In summary, we have in this section shown an overall satisfactory agreement between our simulated NaOH(aq) structures and the X-ray diffraction experiments by Megyes et al.9 and the neutron diffraction experiments by Soper and coworkers.8,10,11 This gives us confidence that the HDNN is able to capture the relevant structural features of NaOH(aq) solutions.
3.2 Coordination around Na+: general
 | ||
| Fig. 5 (a) Calculated coordination distributions around Na+ for solutions with four different mole fractions xNaOH. Only coordination environments that occur for ≥1% of Na+ ions are shown. (b) Histograms for the fraction of Na+ ions with a certain total coordination number. | ||
Fig. 5b shows the distribution of total coordination numbers (i.e., to both H2O and OH−) for some different values of xNaOH. Notably, the fraction of seven-coordinate Na+-species increase with increasing concentration. Fig. 6a shows that the average coordination number ( ) increases only slightly with concentration, in agreement with observations by Megyes et al.9 However, if smaller cutoff distances were used (smaller than the first minimum in the Na+–Owater and Na+–Ohydroxide radial distribution functions), for example 3.0 Å,
  would instead decrease with increasing concentration. Thus, the increasing coordination number with concentration arises from an increased number of ligands that are at the border between the first and second coordination shells, in line with the significant increase in the first minimum in gNaO(r) with increasing concentration (Fig. 3).
 | ||
| Fig. 6 (a) Average coordination numbers for Na+ to H2O (red), OH− (green), and total (black). (b) Relative preference for Na+ to coordinate to H2O as compared to OH−. | ||
As one would intuitively expect, with increasing concentration Na+ coordinates more OH− and fewer H2O (Fig. 6a). In addition, Na+ preferentially coordinates to H2O at all xNaOH. This is not only because of the greater number of H2O molecules as compared to OH− ions. Fig. 6b shows the “relative preference” for Na+ to coordinate to H2O, calculated as  . At low xNaOH, this relative preference has a value of ≈5, meaning that Na+ is 5 times more likely to coordinate to H2O than to OH−, as compared to an artificial system where the Na+ affinity to H2O and OH− would be equal. As xNaOH increases, this relative preference decreases towards a value of 1, indicating that at higher xNaOH the Na+ become less selective about their ligands and simply “take what they can get”. Indeed, at such high concentrations, only few H2O or OH− are not coordinated by Na+.
We estimate the stability constant Kx at xNaOH = 0.008 for the reaction
| [Na(OH2)x]+(aq) + OH−(aq) → [Na(OH)(OH2)x−1]0(aq) + H2O | (15) |
 | (16) |
 | (17) |
 | (18) |
 | (19) |
![[circle, cut, short horiz bar]](https://www.rsc.org/images/entities/char_e0eb.gif) = 1 mol L−1. Thus, the fewer the number of ligands, the more the formation of a direct-contact Na+–OH− ion pair is favored. However, as we have shown previously, such ion pairs are very short-lived, because of a decreased proton-transfer barrier for OH− coordinated by Na+.22
= 1 mol L−1. Thus, the fewer the number of ligands, the more the formation of a direct-contact Na+–OH− ion pair is favored. However, as we have shown previously, such ion pairs are very short-lived, because of a decreased proton-transfer barrier for OH− coordinated by Na+.22
 | ||
| Fig. 7 Probability densities at different mole fractions for (a) the Na–Ohydroxide–H angle, and (b) the Na–Owater–H angle. (c) Joint probability density function at xNaOH = 0.333 for the Na–Owater–H angle and Na–Owater distance. (d) Water tilt angle distributions at different xNaOH. | ||
The water tilt angle distributions are shown in Fig. 7d. At low concentration, the water tilt angle distribution is very similar to that reported by, for example, Spångberg and Hermansson,56 who used an effective three-body potential for Na+(aq). Similarly to the individual ∠Na–Owater–H angles, the tilt angle distribution becomes broader and shifts towards smaller angles as xNaOH increases. There is a significant increase in the probability density around 80–100°, meaning that it becomes more likely to find OH2 molecules that are perpendicular to the Na–O bond.
Here, we instead focus on interligand HBs, i.e., HBs between two ligands (OH2 or OH−) around the same central ion (Na+). Fig. 8a shows the average number of accepted interligand HBs for both H2O and OH−, for different xNaOH. The aqua ligands only rarely accept HBs from another ligand on the same complex, whereas the hydroxido ligands quite often do. At xNaOH = 0.008, OH− on average accept 0.33 interligand HBs, and this number increases with increasing concentration to become about 0.55 in the range xNaOH = 0.12–0.33. Thus, the OH− ligand becomes a better interligand HB acceptor at higher concentrations.
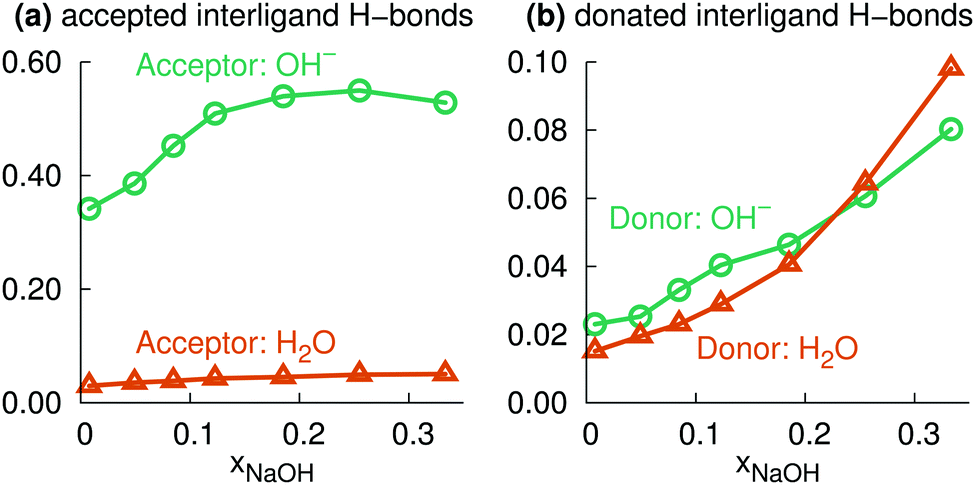 | ||
| Fig. 8 Average number of (a) accepted, and (b) donated, interligand hydrogen bonds for OH− and OH2 ligands. For OH2, the average number of donated hydrogen bonds is calculated per H atom (i.e., not per OH2 molecule). | ||
The corresponding average interligand HB donor numbers are shown in Fig. 8b. Both the average donor numbers for OH− and H2O increase with increasing concentration, as a result of the greater number of OH− that are good interligand HB acceptors. At the highest concentration xNaOH = 0.333, 10% of the hydrogen atoms on aqua ligands donate interligand HBs. This means that approximately 20% of aqua ligands donate interligand HBs, which corresponds to about 0.8 aqua ligands per Na+, as the average number of aqua ligands at xNaOH = 0.333 is 4.1 (Fig. 6a).
The increased amount of interligand HBs with increasing concentration, that primarily H2O donate, is responsible for the growing peak at small angles (40–60°) in the ∠Na–Owater–H angular distribution function (Fig. 7b).
3.3 Coordination around Na+: polyhedra
Here, we further characterize the coordination environment around Na+ by means of assigning coordination polyhedra to the different coordination complexes. We show that there is a broad distribution of coordination polyhedra, that changes with concentration. The benefit of this analysis is that we can characterize particular features of the different polyhedra, such as their propensities for interligand hydrogen-bonding, their relative preferences for the inclusion of OH− ligands, or their ligand-sharing capabilities with neighboring coordination polyhedra. These properties turn out to depend on the shape and size of the coordination polyhedron.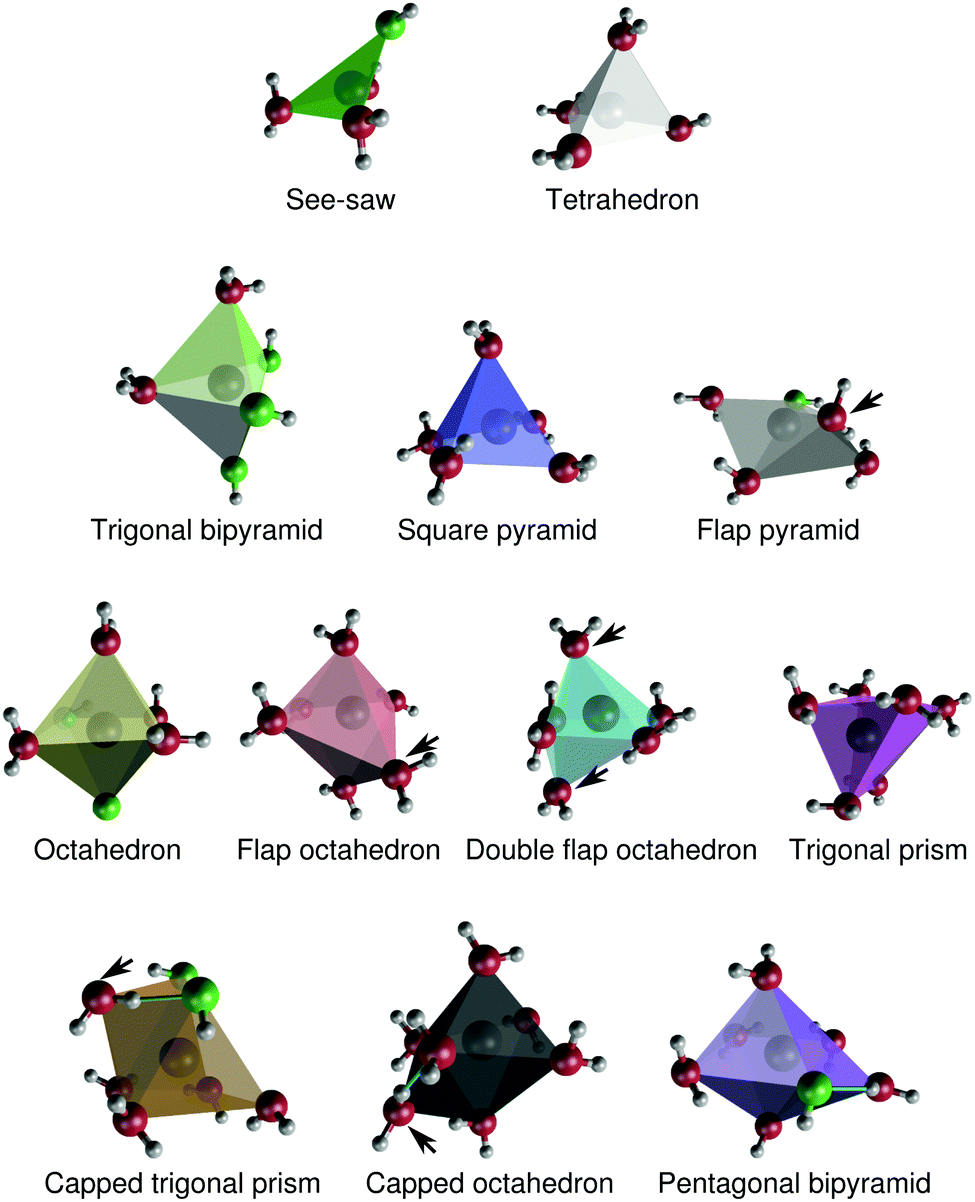 | ||
| Fig. 9 Structures of typical coordination polyhedra around Na+ in aqueous NaOH solutions. Hydroxide oxygens are green, and water oxygens are red. The arrows indicate ligands that are discussed in Section 3.3.1. For the capped trigonal prism and capped octahedron, the arrows indicate the “caps”. Interligand hydrogen bonds are drawn (turquoise) for the capped trigonal prism, capped octahedron, and pentagonal bipyramid. The Cartesian coordinates of these polyhedra are provided in the ESI.† | ||
The polyhedra in Fig. 9 differ in some respects to the coordination polyhedra around Na+ proposed by Clark and coworkers.52,53 Most notably, our simulations suggest that Na+ in practice does not adopt a “capped square pyramidal” configuration. The “double flap octahedron” polyhedron is reminiscent of a capped square pyramid, but the “cap” and the ”top” of the pyramid are then identical.
The polyhedron assignment was performed using Steinhardt order parameters, that depend only on the O–Na–O angles. The overall distribution of such angles for different xNaOH are shown in Fig. 10a. At xNaOH = 0.01, there are two main peaks at 90° and 170°, but with increasing concentration, the distribution flattens, and a small peak at 57° grows, similar to the behavior for the Na–O–H angles in Fig. 7b.
 | ||
| Fig. 10 Probability density functions for the O–Na–O angles, where the oxygens are coordinated to the same Na+, for (a) different mole fractions xNaOH, (b–e) different coordination polyhedra at xNaOH = 0.333. | ||
The angular distributions for the different polyhedra at xNaOH = 0.333 are shown in Fig. 10b–e, and agree very well with how one intuitively might draw the distributions of these angles. The angles in the tetrahedral complexes are centered around 109°, whilst the see-saw complexes have very broad angular distributions. For CN = 5, the trigonal-bipyramidal structures have the expected features of a large peak at 90°, a shoulder at 120°, and a smaller peak at 165°. The square-pyramidal structure also has a large peak at 90°, but a broader distribution between 100–180°. In the flap square-pyramidal structure, the “flap” shifts both two major peaks toward smaller angles. For CN = 6, the double flap octahedron has a very broad angular distribution, and at CN = 7, the capped octahedron has a very similar angular distribution as the octahedron, except for the major peak at 57° arising from the “cap”.
The overall quite broad distributions of the O–Na–O angles show that the coordination polyhedra around Na+ frequently deviate from the ideal polyhedra structures, as a result of the relatively weak Na–O bonds, and weak ligand–ligand repulsion. The H2O and OH− ligands adapt their positions to the surrounding environment, and can also break and form hydrogen bonds between themselves. Although we can assign most of the Na+ complexes to distinct polyhedra, the structures in Fig. 9 (or idealized versions of them) do not necessarily correspond to local minima on the free-energy surface. Because of the rather flat free-energy surface, the complexes will frequently adopt shapes not located at the free-energy minima.
 | ||
| Fig. 11 The average number of accepted interligand hydrogen bonds per ligand, that can be either OH− or OH2, for different coordination polyhedra as a function of mole fraction xNaOH. | ||
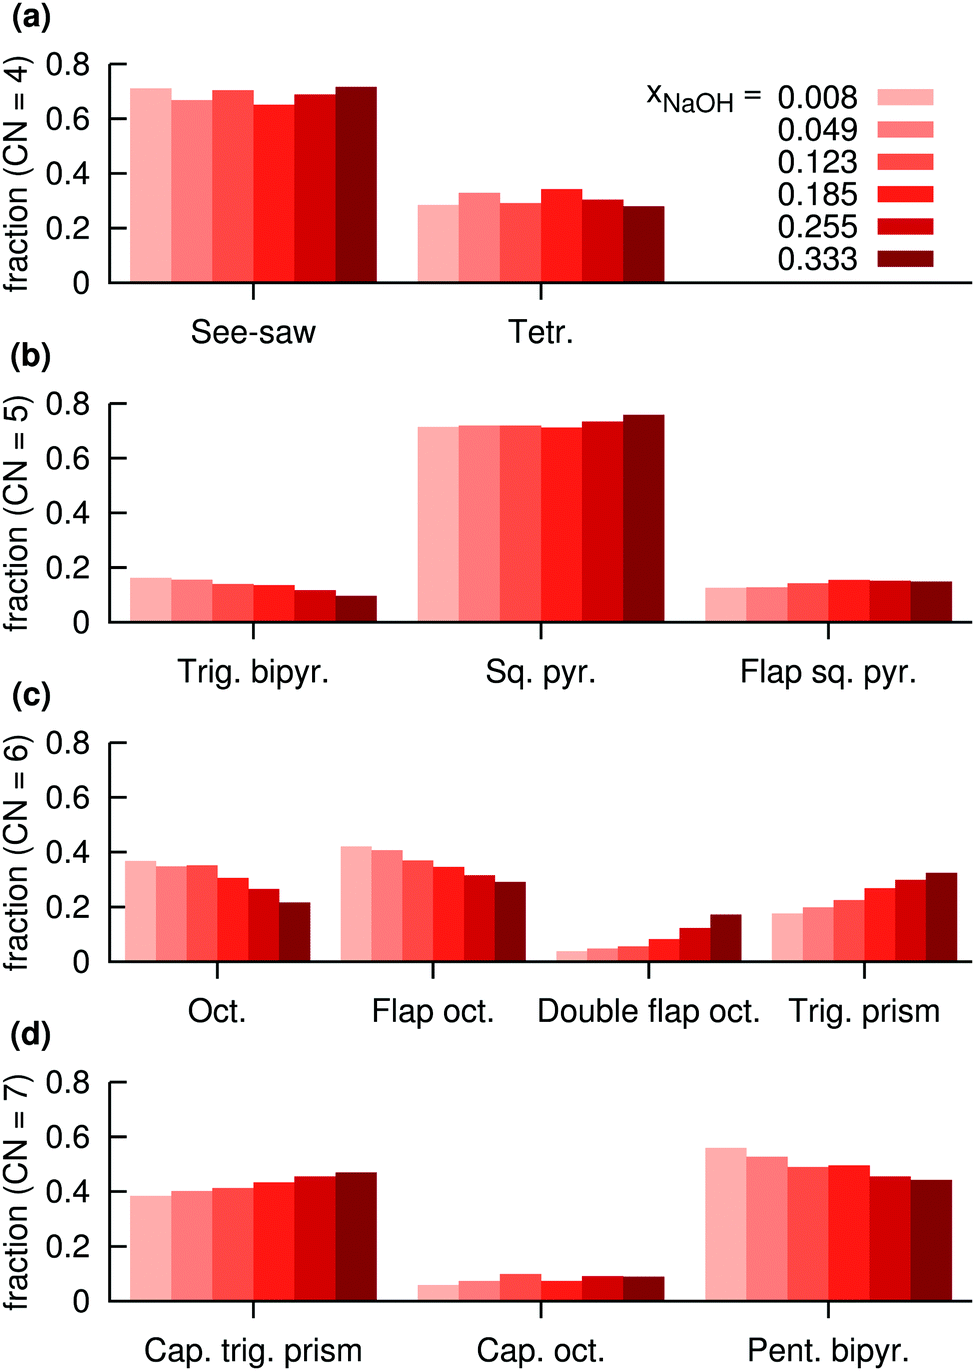 | ||
| Fig. 12 Distributions of assigned coordination polyhedra around Na+ in NaOH solutions for polyhedra with (a) 4 atoms, (b) 5 atoms, (c) 6 atoms, (d) 7 atoms, at different mole fractions xNaOH. | ||
For CN = 6, more dramatic changes happen as a function of the concentration. At low concentration, the octahedral and flap-octahedral structures dominate, but as the concentration increases the fraction of the double flap octahedron and trigonal-prism structures significantly increase. At CN = 7, the capped trigonal prism and pentagonal bipyramids are about equally frequent, with only a small (∼10%) contribution from the capped octahedron. With increasing concentration, the capped trigonal prism becomes more favored, and the pentagonal bipyramid slightly less favored.
Fig. 12 clearly shows that some polyhedra are favored over others, even for CN = 6 and CN = 7 where the O–Na–O angular distributions (Fig. 10d and e) are quite broad and largely similar between the different polyhedra. Thus, the stabilities of the different polyhedra are not solely determined by the O–Na–O angular distributions, but are likely to also depend on the Na–O radial distributions, as well as the individual coordination polyhedron's effect on the surrounding solvent.
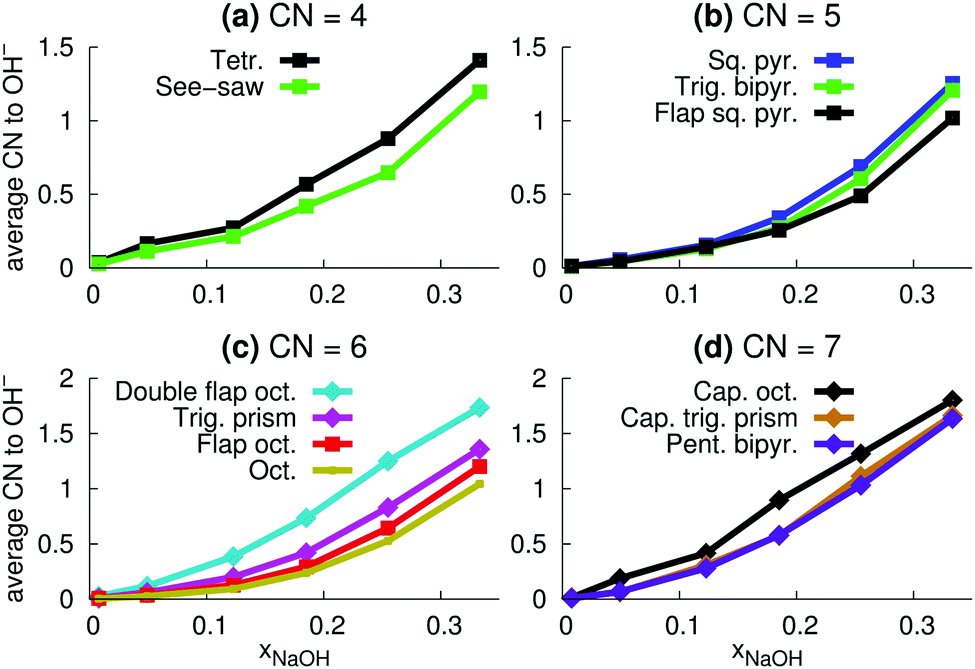 | ||
| Fig. 13 Average number OH− ions in the different coordination polyhedra (Fig. 9) as a function of mole fraction mole fraction xNaOH. | ||
The relative number of OH− ligands for different polyhedra for CN = 6 and CN = 7 (Fig. 13c and d) are similar to the relative number of accepted interligand HBs (Fig. 11c and d), consistent with the fact that OH− ligands are good HB acceptors (Fig. 8a). However, for CN = 4 and CN = 5, the specific coordination geometry plays a greater role for the number of accepted interligand HBs. For example, although tetrahedra are more likely to contain OH− ions (Fig. 13a), see-saw ligands are more likely to accept interligand HBs (Fig. 11a). Similarly, although square pyramids and trigonal bipyramids are almost equally likely to contain OH− ligands (Fig. 13b), ligands of square pyramids are much more likely to accept interligand HBs (Fig. 11b). There are thus variations in the extent of interligand HBs between the different polyhedra, that cannot be explained by their propensities to include the good HB acceptor OH−.
 | ||
| Fig. 14 Snapshot of coordination polyhedra (with colors as in Fig. 9) at xNaOH = 0.333. | ||
Fig. 15 shows the fractional distribution for how many neighboring coordination polyhedra around a given Na+ that are corner-sharing, edge-sharing, or face-sharing. Here, more than 11 million polyhedra were obtained from molecular dynamics snapshots and used for the analysis. On average, 62% of neighboring polyhedra are corner-sharing, 33% are edge-sharing, and 5% are face-sharing. The greater fraction of corner-sharing polyhedra can be explained partly by the fact that a corner-sharing neighboring polyhedron only occupies one of the ligand positions, leaving the other ligands available for sharing with other polyhedra, and partly because corner-sharing results in greater distances between the two central ions as compared to the edge-sharing or face-sharing.
 | ||
| Fig. 15 Distributions of corner-sharing, edge-sharing, and face-sharing polyhedron neighbors (histogram, blue, left axis), and average number of shared ligands per neighboring polyhedron (black lines and points, right axis), at xNaOH = 0.333. | ||
Fig. 15 also shows the distributions of corner-sharing, edge-sharing, and face-sharing neighbors for the different types of coordination polyhedra. Face-sharing is, as one could intuitively expect, the most common for polyhedra with a large number of ligands (CN = 6 or 7). However, Fig. 15 also reveals some telling difference between different polyhedra with a given CN. For example: edge-sharing is more likely for see-saw than for tetrahedra; trigonal bipyramids have virtually no face-sharing neighbors, while 4% of the neighbors to flap square pyramids are face-shared; for CN = 6, octahedra are the by far most likely to be face-sharing with a neighbor, and double flap octahedra the least likely.
Finally, we investigate if there are “preferred” polyhedron connections between specific kinds of polyhedra. To this end, we define the “preference” ξC(P) of a central polyhedron C to a neighboring polyhedron of type P as
 | (20) |
Fig. 16 shows the relative preference ξC(P) for all combinations of central polyhedra C and neighboring polyhedra P at xNaOH = 0.333. The see-saw has a greater preference than the tetrahedron for neighboring polyhedra with large number of ligands, in line with the fact that the see-saw favors edge-sharing (as opposed to corner-sharing) to a greater extent than the tetrahedron (Fig. 15). Both the see-saw and the tetrahedron have the greatest relative preference for neighboring tetrahedra, trigonal bipyramids, double flap octahedra, and capped octahedra for neighbors with 4, 5, 6, and 7 ligands, respectively. Those kinds of neighbors all have the lowest average number of shared ligands per neighbor (black line in Fig. 15) for their respective sizes, and thus are a good match for the four-coordinate see-saw and tetrahedra that greatly prefer corner-sharing (Fig. 15).
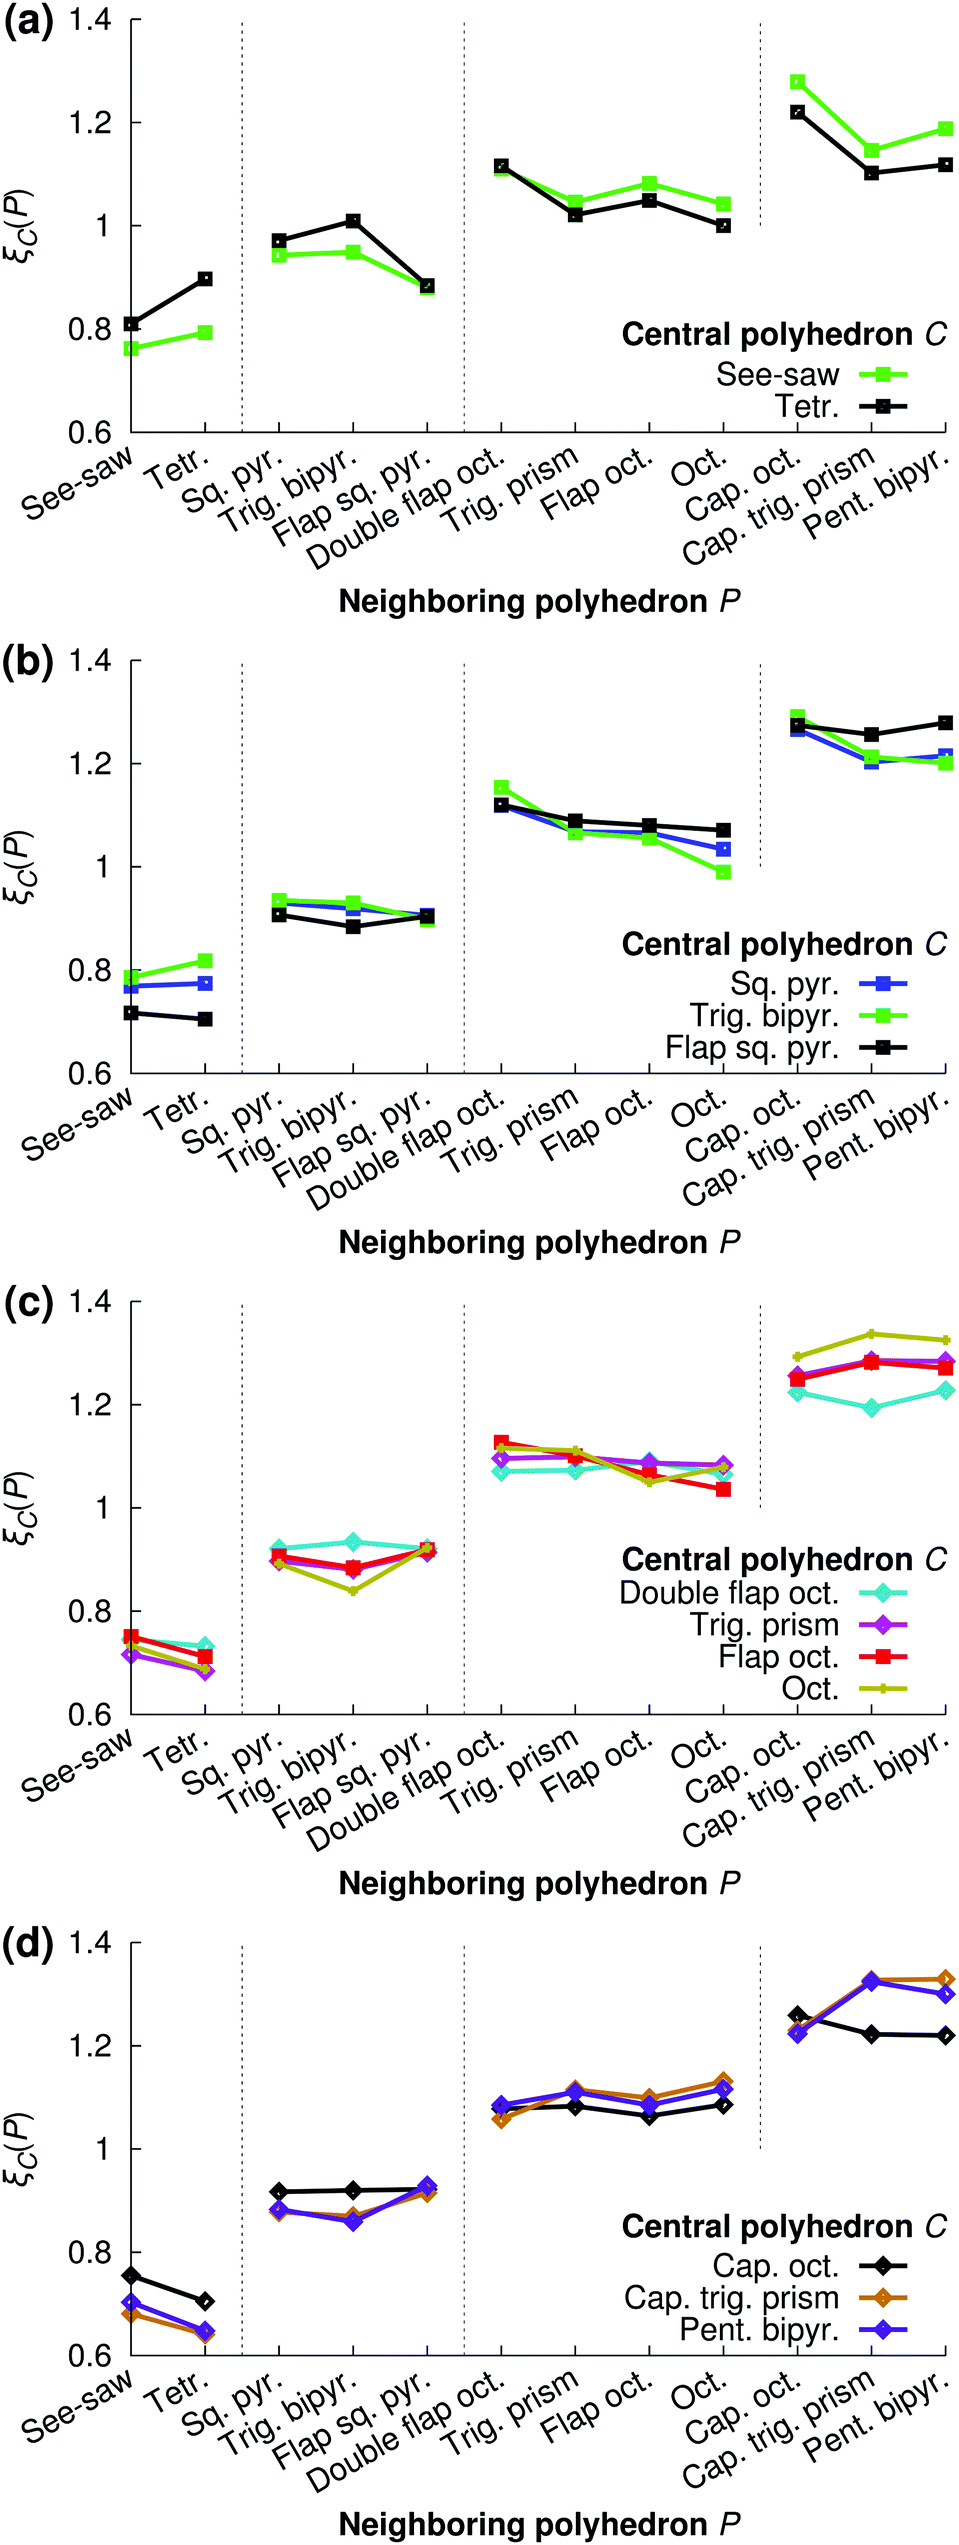 | ||
| Fig. 16 Relative preferences ξC(P) (eqn (20)) for central polyhedra C to neighboring polyhedra P at xNaOH = 0.333. | ||
Such a “like-likes-like” relationship is also evident for central polyhedra with greater number of ligands. To simplify the discussion, we introduce the terms “face-share-seeking” and “face-share-avoiding”, as a qualitative measure of the number of face-sharing neighbors (dark blue bar in Fig. 15) for a given number of ligands. For example, the trigonal bipyramid (face-share-avoiding) has a greater preference for double flap octahedra (face-share-avoiding) than for octahedra (face-share-seeking). The octahedron (face-share-seeking) has the greatest relative preference for the capped trigonal prism (face-share-seeking), while the double flap octahedron (face-share-avoiding) has greater preferences for capped octahedra or the pentagonal bipyramid (both face-share-avoiding).
Here, the polyhedron connectivity analysis was performed at xNaOH = 0.333, and the results in Fig. 15 and 16 refer only to this mole fraction. At lower concentrations, the relative preferences between different kinds of polyhedra could be different from those in Fig. 16, because of the different populations of the different polyhedra (Fig. 12), as well as the different number of OH− ligands (Fig. 13).
In summary, in saturated NaOH solutions at xNaOH = 0.333, different coordination polyhedra have different propensities to participate in corner-sharing, edge-sharing, or face-sharing connections to other polyhedra. Polyhedra that participate in significant amounts of face-sharing (e.g. flap square pyramids, octahedra, and capped trigonal prisms) are more likely to neighbor each other than polyhedra with very different propensities toward face-sharing. Similarly, polyhedra with significant preferences toward corner-sharing (e.g. tetrahedra and trigonal bipyramids) are more likely to be neighbors.
4 Conclusions
We used a high-dimensional neural network potential that allows for molecular dynamics simulations of NaOH(aq) solutions over the entire room-temperature solubility range with first-principles accuracy. The resulting structures are in good agreement with data from previous X-ray and neutron diffraction experiments.8,9 With increasing concentration, direct-contact Na+–OH− ion pairs start to form, and the OH− increasingly orient themselves either “parallel” or “perpendicular” to the Na+–OH− bond. The formation of direct-contact ion pairs increases the extent of interligand hydrogen bonding, i.e. hydrogen bonds that (primarily) aqua ligands donate to (primarily) hydroxido ligands around the same central Na+. Such interligand hydrogen bonds are mostly formed for complexes with 6 or 7 ligands. The structural environment around Na+ varies with increasing concentration, both with respect to the number of aqua and hydroxido ligands, and with respect to the shape of the coordination polyhedron. We used a scheme based on Steinhardt order parameters30 to automatically identify twelve different coordination polyhedra with 4–7 ligands (Fig. 9), and we found that Na+–OH− ion pairs were particularly favored for the tetrahedral and double flap octahedron coordination geometries. Finally, we performed a detailed polyhedron connectivity analysis at the solubility limit (the mole fraction xNaOH = 0.333), that revealed that different polyhedra preferentially share ligands with different kinds of polyhedron neighbors.This work also showcases novel methods for obtaining structural insights into ionic solutions. Specifically, it illustrates how high-dimensional neural network potentials can be used to obtain atomistic details of the structure of concentrated electrolytes – even for “reactive” electrolytes such as NaOH(aq) where frequent proton-transfer events take place – and how Steinhardt order parameters can be used to automatically classify the coordination environment around a cation in aqueous solution.
Acknowledgements
This work was supported by the Cluster of Excellence RESOLV (EXC 1069) funded by the Deutsche Forschungsgemeinschaft, and the DFG Heisenberg fellowship Be3264/6-1.References
- T. O'Brien, T. Bommaraju and F. Hine, Handbook of Chlor-Alkali Technology: Volume I: Fundamentals, Springer, New York, 2007 Search PubMed.
- A. R. Hind, S. K. Bhargava and S. C. Grocott, Colloids Surf., A, 1999, 146, 359–374 CrossRef CAS.
- J. Joo, J. Kim, J. W. Kim, J. D. Ocon, J. K. Lee, W. Chang and J. Lee, Sep. Purif. Technol., 2015, 145, 24–28 CrossRef CAS.
- H. Y. Zhu, Y. Lan, X. P. Gao, S. P. Ringer, Z. F. Zheng, D. Y. Song and J. C. Zhao, J. Am. Chem. Soc., 2005, 127, 6730–6736 CrossRef CAS PubMed.
- F. W. Küster and A. Thiel, Rechentafeln für die Chemische Analytik, Walter de Gruyter, Berlin, 105th edn, 2003 Search PubMed.
- J. Mähler and I. Persson, Inorg. Chem., 2012, 51, 425–438 CrossRef PubMed.
- M. E. Tuckerman, D. Marx and M. Parrinello, Nature, 2002, 417, 925–929 CrossRef CAS PubMed.
- A. Botti, F. Bruni, S. Imberti, M. A. Ricci and A. K. Soper, J. Chem. Phys., 2004, 120, 10154–10162 CrossRef CAS PubMed.
- T. Megyes, S. Bálint, T. Grósz, T. Radnai, I. Bakó and P. Sipos, J. Chem. Phys., 2008, 128, 044501 CrossRef PubMed.
- F. Bruni, M. A. Ricci and A. K. Soper, J. Chem. Phys., 2001, 114, 8056–8063 CrossRef CAS.
- S. Imberti, A. Botti, F. Bruni, G. Cappa, M. A. Ricci and A. K. Soper, J. Chem. Phys., 2005, 122, 194509 CrossRef CAS PubMed.
- D. Marx, A. Chandra and M. E. Tuckerman, Chem. Rev., 2010, 110, 2174–2216 CrossRef CAS PubMed.
- N. Agmon, H. J. Bakker, R. K. Campen, R. H. Henchman, P. Pohl, S. Roke, M. Thämer and A. Hassanali, Chem. Rev., 2016, 116, 7642–7672 CrossRef CAS PubMed.
- I. S. Ufimtsev, A. G. Kalinichev, T. J. Martinez and R. James Kirkpatrick, Phys. Chem. Chem. Phys., 2009, 11, 9420–9430 RSC.
- C. D. Wick and L. X. Dang, J. Chem. Phys., 2010, 133, 024705 CrossRef PubMed.
- S. T. Roberts, A. Mandal and A. Tokmakoff, J. Phys. Chem. B, 2014, 118, 8062–8069 CrossRef CAS PubMed.
- C. Chen, Y.-L. S. Tse, G. E. Lindberg, C. Knight and G. A. Voth, J. Am. Chem. Soc., 2016, 138, 991–1000 CrossRef CAS PubMed.
- W. Zhang and A. C. T. van Duin, J. Phys. Chem. C, 2015, 119, 27727–27736 CAS.
- B. Chen, J. M. Park, I. Ivanov, G. Tabacchi, M. L. Klein and M. Parrinello, J. Am. Chem. Soc., 2002, 124, 8534–8535 CrossRef CAS PubMed.
- B. Chen, I. Ivanov, J. M. Park, M. Parrinello and M. L. Klein, J. Phys. Chem. B, 2002, 106, 12006–12016 CrossRef CAS.
- A. Chandra, M. E. Tuckerman and D. Marx, Phys. Rev. Lett., 2007, 99, 145901 CrossRef PubMed.
- M. Hellström and J. Behler, J. Phys. Chem. Lett., 2016, 7, 3302–3306 CrossRef PubMed.
- J. Behler and M. Parrinello, Phys. Rev. Lett., 2007, 98, 146401 CrossRef PubMed.
- J. Behler, J. Chem. Phys., 2011, 134, 074106 CrossRef PubMed.
- J. Behler, J. Phys.: Condens. Matter, 2014, 26, 183001 CrossRef CAS PubMed.
- J. Behler, R. Martoňák, D. Donadio and M. Parrinello, Phys. Rev. Lett., 2008, 100, 185501 CrossRef PubMed.
- G. C. Sosso, G. Miceli, S. Caravati, F. Giberti, J. Behler and M. Bernasconi, J. Phys. Chem. Lett., 2013, 4, 4241–4246 CrossRef CAS PubMed.
- N. Artrith and A. M. Kolpak, Nano Lett., 2014, 14, 2670–2676 CrossRef CAS PubMed.
- T. Morawietz, A. Singraber, C. Dellago and J. Behler, Proc. Natl. Acad. Sci. U. S. A., 2016, 113, 8368–8373 CrossRef CAS PubMed.
- P. J. Steinhardt, D. R. Nelson and M. Ronchetti, Phys. Rev. B: Condens. Matter Mater. Phys., 1983, 28, 784–805 CrossRef CAS.
- J. Behler, Phys. Chem. Chem. Phys., 2011, 13, 17930–17955 RSC.
- B. Hammer, L. B. Hansen and J. K. Nørskov, Phys. Rev. B: Condens. Matter Mater. Phys., 1999, 59, 7413–7421 CrossRef.
- S. Grimme, J. Antony, S. Ehrlich and H. Krieg, J. Chem. Phys., 2010, 132, 154104 CrossRef PubMed.
- K. Forster-Tonigold and A. Groß, J. Chem. Phys., 2014, 141, 064501 CrossRef PubMed.
- S. Imoto, H. Forbert and D. Marx, Phys. Chem. Chem. Phys., 2015, 17, 24224–24237 RSC.
- M. J. Gillan, D. Alfè and A. Michaelides, J. Chem. Phys., 2016, 144, 130901 CrossRef PubMed.
- A. Bankura, V. Carnevale and M. L. Klein, Mol. Phys., 2014, 112, 1448–1456 CrossRef CAS.
- T. Ikeda and M. Boero, J. Chem. Phys., 2015, 143, 194510 CrossRef PubMed.
- J. Behler, Int. J. Quantum Chem., 2015, 115, 1032–1050 CrossRef CAS.
- S. Plimpton, J. Comput. Phys., 1995, 117, 1–19 CrossRef CAS.
- A. Singraber, T. Morawietz, J. Behler and C. Dellago, to be published.
- International Tables for Crystallography, ed. A. J. C. Wilson, Kluwer Academic Publishers, Dordrecht, 1995, vol. C Search PubMed.
- L. Fu, A. Bienenstock and S. Brennan, J. Chem. Phys., 2009, 131, 234702 CrossRef PubMed.
- J. M. Sorenson, G. Hura, R. M. Glaeser and T. Head-Gordon, J. Chem. Phys., 2000, 113, 9149–9161 CrossRef CAS.
- V. F. Sears, Neutron News, 1992, 3, 26–37 CrossRef.
- A. S. Keys, C. R. Iacovella and S. C. Glotzer, J. Comput. Phys., 2011, 230, 6438–6463 CrossRef CAS.
- P. Geiger and C. Dellago, J. Chem. Phys., 2013, 139, 164105 CrossRef PubMed.
- E. D. Cubuk, S. S. Schoenholz, J. M. Rieser, B. D. Malone, J. Rottler, D. J. Durian, E. Kaxiras and A. J. Liu, Phys. Rev. Lett., 2015, 114, 108001 CrossRef CAS PubMed.
- G. Ferré, J.-B. Maillet and G. Stoltz, J. Chem. Phys., 2015, 143, 104114 CrossRef PubMed.
- L. Zhu, M. Amsler, T. Fuhrer, B. Schaefer, S. Faraji, S. Rostami, S. A. Ghasemi, A. Sadeghi, M. Grauzinyte, C. Wolverton and S. Goedecker, J. Chem. Phys., 2016, 144, 034203 CrossRef PubMed.
- M. Hudelson, B. L. Mooney and A. E. Clark, J. Math. Chem., 2012, 50, 2342–2350 CrossRef CAS.
- B. L. Mooney, L. R. Corrales and A. E. Clark, J. Phys. Chem. B, 2012, 116, 4263–4275 CrossRef CAS PubMed.
- M. Kelley, A. Donley, S. Clark and A. Clark, J. Phys. Chem. B, 2015, 119, 15652–15661 CrossRef CAS PubMed.
- H. Terrones and A. L. Mackay, J. Math. Chem., 1994, 15, 157–181 CrossRef CAS.
- E. G. Teich, G. van Anders, D. Klotsa, J. Dshemuchadse and S. C. Glotzer, Proc. Natl. Acad. Sci. U. S. A., 2016, 113, E669–E678 CrossRef CAS PubMed.
- D. Spångberg and K. Hermansson, J. Chem. Phys., 2004, 120, 4829–4843 CrossRef PubMed.
- A. Luzar and D. Chandler, Phys. Rev. Lett., 1996, 76, 928–931 CrossRef CAS PubMed.
Footnote |
| † Electronic supplementary information (ESI) available: Cartesian coordinates of typical coordination polyhedra around Na+, and detailed description of the high-dimensional neural network potential for NaOH(aq). See DOI: 10.1039/c6cp06547c |
| This journal is © the Owner Societies 2017 |