 Open Access Article
Creative Commons Attribution 3.0 Unported Licence
A density functional theory study of the carbon-coating effects on lithium iron borate battery electrodes†
Simon
Loftager
,
Juan María
García-Lastra
and
Tejs
Vegge
 *
*
Department of Energy Conversion and Storage, Technical University of Denmark, Fysikvej, 2800 Kgs. Lyngby, Denmark. E-mail: teve@dtu.dk
First published on 8th December 2016
Abstract
Lithium iron borate (LiFeBO3) is a promising cathode material due to its high theoretical specific capacity, inexpensive components and small volume change during operation. Yet, challenges related to severe air- and moisture-induced degradation have prompted the utilization of a protective coating on the electrode which also improves the electronic conductivity. However, not much is known about the preferential geometries of the coating as well as how these coating–electrode interfaces influence the lithium diffusion between the coating and the electrode. Here, we therefore present a density functional theory (DFT) study of the anchoring configurations of carbon coating on the LiFeBO3 electrode and its implications on the interfacial lithium diffusion. Due to large barriers associated with Li-ion diffusion through a parallel-oriented pristine graphene coating on the FeBO3 and LiFeBO3 electrode surfaces, large structural defects in the graphene coating are required for fast Li-ion diffusion. However, such defects are expected to exist only in small concentrations due to their high formation energies. Alternative coating geometries were therefore investigated, and the configuration in which the coating layers were anchored normal to the electrode surface at B and O atoms was found to be most stable. Nudged elastic band (NEB) calculations of the lithium diffusion barriers across the interface between the optimally oriented coating layers and the electrode show no kinetic limitations for lithium extraction and insertion. Additionally, this graphite-coating configuration showed partial blocking of electrode-degrading species.
1. Introduction
Today's society is in urgent need of improved media for energy storage that can be used in portable electrics, electric vehicles and large-scale grid-based storage systems of renewable energy. In particular, batteries hold great potential as alternatives to limited and CO2-emitting fossil fuels for vehicular propulsion.Despite being a high-capacity cathode material displaying excellent cyclability, LiNi1/3Mn1/3Co1/3O2 (NMC) is restricted by the toxicity and high cost of Co. Alternative cathode materials include the interesting Li2VO2F compound showing excellent rate capability and high specific capacity,1 though currently limited by high price, and the transition-metal olivine-structured compound, LiFePO4, attracting interest due to its earth-abundant, environmentally benign elements, but is yet impeded by poor rate capability stemming from a low ionic and electronic conductivity,2 which has so far only been improved by decreasing the LiFePO4 particle size, and decreasing the volumetric energy density.
In recent years, lithium iron borate (LiFeBO3) has received increasing interest due to its low-cost constituents, a relatively high specific capacity of 220 mA h g−1 and the very small volume change during operation of about 2%,3 which lowers the risk of losing contact with the other battery components. However, pristine LiFeBO3 compounds are prone to oxidation from ambient air and moisture, and studies by Yamada et al.3 and Bo et al.4,5 have clarified the detrimental effects of air oxidation on LiFeBO3 electrodes, which were shown to involve the displacement of Fe onto the Li sites as Li was leached out of the active LiFeBO3 material.4 Coating the LiFeBO3 electrode with a carbonaceous species has therefore become instrumental in protecting the electrode from oxidation and thereby improving the electrochemical performance of the material.
There exist numerous experimental studies which report on the beneficial properties endowed by carbon-coating the electrode material. Both hexagonal and monoclinic LiMnBO3 have been shown to benefit from being carbon-coated, showing a reduction in polarization and a correspondingly large increase in the reversible capacity from 65 mA h g−1 to 100 mA h g−1 at C/20.6 LiFePO4 has also been shown to have its rate capability and reversible capacity greatly improved by carbon-coating the electrode,7–9 and a study by Zhou et al.10 in which LiFePO4 electrode particles were homogeneously and loosely wrapped with a graphene three-dimensional network suggested that this was attributed to smaller particle sizes, improved electronic conductivity due to higher graphitization and to an extended three-dimensional network graphene wrapping in which the voids between the graphene layers and the electrode easily enabled the diffusion of Li ions between the LiFePO4 crystal and the electrolyte.
In this computational study, the protective coating on the active LiFeBO3 electrode surface is modeled as carbon-coating layers on the LiFeBO3 electrode surface. The optimal anchoring was found to be that in which the coating-edge C atoms bond to electrode-surface B and O atoms and the coating layers are normal to the electrode surface. The analysis is combined with an assessment of the rate of lithium transport through different possible configurations of the carbon coatings, indicating no kinetic limitations to Li (de)insertion of the electrode across the optimal coating–electrode interface.
2. Computational details
2.1. The crystal structure of LiFeBO3
LiFeBO3 has a monoclinic crystal system in which FeO5 complexes link together at the edges forming chains along the [−101] direction, and chains of LiO4 complexes run along the [001] direction. Boron and oxygen atoms form trigonal groups which connect the edge-sharing FeO5 chains. The crystal structure of LiFeBO3 is shown in Fig. 1. A commensurate modulation of LiFeBO3 has been experimentally observed by Janssen et al.11 which induces a minor displacement of the Li ions out of their trigonal bipyramidal planes resulting in an almost regular tetrahedral coordination of the Li ions to the neighboring O ions. This effectively doubles the unit cell of LiFeBO3 and alters the crystal symmetry from C2/c to C2/c(α0γ)00 with α = 1/2 and γ = 0. However, previous DFT studies12 have shown that the effect of this structural modulation has no influence on the activation barriers of Li ions and vacancies, and the modulation is therefore not included in the present study.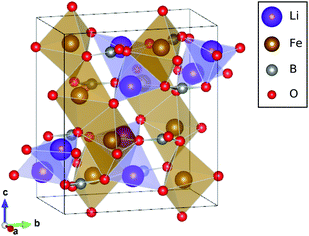 | ||
| Fig. 1 Unit cell of LiFeBO3 with Fe atoms in the center of the brown edge-sharing FeO5 complexes forming chains along the [−101] direction and Li atoms in purple LiO4 complexes forming chains in the [001] direction. Images were generated using the VESTA software package.13 | ||
The LiFeBO3 structure was optimized starting from the experimental lattice constants reported by Janssen et al.,11a = 5.1350 Å, b = 9.0437 Å, c = 10.2907 Å and β = 91.031°. As Li ions are extracted from LiFeBO3 during charge, the Fe2+ ions are oxidized to Fe3+. The Fe ions were consistently found to be in their high-spin state having their five 3d orbitals occupied. Hence, Fe in LiFeBO3 is Fe2+ having a magnetic moment of 4 μB and Fe in FeBO3 is Fe3+ having a magnetic moment of 5 μB.
2.2. Computational methods
In this study, input structures were built and analyzed using the Atomic Simulation Environment (ASE) package14 and structurally relaxed to their equilibrium structure by solving the electronic-structure problem within DFT. The DFT implementation in Vienna Ab initio Simulation Package (VASP)15 was used with plane waves being expanded up to a kinetic-energy cutoff of 500 eV. The projector-augmented-wave (PAW) method16 was used to model the atomic cores, and in the PAW potentials, for Li, B and O the 1s electrons were treated as core electrons, and for Fe the 1s, 2s, 2p, 3s and 3p electron shells were treated as core electrons. The exchange and correlation effects were modeled within the generalized-gradient approximation (GGA) by the Perdew–Burke–Ernzerhof (PBE) parametrization.17 The partial occupations were determined using the tetrahedron method with Blöchl corrections, and the electronic levels were smeared by 0.05 eV.Due to the incomplete cancellation of the electron self-interaction (SI) error inherent in the GGA, calculated properties, such as the band gap, can deviate significantly from experimental values,18,19 stemming from the SI-induced delocalization of the electrons within this model, especially for systems having strongly localized d-orbital electrons, such as LiFeBO3. Previous studies have efficiently rectified the SI error in the GGA by employing the Hubbard-U correction scheme20 and following the work by Seo et al.,21 a Hubbard U of 4.3 eV in the rotationally invariant scheme from the study of Dudarev et al.22 was applied on the 3d orbitals of Fe in FeBO3 and LiFeBO3. To correctly model the van der Waals (vdW) interaction between the graphene layers, a vdW-based functional should in principle be employed. Only a few previous studies9,23 have combined Hubbard corrections with a vdW functional, however, it is not yet a well-established, widely used approach to employ such vdW+U functionals. Generally, the error introduced by having a slightly incorrect coating-layer separation is not expected to be significant. For instance, by stretching graphite along the layer stacking (c) direction and changing the experimentally observed layer separation from 3.39 Å to 4.94 Å (corresponding to half of the b lattice parameter for FeBO3 used later in this study as the coating-layer separation), the energy of the system per C atom only changed by 9.6 meV. Likewise, the interaction between the parallel graphene coating and the FeBO3/LiFeBO3 electrodes (see Fig. 2) is expected to be small, as the coating–electrode separation is large: a fit to the shifted total energies in Fig. S1(a) (ESI†) calculated using the BEEF-vdW functional24 with the Hubbard-U correction (on the Fe:3d orbitals) shows that the optimal coating–FeBO3/LiFeBO3 separation is 3.7 Å. This is only slightly smaller than that predicted by the PBE+U functional when the coating–electrode interactions become negligible at about 4.0 Å as seen in Fig. S1(b) (ESI†). However, as previously stated the combination of a vdW functional and Hubbard corrections has not been thoroughly tested yet, and we have therefore adhered to the widely deployed PBE+U functional.
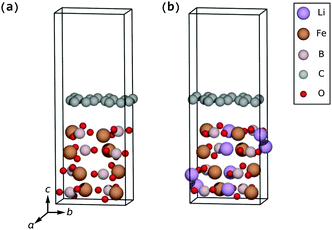 | ||
| Fig. 2 Parallel-oriented coating geometry on the fully delithiated electrode (a) and the fully lithiated electrode (b). | ||
The unit cell and internal coordinates of FeBO3 and LiFeBO3 were fully relaxed to their equilibrium geometry such that the forces on the atoms did not exceed 0.05 eV Å−1 using the Fast Inertial Relaxation Engine (FIRE) minimization algorithm25 and the Brillouin zone was sampled using a Monkhorst–Pack (MP) mesh of 4 × 2 × 2. The simulation cell used in the subsequent relaxation of the coating–electrode structures was inherited from the unit-cell dimensions of FeBO3 and LiFeBO3 for Li-ion and Li-vacancy calculations, respectively, with vacuum added in the c-direction so as to form a (001) surface of the FeBO3/LiFeBO3 electrodes and the two bottommost electrode layers were kept spatially fixed. For such supercells, an MP mesh of 4 × 2 × 1 was used. In calculations simulating Li insertion or Li-vacancy formation, the aforementioned supercells were doubled in the a-direction and a 2 × 2× 1 MP mesh was used. The two bottom layers of the coated electrodes were fixed. For all structure relaxations, the self-consistent solution to the Kohn–Sham equation was performed with an accuracy of 0.1 meV.
For the determination of the activation barriers of the Li-ion diffusion across the coating–electrode interface, the nudged elastic band (NEB) method26 implemented in ASE was utilized with a total number of seven images. The initial Li-ion pathway was created by linearly interpolating between the initial and final images. The energies were calculated using VASP, and the forces were let to relax to the same threshold value as for the structure relaxations (0.05 eV Å−1) using the FIRE algorithm.
3. Results and discussion
3.1. DFT-optimized lattice of bulk LiFeBO3 and FeBO3
Upon relaxation of all internal degrees of freedom, the lattice parameters for the LiFeBO3 unit cell were found to be a = 5.168 Å, b = 9.109 Å, c = 10.349 Å and β = 91.28° in good agreement with experimental values11 (see above). The lattice parameters of the FeBO3 unit cell were found to be a = 5.308 Å, b = 8.989 Å, c = 10.188 Å and β = 89.40° giving rise to a volume contraction upon fully delithiating LiFeBO3 to FeBO3 of 0.2%.3.2. Parallel-oriented coating on FeBO3/LiFeBO3 electrodes
Graphene sheets oriented parallel to metal surfaces have previously been found to bind via chemisorption or physisorption depending on the substrate9,27 and we have therefore investigated the effects of arranging the graphene sheet parallel to the surfaces of the FeBO3 and LiFeBO3 electrodes.In order to determine the most stable low-index surface of the LiFeBO3 electrode, the surface energies, listed in Table 1, were calculated for the lowest-index surfaces, i.e. the (100), (010) and (001) LiFeBO3 surfaces. It is seen that the (001) surface is approximately three times more stable (15 meV Å−2) as the other two surfaces (41 and 47 meV Å−2). The surfaces are shown in Fig. S2 (ESI†). It is therefore expected that the (001) surface will be the most dominant surface involved in the formation of external interfaces.
| Surface | Surface energy [meV Å−2] |
|---|---|
| (100) | 41 |
| (010) | 47 |
| (001) | 15 |
The surfaces of some oxide materials,28,29 such as LiNixMnxCo1−xO2 and Li2MnO3, are known to display reconstruction. However, in this study no indications of such surface reconstruction were observed for the FeBO3 or LiFeBO3 electrodes. Yet, it should be noted that surface reconstruction often exists over large areas which could not be captured by our relatively small simulation cells.
The (001) surface of the FeBO3 electrode can be covered by a pure graphene sheet with an expansive strain on graphene of only 7.5% along the a-axis and 5.1% along the b-axis with a resulting strain energy of 239 meV per C atom, and the (001) surface of the LiFeBO3 electrode can be covered by a pure graphene sheet with an expansive strain of only 4.7% along the a-axis and 6.5% along the b-axis with a resulting strain energy of 192 meV per C. However, due to the large separation between the parallel-oriented graphene coating and the FeBO3/LiFeBO3 surfaces of 4.0 Å (3.7 Å if vdW effects are taken into account; see S1 in the ESI†), as seen in Fig. 2, the interaction between the coating and the electrodes is found to be very small. Therefore, the two subsystems will be treated separately for the case of having the graphene coating parallel to the (001) electrode surface.
The surface lithiation/delithiation processes can therefore to a first approximation be analyzed by studying the surface electrodes shown in Fig. 3.
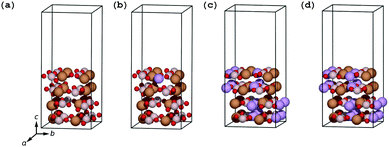 | ||
| Fig. 3 LixFeBO3 electrodes with exposed (001) surfaces: (a) the fully delithiated (charged) phase. (b) The delithiated phase at initial stage of discharge, containing only one Li ion. (c) The lithiated phase at final stage of discharge, containing only one Li vacancy. (d) The fully lithiated (discharged) phase. The coloring of the atoms follows that of Fig. 2. | ||
As listed in Table 2, for the bulk electrode the insertion energy is 3.26 eV and the vacancy-formation energy is 2.90 eV versus Li(s) with the bulk equilibrium voltage being 3.08 V versus Li(s). The presence of the (001) surfaces shown in Fig. 3 makes it more favorable for the Li ions to be inserted in the outermost layer of the electrode as the insertion energy is 3.47 eV and the vacancy-formation energy is 3.22 eV, i.e. higher than those for the bulk electrode. In a calculation, a Li ion initially 3 Å above the LiFeBO3 electrode surface was seen to absorb into the surface layer of the electrode with no kinetic barriers to overcome. The energy gain (3.47 eV) of this process is much larger than the Li adsorption energy on pristine graphene, 1.7 eV as shown in Fig. S3 (ESI†), suggesting that a Li ion adsorbed on the graphene coating on the electrode side would presumably have a negligible kinetic barrier toward insertion of the Li ion into the electrode surface layer. On the other hand, it is well known that the diffusion barrier of the Li ion through pristine graphene is very high,30 warranting further investigations into the effect of the graphene defects on the Li diffusion through the coating.
| Insertion energy [eV] | Vacancy-formation energy [eV] | Equilibrium potential [V] | |
|---|---|---|---|
| Bulk | 3.26 | 2.90 | 3.08 |
| Surface | 3.47 | 3.22 |
Li transport through the hollow site of pristine graphene, through graphene with a monovacancy and through graphene with a 5-8-5 divacancy was investigated using the NEB method which yielded the results shown in Fig. S4 (ESI†). As listed in Table 3, the barrier for Li-ion diffusion through a hollow site of pristine graphene is 7.41 eV, agreeing well with a previous study.31 The barrier for Li diffusion through a graphene monovacancy is 2.95 eV, through a Stone–Wales defect 3.73 eV and through a graphene 5-8-5 divacancy 1.11 eV. The electrochemical driving force induced by the presence of the FeBO3/LiFeBO3 electrodes, i.e. maximum 3.47 eV, depending on the specific location of the transition state, is therefore insufficient to lower the energy barrier for Li diffusion through a perfect graphene/graphite layer to support the current densities under normal charge/discharge conditions. The same conclusions can be made for structural defects like monovacancies and Stone–Wales defects, and our findings show that only larger defects, e.g. 5-8-5 divacancies, can become active with a transport barrier of 1.11 eV. However, due to the high formation energy of these defects—see Table 3—their equilibrium concentration will be low under most conditions and alternative coating geometries and Li-ion pathways must therefore also be considered.
| Defect type | Formation energy [eV] | Activation barrier of Li diffusion [eV] |
|---|---|---|
| Stone–Wales defect | 5.19 | 3.73 |
| Monovacancy | 7.84 | 2.95 |
| 5-8-5 divacancy | 7.69 | 1.11 |
3.3. Misaligned coating on FeBO3/LiFeBO3 electrodes
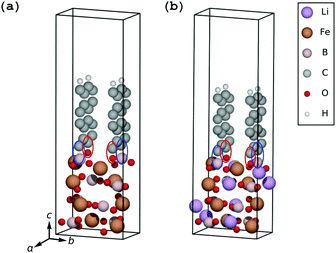
Transmission electron microscopy (TEM) images on carbon-coated LiFeBO3 nanoparticle electrodes obtained by Zhang et al.35 show that a significant misalignment exists between the electrode particles and 1–3 monolayers of carbon coating (Fig. 4(d) in the study of Zhang et al.), and similar observations were reported by Tao et al.36 on carbon-coated LiFeBO3 nanoparticles (Fig. 9(b) in the study of Tao et al.). We have therefore investigated the effects of an angular misalignment of the carbon-coating layers on the FeBO3 and LiFeBO3 electrodes. The coating is here modeled as graphite layers whose edges opposite to the electrode are terminated by hydrogen atoms to avoid dangling bonds. Various positions on the electrode surface at which the coating could anchor were investigated using one graphite layer per unit cell, placed normal to the electrode surface. The graphene coating was strained expansively to the electrode unit cell and the strain of the graphite layer in the electrode a-direction was 7.5% for the FeBO3 electrode yielding a strain energy (i.e. the energy difference between unstrained and strained graphene coating) of 141 meV per C and 4.7% for the LiFeBO3 electrode with a strain energy of 62 meV per C. For both electrodes, the most stable anchoring configuration was found to be that in which one of the coating-edge C atoms bonded to a B atom with a bond length of 1.63 Å and 1.60 Å for FeBO3 and LiFeBO3, respectively, and the other coating-edge C atom bonded to an O atom with a bond length of 1.27 Å and 1.36 Å for FeBO3 and LiFeBO3, respectively, as shown in Fig. 4, indicating that the graphite coating is chemisorbed on the electrode surface. This anchoring arrangement was found to be 284 meV and 470 meV per surface-bonding C atom (four per unit cell) more stable than the second-lowest-energy anchoring configuration in which the C atom which previously bonded to the B atom now bonded to an Fe atom in FeBO3 and LiFeBO3, respectively, shown in Fig. S5 (ESI†).The relative stability of the coating–electrode interface versus the angle between the carbon coating and the electrode is shown in Fig. 5. From here the optimal angular configuration between the electrode (001) surface and the coating plane hinged to the aforementioned B atom and the O atom was found to be that in which the graphene coating was positioned normal to the electrode surface (videFig. 4). The distance between the coating layers in the b-direction was 4.49 Å for FeBO3 and 4.55 Å for LiFeBO3. In this optimal configuration the graphite layers are stacked as AA along the b-axis. Calculations on a structure possessing only one coating layer per unit cell—resulting in a layer spacing of the b lattice parameter—showed identical results, implying that having a less dense distribution of coating layers on the FeBO3/LiFeBO3 surface does not alter the predictions of the angular coating orientation made by the aforementioned study with two graphite layers per unit cell.
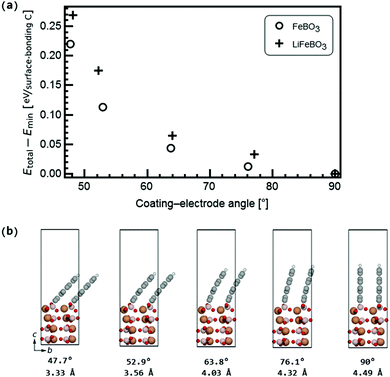 | ||
| Fig. 5 (a) Stability of the carbon coating on the electrode as a function of the angle between the coating and the electrode surface as shown in (b) for FeBO3 with coating–electrode angles and coating interlayer distances listed below. The coloring of the atoms follows that of Fig. 4. | ||
Using the optimal coating–electrode geometry shown in Fig. 4, the potential of a Li ion in a graphitic anode, in the graphite coating attached to the electrode, in the coated electrode surface layer and in bulk FeBO3 during initial-stage discharge was calculated and is depicted in Fig. 6(a). A potential drop of 2.22 V during Li-ion diffusion from the hollow site of graphite closest to the electrode surface into the surface layer of the electrode was found. Interestingly, a Li ion stabilizes in the surface layer of FeBO3 compared to being inserted into bulk FeBO3 by 0.17 eV. However, as more Li ions are inserted from the graphite coating, the Li ion in the electrode surface layer is pushed further into the interior of the positive electrode due to the Li–Li repulsion. Additionally, the electric-potential landscape for a Li ion during final-stage discharge is mapped out in Fig. 6(b). Here, it is noteworthy that the potential of the Li ion inserted into the electrode surface layer (versus metallic Li) is 1.12 V smaller than the potential of a Li ion inserted into the vacancy-containing bulk electrode. This implies that a significant part of the experimentally observed sloping of the voltage profile near the end of discharge in LiFeBO3 could come from the difference between the surface and bulk potentials.
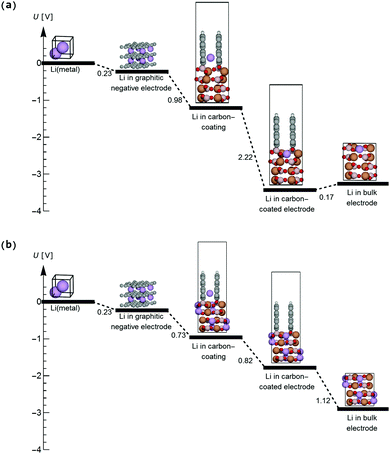 | ||
| Fig. 6 Landscape of the electric potential of Li-ion insertion into the (a) FeBO3 positive-electrode material during the initial discharge process and (b) vacancy-containing LiFeBO3 positive-electrode material during the final discharge process. The coloring of the atoms follows that of Fig. 4. | ||
In order to determine possible interface-induced kinetic limitations for Li-ion transport between the graphite coating and the electrodes, NEB calculations were carried out at both initial-stage and final-stage discharge. The NEB results in Fig. 8 show that there are no activation barriers for Li-ion transport across the coating–electrode interface during (a) initial-stage and (b) final-stage discharge (a barrier of 27 meV predicted to exist at the final-stage discharge is easily overcome by thermal excitation of the Li ions at room temperature). In both the charged and discharged configurations, local minima were identified for the Li ion in the graphene coating as shown in the insets in Fig. 7. Hence, the angular configuration of the graphite coating shown in Fig. 4 is found to provide an energetically preferred state with significantly reduced kinetic barriers for lithium to the positive electrode, compared to the parallel graphene coatings (videFig. 2).
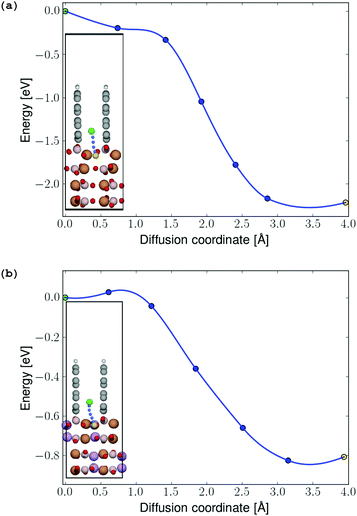 | ||
| Fig. 7 (a) Energy profile for Li-ion diffusion from the graphene coating into the FeBO3 and (b) LiFeBO3 electrode, respectively, with the diffusion pathway shown in the insets. The diffusing Li ion is colored in green (initial position), blue (intermediate positions) and yellow (final position). The coloring of the rest of the atoms follows that of Fig. 4. | ||
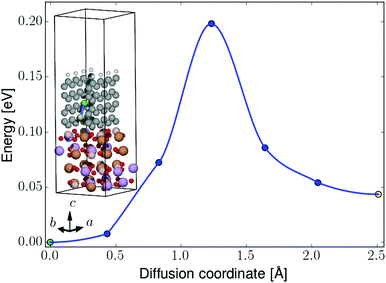 | ||
| Fig. 8 NEB barrier for Li-ion diffusion between graphene hollow sites in the perpendicular-oriented coating on the LiFeBO3 electrode. The diffusing Li ion is colored in green (initial position), blue (intermediate positions) and yellow (final position). The coloring of the rest of the atoms follows that of Fig. 4. | ||
In a realistic situation the size of the graphene sheets is sufficiently large to expect that the interlayer distance between graphene sheets when they are far from the FeBO3/LiFBO3 electrode will correspond to that of graphite (i.e. 3.39 Å). Looking at Fig. 5, in order to reach this situation we can hypothesize two scenarios: (i) the graphene sheets are anchored perpendicularly to the FeBO3/LiFBO3 electrode, having the graphene interlayer distance of 4.49 Å at the anchoring position. Then the sheets gradually bend until they end up being a distance of 3.39 Å apart. (ii) The graphene sheets are tilted ∼48° at the anchoring position, having their interlayer distance 3.39 Å from the starting point. It is difficult to assess which of the two situations will occur in reality since in the latter scenario it is necessary to provide ∼0.25 eV per C atom to tilt the graphene sheets 48° while in the former situation it is necessary to spend some energy to bend the graphene. Analyzing the energy associated with the bending of the graphene sheets is not a trivial task as it has been reported in a recent study by Nilsson et al.,37 which combines DFT with experiments, showing that the bending of graphene sheets on top of metallic substrates is strongly dependent on which atoms saturate the edges of the graphene sheets. In any case, even in the scenario of an angling of the whole coating layers around the anchoring sites on the electrode surfaces (as in Fig. 5(b)), the facile Li diffusion across the coating–electrode interface in Fig. 7 is not expected to be impeded due to the relatively open Li pathway across the interface, which persists even for significant angling, such as 47.7° in Fig. 5(b). In this tilted geometry, the Li-ion diffusion far away from the electrode would resemble that of diffusion in graphite, where a relatively low activation barrier for a Li ion jumping between hollow sites of 0.47 eV was found, agreeing well with previous findings.38 Despite the successful application of carbon-coating the LiFeBO3 electrodes, these materials are still observed to undergo degradation to some extent. In general, the degradation and oxidation of electrode compounds through moisture and air attack under ambient conditions are well-established in the literature5,39 and in this study these degradative species were modeled as H2O and O2. Interestingly, we found that the activation barrier for O2 diffusion in graphite (i.e. the coating far from the electrode surface) at very low concentrations is higher than that for Li diffusion in the same graphite coating, that is, 1.0 eV for O2 diffusion as shown in Fig. S6 (ESI†). In contrast, water was found to diffuse quite easily in graphite with a barrier of only 0.1 eV for jumps between the hollow sites, agreeing well with a relatively low binding energy of water on graphene sheets.40 This indicates that the graphite coating could act as a filter allowing Li ions to diffuse relatively easily across the carbon coating down into the electrode surface during discharge while preventing the degradative O2 species from reaching the electrode surface, however, without being able to block all degradative species, such as H2O, which could explain that degradation occurs even in carbon-coated electrode materials.
For the perpendicular-coating–LiFeBO3 interfaces shown in Fig. 4, it is found that a Li ion positioned at the upper hollow site not terminated by hydrogen atoms has approximately the same energy as when positioned in the lowest hollow site (just above the electrode as shown in the insets of Fig. 7), both being favored by approximately 1 eV compared to the negative-electrode side. NEB results—shown in Fig. 8—yield an activation barrier of 0.2 eV for Li-ion diffusion between the two hollow sites in the LiFeBO3 electrode.
4. Conclusions
Using DFT, stability investigations into different graphene-coating structures and the angular orientation of the graphene coating were carried out, as well as the role of defects in the carbon coating in the lithium transport mechanisms. Based on the calculations, it was found that large structural defects and/or significant misalignments between the carbon coatings and the FeBO3/LiFeBO3 nanoparticles provide mechanisms for facile Li-ion diffusion during charge and discharge. However, significant formation energies of the defects commonly observed in graphene imply low equilibrium concentrations of these defects. Alternative coating geometries where the coating layers were allowed to chemisorb on the electrode surface were investigated, and it was found that the most stable configuration was that in which the coating layer was anchored perpendicularly to the electrode (001) surface with coating-edge C atoms bonding to surface B and O atoms. This optimal coating configuration showed negligible barriers for Li diffusion from the coating into the electrode surface layer, i.e. this external interface is not predicted to block the Li ions during charge and discharge. Compared to the diffusion of Li ions at low concentrations in the graphite coating far away from the electrode surface, the diffusion of the electrode-degrading species, O2, was seen to be very low due to a high activation barrier, whereas another electrode-degrading species, H2O, was seen to easily diffuse in the graphite due to a low barrier of 0.1 eV, indicating that the perpendicularly anchored coating configuration partially protects the electrode from degradation under ambient conditions. Furthermore, the Li-ion diffusion in the graphite coating near the electrode was found to be relatively fast due to a low activation barrier of 0.2 eV. These findings tally well with experimental observations which show no indications of limitations in the Li diffusion induced by the application of carbon coating, and instead the overall electrochemical performance is observed to improve.Acknowledgements
The research leading to these results has received funding from the European Union's Seventh Framework Programme (FP7/2007–2013) under grant agreement no. 608575. JMGL acknowledges support from the Spanish Ministry of Economy and Competitiveness under Projects FIS2012-30996 and FIS2013-46159-C3-1-P and from the Villum Foundation's Young Investigator Programme (4th round, project: In silico design of efficient materials for next generation batteries. Grant number: 10096).References
- R. Chen, S. Ren, M. Knapp, D. Wang, R. Witter, M. Fichtner and H. Hahn, Adv. Energy Mater., 2015, 5, 1–7 Search PubMed.
- C. Delmas, M. Maccario, L. Croguennec, F. Le Cras and F. Weill, Nat. Mater., 2008, 7, 665–671 CrossRef CAS PubMed.
- A. Yamada, N. Iwane, Y. Harada, S. Nishimura, Y. Koyama and I. Tanaka, Adv. Mater., 2010, 22, 3583–3587 CrossRef CAS PubMed.
- S. H. Bo, K. W. Nam, O. J. Borkiewicz, Y. Y. Hu, X. Q. Yang, P. J. Chupas, K. W. Chapman, L. Wu, L. Zhang, F. Wang, C. P. Grey and P. G. Khalifah, Inorg. Chem., 2014, 53, 6585–6595 CrossRef CAS PubMed.
- S.-H. Bo, F. Wang, Y. Janssen, D. Zeng, K.-W. Nam, W. Xu, L.-S. Du, J. Graetz, X.-Q. Yang, Y. Zhu, J. B. Parise, C. P. Grey and P. G. Khalifah, J. Mater. Chem., 2012, 22, 8799–8809 RSC.
- J. C. Kim, C. J. Moore, B. Kang, G. Hautier, A. Jain and G. Ceder, J. Electrochem. Soc., 2011, 158, A309–A315 CrossRef CAS.
- Z. R. Chang, H. J. Lv, H. W. Tang, H. J. Li, X. Z. Yuan and H. Wang, Electrochim. Acta, 2009, 54, 4595–4599 CrossRef CAS.
- Y. Ding, Y. Jiang, F. Xu, J. Yin, H. Ren, Q. Zhuo, Z. Long and P. Zhang, Electrochem. Commun., 2010, 12, 10–13 CrossRef CAS.
- H. Wang, N. Zhao, C. Shi, C. He, J. Li and E. Liu, J. Phys. Chem. C, 2016, 120, 17165–17174 CAS.
- X. Zhou, F. Wang, Y. Zhu and Z. Liu, J. Mater. Chem., 2011, 21, 3353 RSC.
- Y. Janssen, D. S. Middlemiss, S. H. Bo, C. P. Grey and P. G. Khalifah, J. Am. Chem. Soc., 2012, 134, 12516–12527 CrossRef CAS PubMed.
- S. Loftager, J. M. García-Lastra and T. Vegge, J. Phys. Chem. C, 2016, 120, 18355–18364 CAS.
- K. Momma and F. Izumi, J. Appl. Crystallogr., 2011, 44, 1272–1276 CrossRef CAS.
- S. R. Bahn and K. W. Jacobsen, Comput. Sci. Eng., 2002, 4, 56–66 CrossRef CAS.
- G. Kresse and J. Furthmöller, Comput. Mater. Sci., 1996, 6, 15–50 CrossRef CAS.
- P. E. Blöchl, Phys. Rev. B: Condens. Matter Mater. Phys., 1994, 50, 17953–17979 CrossRef.
- J. P. Perdew, K. Burke and M. Ernzerhof, Phys. Rev. Lett., 1996, 77, 3865–3868 CrossRef CAS PubMed.
- M. S. Islam and C. A. J. Fisher, Chem. Soc. Rev., 2014, 43, 185–204 RSC.
- Y. S. Meng and M. E. Arroyo-de Dompablo, Energy Environ. Sci., 2009, 2, 589 CAS.
- V. I. Anisimov, F. Aryasetiawan and I. Lichtenstein, J. Phys.: Condens. Matter, 1997, 9, 767–808 CrossRef CAS.
- D.-H. Seo, Y.-U. Park, S.-W. Kim, I. Park, R. Shakoor and K. Kang, Phys. Rev. B: Condens. Matter Mater. Phys., 2011, 83, 205127 CrossRef.
- S. L. Dudarev, S. Y. Savrasov, C. J. Humphreys and a. P. Sutton, Phys. Rev. B: Condens. Matter Mater. Phys., 1998, 57, 1505–1509 CrossRef CAS.
- I. Scivetti and G. Teobaldi, J. Phys. Chem. C, 2015, 119, 21358–21368 CAS.
- J. Wellendorff, K. T. Lundgaard, A. Møgelhøj, V. Petzold, D. D. Landis, J. K. Nørskov, T. Bligaard and K. W. Jacobsen, Phys. Rev. B: Condens. Matter Mater. Phys., 2012, 85, 32–34 CrossRef.
- E. Bitzek, P. Koskinen, F. Gähler, M. Moseler and P. Gumbsch, Phys. Rev. Lett., 2006, 97, 1–4 CrossRef PubMed.
- H. Jónsson, G. Mills and K. W. Jacobsen, Class. Quantum Dyn. Condens. Phase Simulations – Proc. Int. Sch. Phys., 1998, 385–404 Search PubMed.
- M. Andersen, L. Hornekær and B. Hammer, Phys. Rev. B: Condens. Matter Mater. Phys., 2012, 85405, 1–6 Search PubMed.
- F. Lin, I. M. Markus, D. Nordlund, T. Weng, M. D. Asta, H. L. Xin and M. M. Doeff, Nat. Commun., 2014, 5, 1–9 Search PubMed.
- Y. Shin and K. A. Persson, ACS Appl. Mater. Interfaces, 2016, 8, 25595–25602 CAS.
- F. Yao, F. Güneş, H. Q. Ta, S. M. Lee, S. J. Chae, K. Y. Sheem, C. S. Cojocaru, S. S. Xie and Y. H. Lee, J. Am. Chem. Soc., 2012, 134, 8646–8654 CrossRef CAS PubMed.
- S. Thinius, M. M. Islam, P. Heitjans and T. Bredow, J. Phys. Chem. C, 2014, 118, 2273–2280 CAS.
- R. G. Amorim, A. Fazzio, A. Antonelli, F. D. Novaes and A. J. R. Da Silva, Nano Lett., 2007, 7, 2459–2462 CrossRef CAS PubMed.
- J. Kotakoski, A. V. Krasheninnikov and K. Nordlund, Phys. Rev. B: Condens. Matter Mater. Phys., 2006, 74, 245420 CrossRef.
- F. Banhart, J. Kotakoski and A. V. Krasheninnikov, ACS Nano, 2011, 5, 26–41 CrossRef CAS PubMed.
- B. Zhang, L. Ming, J. C. Zheng, J. F. Zhang, C. Shen, Y. D. Han, J. L. Wang and S. E. Qin, J. Power Sources, 2014, 261, 249–254 CrossRef CAS.
- L. Tao, J. R. Neilson, B. C. Melot, T. M. McQueen, C. Masquelier and G. Rousse, Inorg. Chem., 2013, 52, 11966–11974 CrossRef CAS PubMed.
- L. Nilsson, M. Andersen, B. Hammer, I. Stensgaard and L. Hornekær, J. Phys. Chem. Lett., 2013, 4, 3770–3774 CrossRef CAS.
- K. Persson, V. a. Sethuraman, L. J. Hardwick, Y. Hinuma, Y. S. Meng, A. Van Der Ven, V. Srinivasan, R. Kostecki and G. Ceder, J. Phys. Chem. Lett., 2010, 1, 1176–1180 CrossRef CAS.
- S. Hamelet, P. Gibot, M. Casas-Cabanas, D. Bonnin, C. P. Grey, J. Cabana, J.-B. Leriche, J. Rodriguez-Carvajal, M. Courty, S. Levasseur, P. Carlach, M. Van Thournout, J.-M. Tarascon and C. Masquelier, J. Mater. Chem., 2009, 19, 3979 RSC.
- J. Ma, A. Michaelides, D. Alfè, L. Schimka, G. Kresse and E. Wang, Phys. Rev. B: Condens. Matter Mater. Phys., 2011, 84, 1–4 Search PubMed.
Footnote |
| † Electronic supplementary information (ESI) available: Parallel graphene coating on FeBO3/LiFeBO3 electrodes; a stability analysis of LiFeBO3 surfaces; adsorption of Li ions on pristine graphene; NEB barriers for Li-ion diffusion through pristine and graphene defects; information of other anchoring configurations of the coating on the electrode surface; study of the diffusion of degradative species in graphite coating. See DOI: 10.1039/c6cp06312h |
| This journal is © the Owner Societies 2017 |

