 Open Access Article
Creative Commons Attribution 3.0 Unported Licence
Substituent effects on the relaxation dynamics of furan, furfural and β-furfural: a combined theoretical and experimental approach†
Sven
Oesterling
a,
Oliver
Schalk
b,
Ting
Geng
b,
Richard D.
Thomas
b,
Tony
Hansson
b and
Regina
de Vivie-Riedle
 *a
*a
aDepartment of Chemistry, Ludwig-Maximilians-Universität München, Butenandtstr. 5-13, 81377 München, Germany. E-mail: Regina.de_Vivie@cup.uni-muenchen.de; Fax: +49-89-2180-77133; Tel: +49-89-2180-77533
bDepartment of Physics, Stockholm University, AlbaNova University Centre, Roslagstullsbacken 21, 106 91 Stockholm, Sweden
First published on 16th December 2016
Abstract
For the series furan, furfural and β-furfural we investigated the effect of substituents and their positioning on the photoinduced relaxation dynamics in a combined theoretical and experimental approach. Using time resolved photoelectron spectroscopy with a high intensity probe pulse, we can, for the first time, follow the whole deactivation process of furan through a two photon probe signal. Using the extended 2-electron 2-orbital model [Nenov et al., J. Chem. Phys., 2011, 135, 034304] we explain the formation of one central conical intersection and predict the influence of the aldehyde group of the derivatives on its geometry. This, as well as the relaxation mechanisms from photoexcitation to the final outcome was investigated using a variety of theoretical methods. Complete active space self consistent field was used for on-the-fly calculations while complete active space perturbation theory and coupled cluster theory were used to accurately describe critical configurations. Experiment and theory show the relaxation dynamics of furfural and β-furfural to be slowed down, and together they disclose an additional deactivation pathway, which is attributed to the nO lonepair state introduced with the aldehyde group.
1 Introduction
A general quest in chemistry is to find rules and correlations which can be used to describe, or, even better, predict properties and behaviours of molecular systems. In photo processes, substituents can not only influence the excitation energy, but also the conical intersections (CoIns) of a molecule, which are the sensitive regions for ultrafast population transfer between electronic states, and thus play a crucial role in most deactivation processes. This work investigates the relaxation pathways of photoexcited furan and two of its derivates, furfural and β-furfural, which have an aldehyde group substituted in α- and β-position (Fig. 1). For all three molecules, new theoretical and experimental data are provided. We discuss the influence of the substituent and of its positioning on the whole reaction path. Recently, it was shown that the energetic position and the geometry of CoIns can systematically be influenced by substituents.1–3 Thus, one focus of our study is, to explain such influences for our series of molecules by the extended 2-electron-2-orbital model.1,2 The substituent effects of furfural and β-furfural are predicted by the model for the ring puckering CoIn, one prominent relaxation pathway, and are verified by quantum chemical calculations.A number of studies on the photorelaxation of furan has previously been performed.4–9 Two possible relaxation pathways have been reported,4 ring opening of the CO-bond, also known from related molecules like thiophene,5 and ring puckering, which features a CoIn with a puckered structure with, most notably, the H-atom in either α- or δ-position being bent out of the ring plane. The opening has the energetically lower lying S1/S0 CoIn. However, dynamics simulations result in long lifetimes for wavepacket-dynamics on EOM-CCSD surfaces in reduced dimensions,8,9 or exclusively choose the second pathway in on-the-fly dynamics on TDDFT level of theory.6
The experimental observation of the whole relaxation is challenging due to the high probe energies needed. Two velocity map imaging studies were reported previously. One covered the initial part of the relaxation.6 Here the constant photoelectron anisotropy parameters for individual photoelectron kinetic energies were interpreted as an indicator for a constant electronic character of the excited wavepacket, and thus the puckering mechanism. However, the measurements were restricted to the FC region, as the ionization potential does not remain constant with changing geometry of the molecule.10,11 A recent experiment with a high energetic (160 nm) probe pulse reached further into the direction of both CoIns, but the spectrum of the short-time dynamics is superimposed by the signal generated by an inverted pump and probe order.7
In the present study, we use high intensity instead of high energy for the probing pulse, in order to cover the higher energetic range via two photon processes and thus circumvent this problem. This way, it is possible to follow the relaxation of furan from the FC region to the CoIn. Theoretically the deactivation of the three molecules is characterized by quantum chemical calculations complemented by non-adiabatic on-the-fly dynamics, where possible. One large challenge was to adequately describe on one hand the diffuse character of electronic states in the FC-region and on the other hand the multi-reference character at the CoIns. To meet this challenge, several high-level electron correlation methods were utilized which also allowed us to benchmark the setup used for the dynamics.
2 Methods
2.1 Experimental set-up
Furan, furfural and β-furfural were purchased from Sigma Aldrich with nominal purities of 99%, 99% and 97%, respectively, and were used without further purification.Absorption spectra were measured in a 1 cm quartz cell (Hellma) under saturated vapor pressure using a Cary 5e photospectrometer (Varian). Our magnetic bottle set-up and wavelength generation schemes were described before.12 As pump pulses, we used the third and fourth harmonic of the fundamental 800 nm pulses of our 1 kHz-laser system (Coherent Legend USP-HE) at intensities of 700 and 300 nJ pulse−1. As a probe, we used the second or the third harmonic at intensities of 6 and 1.4 μJ pulse−1. The cross correlation of our pulses varied between 180 ± 20 fs for 267 + 400 nm experiments and 150 ± 20 fs for 200 + 267 nm experiments as measured by the non-resonant ionization signal of Xe, which was also used for energy calibration of the spectrometer. For the experiments, the pulses were aligned collinearly and the focusing conditions were typically f/150 for the pump and f/125 for the probe pulse. Perpendicular to the incoming laser pulses, the molecular beam was introduced into the interaction region of our magnetic bottle spectrometer by a needle valve to which we applied a slightly negative voltage. The delay between pump and probe pulses was controlled by a stepper motor. At each delay time, the times of flight of the generated photoelectrons were recorded and the pump–probe signal was corrected by the independently measured signal for pump and probe only.
2.2 Data fitting
The data sets of furfural and β-furfural were modeled with a global fitting routine13 | (1) |
The data sets of furan were not fitted with a global exponential function. Instead, the different energy slices SE(Δt) were fitted individually with not only ts, but also τ1 used as free fitting parameters in order to account for the temporal shift of the photoelectron spectrum10,11 and a change of the lifetime in the different regions of the potential energy surface.11,14 The temporal shift of the spectrum is caused by large amplitude motions of the molecule after photoexcitation. Along the relaxation paths, the ionization potential rises while potential energy is transformed into kinetic motion of the nuclei. Thus, when the molecules deform, the photoelectron kinetic energy decreases and the transient spectrum shifts. Therefore, for each energy trace, different lifetimes τ1 can be observed as only parts of the dynamics are covered. At the energy where the largest shift is observed, the molecule has likely reached the energetic minimum of the potential energy surface and the decay constant measured at that point can be interpreted as the time the wavepacket needs to pass through the conical intersection back to the ground state. As a consequence, the total excited state lifetime can be considered as the maximum time shift plus the exponential decay time fitted at the energy where that shift is observed.
2.3 Computational details
Calculations were performed on several levels of theory to obtain a high level of accuracy for the different critical points on the potential energy surfaces, in spite of their individual demands. This kind of benchmarking also allows to rate the non-adiabatic on-the-fly dynamics simulations. Their quantum chemical description has to cover the whole potential surface. Simultaneously, it is most limited in terms of computational cost, which requires a compromise between accuracy and calculation time. We used the state averaged complete active space self consistent field (SA-CASSCF) method with 6-31G* as basis set for the on-the-fly dynamics. The (10,9) active space for furan involves the whole π-system and both CO σ-bonds in order to describe the ring opening (Fig. 2a). For furfural and β-furfural, a (12,10) CAS was used. The additional π orbitals and the nO-lonepair of the aldehyde group were included, in return one of the CO σ-bond pairs was removed to avoid too high computation times. This reduction is easily compensated as both orbitals are connected by the oxygen orbitals and can easily interchange by rotating in and out of the CAS automatically. The CO σ-bond can still break at both sides.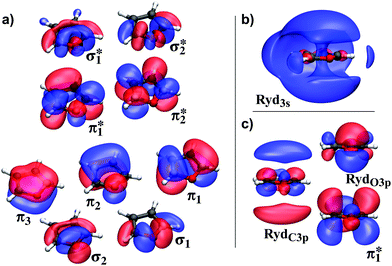 | ||
| Fig. 2 Active space of furan. (a) The orbitals in the (10,9) active space used in most calculations. (b) The Ryd3s orbital, (c) two Ryd3p orbitals and the adapted π1* from (a). The isovalue chosen for all but Ryd3s is 0.03, the latter is rendered with an isovalue of 0.018. The expectation values 〈r2〉 in [a02] for the orbitals are: (a) π1*: 3.82; (c) π1*: 10.11; Ryd3s: 18.68; RydC3p: 16.87; RydO3p: 4.03; see Fig. S9 in the ESI.† | ||
Geometry optimizations used the 6-31G* basis set for all structures.‡ Equilibrium geometries and normal modes were obtained at CCSD(T) level of theory. CoIns between the ground and first excited state were optimized with CASSCF SA2 using the full π-space and both CO σ-orbital pairs as active space. In cases where the nO-orbital does not contribute to either of the two states, it was not included in the CAS of furfural and β-furfural, else the active space was not stable.
In the FC region Rydberg orbitals proved to play a crucial role. In general, their presence complicates the description of the electronic states which becomes rather sensitive to the quantum chemical theories used. An extensive comparison was performed to assess results and methods at all critical points. As reference basis set, an augmented triple-zeta ANO basis,15 as taken from the EMSL basis set exchange library,16,17 was employed. Two smaller alternatives that also cover Rydberg orbitals were considered, 6-31+G* as standard basis and a further reduced custom basis set. The latter was built by augmenting the 6-31G* basis with just the diffuse p-orbitals of the 6-31+G* basis (see Section 3.1). This basis set will further be referred to as “aug”.
The quantum chemical methods used include CASSCF, equation of motion coupled cluster singles and doubles (EOM-CCSD red, from here on referred to, as CCSD), and complete active space perturbation theory (CASPT2) in various implementations: XMS-MSMR-RS2 (extended multistate multi reference Rayleigh Schrödinger perturbation theory, from here on referred to, as RS2) as reference, RS2C mainly to be able to compute the larger molecules, and CASPT2 as implemented in MOLCAS,18 because multistate calculations were needed at some points. Apart from the latter, all quantum chemical calculations were performed with the MOLPRO2012 program package.19,20
For the non-adiabatic on-the-fly simulations our modified version of Newton-X,21,22 which supports the usage of Molpro 201223 was used. For each molecule a set of 100 trajectories was started from a Wigner distribution around the ground-state equilibrium geometry and propagated for 250 fs (furan) or 500 fs (furan derivates). The properties of the considered states were computed every 0.5 fs. The non-adiabatic coupling vectors between two states, which are used in Tully's fewest switches surface hopping routine,24 were calculated if the energy difference between the states was less or equal to 2 eV in the preceding step and else set to zero.
3 Furan
Furan serves as our reference to study the effect of substituents attached at different positions. We follow critical points along its possible relaxation pathways and try to find a balanced description for the electronic structure of the whole process.3.1 Excited states at the Franck–Condon point
An overview about the excited states of furan at the FC point with comparison to other theoretical as well as experimental studies was given by Gavrilov et al. 2008.5 In their work a basis set explicitly tailored for the description of the FC-region and thus of the Rydberg states is used in combination with the DFT/MRCI method, feasible only for single point calculations. Our benchmark ANO (10,10) RS2C excitation energies (Table 1) of the first ππ* excited states lie roughly 0.2 eV above the values provided in their work. The active space consists of the whole π-space, the CO-σ orbitals (Fig. 2a) and a 3s-Rydberg orbital (Ryd3s, Fig. 2b). In this basis, the πRyd3s state is nearly degenerate with the first ππ* state.| Dominant transition | Method | (10,10) ANO | (10,9) ANO | 6-31+G* | 6-31G* | (10,11) aug |
|---|---|---|---|---|---|---|
| π1π1* | RS2 | 6.25 | 6.52 | 6.84 | 6.58 | |
| RS2C | 6.24 | 6.23 | 6.50 | 6.82 | 6.61 | |
| CASSCF | 7.72 | 7.62 | 7.69 | 8.00 | 6.79 | |
| π1Ryd3s | RS2C | 6.26 | ||||
|
π1π2*
π2π1* |
RS2 | 6.45 | 6.58 | 6.72 | 6.63 | |
| RS2C | 6.44 | 6.41 | 6.55 | 6.68 | 6.59 | |
| CASSCF | 6.78 | 6.64 | 6.70 | 6.80 | 6.65 | |
The influence of the Ryd3s-orbital proved to be negligible for the description of the ππ* states (see Table 1 first and second column). In addition, it was found that the corresponding πRyd3s state does not play a crucial role in the relaxation process of furan.6 To save computation time, the Ryd3s-orbital is left out of the CAS and we will further focus the discussion on the ππ* states.
When using CASSCF instead of CASPT2, as done in the dynamics simulations, the order of the states changes. The excitation energy of the bright π1π1* state raises significantly (see Table 1: RS2(C) vs. CASSCF). The dark π1π2*/π2π1* state is, in comparison, hardly affected, which results in a swap of the energetic order of the two.
Analyzing the PT2 correction shows, that the reason for the strong impact of the method on the π1π1* state is its diffuse character. For CASSCF this effect can be included by increasing the basis set and the active space (also see Table S1 in the ESI†). Rotating two additional Ryd3p orbitals into the CAS in the ANO or 6-31+G* basis sets significantly improves the description of the state (Fig. 2c). In addition, the shape of the π1* orbital changes (compare Fig. 2a and c). For further improvement related to computational cost and stability, we constructed a basis set (“aug”), where we augmented the 6-31G* basis with only the diffuse p orbitals from 6-31+G*. Comparing the CASSCF results of the (10,9) CAS with 6-31+G* to the results of the (10,11) CAS with the aug basis (Table 1), the excitation energy of the latter is reduced by almost 1 eV and approaches its RS2 energies. However, for the correct ordering of the states still CASPT2 is needed.
Leaving the FC region, the diffuse character of the π1π1* state decreases and the CoIns (see Section 3.3) are described well using just the 6-31G* basis set on (10,9) CASSCF level of theory. As the (10,11) CAS even in the aug basis frequently runs into convergence issues outside the FC region, it was not used for the dynamics. Thus, the compromise for the dynamics simulations is to accept that too much energy is deposited in the molecule in the FC region.
3.2 Time-resolved photoelectron spectrum of furan
Photoelectron spectra of furan were recorded for two different pump–probe settings. The spectrum for the 200 nm pump and 267 nm probe (200 + 267 nm) is shown in Fig. 3 while the 200 + 400 nm spectrum is shown in the ESI.† In contrast to previous experiments,6 we chose a higher probe intensity in order to use the two photon probe signal which allowed us to follow the dynamics further along the potential energy surface. The stronger one photon probe signal [1 + 1′] extends from 2.1 eV to 0 eV electron kinetic energy. The electrons that form the weaker two photon probe signal have an additional kinetic energy of 4.6 eV (267 nm), the two photon probe signal [1 + 2′] thus starts at 6.7 eV. The fitted ts(E) (eqn (1)), which roughly follows the peak maximum of the photoelectron spectrum, shifts by 60 ± 15 fs from the FC point (at 1.85 eV in the [1 + 1′] signal) to an electron kinetic energy of 3.3 eV in the [1 + 2′] signal. This shift is attributed to a motion of the wavepacket on the excited state potential energy surface towards the CoIns. From here the signal decays with a lifetime of 110 ± 25 fs, which is attributed to the decay to the groundstate and the accompanying fast decrease of the potential energy of the molecules. Neither the extent of the shift nor the decay time could be monitored by previous experiments. At the energy cut-off of [1 + 1′] ionization (at 2.1 eV), we fitted a time constant of 30 ± 15 fs which was assigned to the lifetime of the πRyd3s state in accordance to Fuji et al.6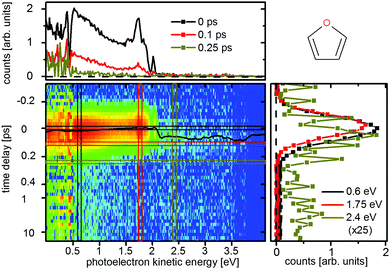 | ||
| Fig. 3 Time-resolved photoelectron spectra of furan upon excitation at 200 nm and ionization at 267 nm. The black line represents the time zero shift ts(E) as fitted by eqn (1). The cut at 2.4 eV (ocher) is scaled by a factor of 25. | ||
3.3 Relaxation pathways and associated S1/S0 conical intersections
Two possible relaxation pathways of furan have been described in literature.4 The first is a ring puckering, where the oxygen atom moves out of the ring plane, and one of the hydrogen atoms attached in α position bends far out of the plane in the opposite direction (CoInp – Fig. 4, left). The other pathway is an opening of the ring between the oxygen atom and one of the carbon atoms (CoIno – Fig. 4, right). Both pathways were found to be barrierless on CASSCF level of theory. Interpolations done on CCSD4 and DFT/MRCI5 level of theory exhibit very small barriers with an upper limit of 0.06 eV for the opening pathway. Both S1/S0 CoIns lie below the FC-region and are thus energetically accessible. At ANO XMS-RS2 level of theory, they lie 5.0 eV (CoInp) and 4.0 eV (CoIno) above the ground state minimum. Literature indicates,6,8,9 that the puckering probably is the main relaxation path, although its conical intersection CoInp lies roughly 1 eV above the one of the opening pathway (CoIno).Our CASSCF dynamics exhibit trajectories of both channels, with the ring opening being the clear favorite. The geometries where the hops to the ground state occur, as well as the state characters at these points suggest that CoInp and CoIno are connected by a seam. Only a good half of the trajectories involving the ring opening directly jumps to the ground state at the CoIn. The rest stays in the excited state while the ring opens completely, and the large flexibility of the linear molecule allows for accessing various CoIn-structures, which were not distinguished further.
Of the 88 trajectories which reached the ground state, 43 are assigned to CoIno, 37 reach the ground state via completely opened CoIns, and eight trajectories are assigned to CoInp. Two trajectories of CoIno and three of CoInp lie inbetween both structures and were assigned by inspecting orbitals and configuration interaction (CI)-vectors, to determine whether the states include mainly the ππ*-, or the πσ*-excitation.
Most likely, the importance of the opening channel is overestimated. The small barrier along this path seemingly vanishes in CASSCF due to the shortcomings in the FC region. A frequency analysis of the π1π1* state at the FC-point (Table 2) shows that the gradient in direction of the puckering is unaffected when going from RS2C to CASSCF level of theory, but the curvature in direction of the barrier of the opening path becomes much weaker. This is reflected by the decrease of the frequency of the asymmetric CO stretching mode from 1989 to 667 cm−1.
| [cm−1] | oop (O) | oop (H) | CO asym | CO sym |
|---|---|---|---|---|
| CAS | −449 | 394 | 667 | 796 |
| RS2C | −462 | 322 | 1989 | 789 |
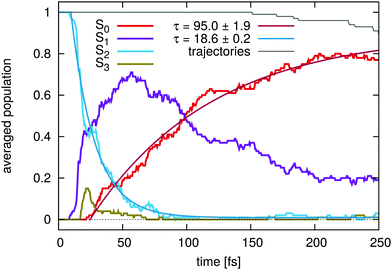
The excited state lifetimes, extracted from the on-the-fly dynamics, are in good agreement with the experiment. Fig. 5 shows the temporal evolution of the population dynamics of furan averaged over all 88 trajectories. The simulation is started in the S2(π1π1*) state from where the S1 state is populated almost directly. Away from the FC-region, the electronic characters of the S2 and S1 state interchange. The decay of the S1(π1π1*) state is then mediated by the S1/S0 CoIns and is most easily followed by the rise of the ground state population. This begins after 25 fs, the first time a S1/S0 CoIn is reached. From here a fit (red line) to the on-the-fly data results in a total excited state lifetime of 95 ± 2 fs (Fig. 5), which corresponds to the passage through the CoIns. The 25 fs correspond to the experimentally observed 60 fs and the 95 fs to the observed 110 fs.
The discrepancy in the initial delay is attributed to the additional energy in the π1π1* state at the FC point on CASSCF level. This may lead to a speed up in reaching the CoIns to the S0-state. In addition, it may result in an overestimated fraction of the trajectories following the relaxation pathway via the ring opening, and could be the reason for the increased appearance of the opening pathway compared to the work of Fuji et al.6
4 The extended two-electron two-orbital model, introducing the aldehyde group
Furan is an interesting example of a molecule with competing relaxation pathways, where modification of one channel might influence which pathway is taken.§ With this in mind, we use the extended two-electron two-orbital model,1,2 to explain the formation of CoInp, the central point of the puckering pathway, and discuss, how its geometry will be altered by substitution of an aldehyde group. Predicting the implications on the geometry of a specific CoIn is the first step to being able to manipulate its energetic position.The two-electron two-orbital model was first used by Bonačić-Koutecký et al., to explain the formation of CoIns in polyenes27,28 and later extended by Nenov et al.1,2 In this section, we provide a brief account of the model's fundamentals and utilization. The interested reader will find rigorous derivations of the formulas and in-depth discussion of the model in ref. 1, 2, 27 and 28. In the two-electron two-orbital model the description of the crossing states is reduced to two orbitals in which two electrons are placed in different occupation patterns. Reaching degeneracy of both states is split into two steps. The first step handles the requirements to reach orbital degeneracy, the second step addresses the requirements to reach energy degeneracy. Our discussion focuses on CoInp, the S1/S0 conical intersection of the puckering pathway.
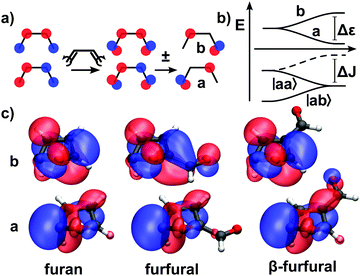
First, we explain the formation of CoInp in furan. For this purpose, the π-system of furan is treated as a modified cis-butadiene, its polyene building block, without the heteroatom. Here, the two states involved will be described by two occupation patterns of two electrons in orbitals a and b (Fig. 6a). The orbitals are localized at different atomic centers. The states are a single occupation of a and b, written |ab〉, and a double occupation of a, written |aa〉.
The first step is to reach a geometry where the highest occupied molecular orbital (HOMO) and the lowest unoccupied molecular orbital (LUMO) degenerate. In butadiene, this can be achieved by a disrotatoric twist of the CH2 ends. A linear combination between HOMO and LUMO at this point yields the orbitals a and b, which are localized at different atomic centers (Fig. 6a). They still have the same energy. The two crossing states are now described by the configurations |ab〉 and |aa〉. At this point of orbital degeneracy, the resonance integral between a and b vanishes (hab= 0). This is the first required condition to reach a CoIn within this model.2 The energy difference between the states |ab〉 and |aa〉 at this point is:
E|aa〉 − E|ab〉 = ΔJ − Δε![[thin space (1/6-em)]](https://www.rsc.org/images/entities/char_2009.gif) , , | (2) |
This manifests the second requirement to reach a CoIn, the heterosymmetry condition. Either the energy of a has to be lowered, and/or the energy b has to be raised, until Δε equals ΔJ (Fig. 6b). During this process the resonance condition hab = 0 must still persist. Degeneracy can be achieved by deformation, e.g. one of the CH2 groups is pyramidalized which leads to an sp3 hybridization and lowers the energy of the orbital which is localized at the respective carbon atom.
In furan, the oxygen atom influences the electronic situation in the molecule significantly and additional terms have to be taken into account for the resonance condition.1 Still one can assign the involved CAS orbitals (Fig. 6c left) to the orbitals a and b of the model (Fig. 6a). At the CoIn, the δ-H atom in Fig. 6c is bent below the ring plane which pyramidalizes the δ-C atom and thereby lowers the energy of orbital a sufficiently to reach energy degeneracy. Thus, in furan the heterosymmetry condition is fulfilled by deformation.
In addition to the deformation, electronic effects of heteroatoms influence the energy of the orbitals a and b. As both effects combine to achieve Δε = ΔJ, the deformation of the δ-H at the CoIn can be manipulated by introducing electronic effects. In (α-)furfural and β-furfural, the aldehyde group interacts exclusively with a or b, depending on whether the orbital is localized in α or β position: in furfural orbital b, in β-furfural orbital a is affected (compare Fig. 6c). In the affected orbital, the polyenic π system interacts with the unoccupied π* orbital of the CO group, which lowers its energy. The unaffected orbital stays the same in shape and energy. Consequently, Δε will change, and for the CoIn to be reached, the structure of the molecule has to be adjusted in order to fulfill Δε = ΔJ again.
In furfural, where the energy of b is lowered by the aldehyde group, the hydrogen atom has to be bent more, compared to furan, to equivalently lower the energy of a. In β-furfural, the hydrogen atom has to be bent less, because a is already stabilized by the CO orbital. In β-furfural, CoInp can also be reached, when, instead of the δ-H, the α-H atom is puckered. In this case, the role of the orbitals a and b is exchanged. Thus, instead of orbital a, orbital b is connected to the aldehyde-group, and, like in furfural, the puckering has to be increased.
One can try to infer the impact of those structural changes on the energetic position of the CoIn on the potential energy surface, but to judge the energetic behaviour of the whole molecule, instead of only single MOs, quantum chemical calculations are still needed for most cases. For furan and its derivatives the question was whether the relative energy rises in furfural and decreases in β-furfural, as the bending of the hydrogen atom means further deformation compared to the equilibrium geometry. The influences on the CoIn were analyzed as part of the investigation of the deactivation process of both molecules.
5 Quantum chemical results of furfural and β-furfural
Table 3 shows the energies and transition dipole moments for selected excited states of all three molecules, furan, furfural, and β-furfural at the FC point. The aldehyde group introduces significant changes. Compared to furan, the first excited state of the derivates is always a nOπ* excitation from the aldehyde oxygen. Due to the extension of the π system by the aldehyde group, the ππ* states are lowered in energy while the Rydberg orbitals are less affected. Thus the Ryd3s state shifts from the S1 (in furan) to the S4 position and the Ryd3p orbital mixes only with the higher lying ππ* states. The highest oscillator strength is found for the S2 state for furan and furfural, while in β-furfural the S5 state shows the strongest transition dipole moment.| Furan | Exc. energies [eV] (osc. str.; character) | ||
|---|---|---|---|
| RS2C(10,10) ANO | 6.26 (0.00; πRyd3s) | 6.24 (0.15; π1π1*) | 6.43 (0.01; π1π2*/π2π1*) |
| CCSD ANO | 6.21 (0.00; πRyd3s) | 6.45 (0.17; π1π1*) | 6.76 (0.00; π1π2*/π2π1*) |
| CCSD 6-31+G* | 6.39 (0.00; πRyd3s) | 6.63 (0.17; π1π1*) | 6.86 (0.00; π1π2*/π2π1*) |
| CAS(10,11) aug | 6.79 (0.17; π1π1*) | 6.65 (0.00; π1π2*/π2π1*) | |
| Furfural | S1 | S2 | S3 | S4 | S5 |
|---|---|---|---|---|---|
| CCSD ANO | 3.91 (0.00; nOπ*) | 5.20 (0.36; ππ*) | 6.20 (0.03; ππ*) | 6.52 (0.00; πRyd3s) | 7.23 (0.13; ππ*) |
| CCSD 6-31+G* | 3.96 (0.00; nOπ*) | 5.34 (0.36; ππ*) | 6.31 (0.04; ππ*) | 6.61 (0.00; πRyd3s) | 7.41 (0.10; ππ*) |
| CAS(14,12) 6-31G* | 3.84 (0.00; nOπ*) | 5.94 (0.09; ππ*) | 6.85 (0.29; ππ*) | 7.51 (0.15; ππ*) | |
| PT2(14,12) 6-31+G* | 3.87 (nOπ*) | 4.71 (ππ*) | 6.39 (ππ*) |
| β-Furfural | S1 | S2 | S3 | S4 | S5 |
|---|---|---|---|---|---|
| CCSD ANO | 4.06 (0.00; nOπ*) | 5.70 (0.11; ππ*) | 6.45 (0.10; ππ*) | 6.68 (0.00; πRyd3s) | 6.78 (0.40; ππ*) |
| CCSD 6-31+G* | 4.08 (0.00; nOπ*) | 5.83 (0.10; ππ*) | 6.55 (0.16; ππ*) | 6.79 (0.00; πRyd3s) | 6.92 (0.34; ππ*) |
| CAS(14,12) 6-31G* | 3.95 (0.00; nOπ*) | 6.19 (0.01; ππ*) | 7.65 (0.26; ππ*) | 8.18 (0.12; ππ*) | |
| CAS(14,14) aug | 4.00 (0.00; nOπ*) | 6.13 (0.01; ππ*) | 6.97 (0.17; ππ*) | 7.78 (0.36; ππ*) | |
| PT2(14,12) 6-31+G* | 3.99 (nOπ*) | 5.21 (ππ*) | 6.36 (ππ*) |
In furan, the excitation energies change slightly, from RS2C and the ANO basis to CASSCF with the aug basis, but the states stay clearly identifiable. In furfural and β-furfural, the electronic characters of the ππ* states depend strongly on the level of theory. While the CCSD results are characterized by dominant ππ* transitions, the CASSCF results are a mixture of many transitions. In consequence, the CASSCF excited states show significantly different oscillator strengths and cannot be assigned to the CCSD-states, which is unambiguously possible in furan.¶
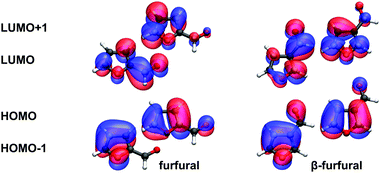
On CCSD level of theory, we could identify three low-lying ππ* states (S2, S3, S5) which are characterized by HOMO–LUMO, HOMO−1–LUMO and HOMO–LUMO+1 excitations. Between S3 and S5, several Rydberg states and another excitation from the nO orbital are located. All these states have no oscillator strengths and are not listed except for the S4(πRyd3s) state, which is already known from furan. In furfural, the LUMO and in β-furfural the LUMO+1 are most similar to the LUMO of furan (see Fig. 7). This explains the shift of the strong oscillator strength from S2 to S5 in β-furfural.
Regardless of which of the three basis sets is used, the ππ* states of the CASSCF calculations converge to solutions which are not described by one or two major determinants. The problem arises from the multitude of low-lying Rydberg states. In contrast to furan, adding diffuse 3p orbitals to the active space does not solve this issue. While no effect is observed in furfural, in β-furfural the description of the S2 and S5 states is only slightly improved such that S5 now has the strong oscillator strength. Nevertheless the electronic structure is still strongly mixed and remains unreliable. For this reason it is necessary to use multistate implementations when advancing to CASPT2. MOLCAS-CASPT2 (SA6) was employed to further investigate the character of the states. This results in two ππ* states with similar electronic character compared to the CCSD states for S2(ππ*) and S3(ππ*).
The experimental data confirms the CCSD-results. Fig. 8 shows the experimental UV-spectra of furan (red), furfural (green) and β-furfural (blue) together with the theoretical data. The theoretical values are shifted by the difference between the calculated excitation energy of furan and the measured peak maximum. For CCSD (light green and blue) the shift is 0.39 eV (indicated by the red arrow) and for CASSCF (dark blue) 0.73 eV. The CCSD excitation energies as well as the relative oscillator strengths coincide well with the experimental spectra. The CASSCF-results fit neither in their absolute nor relative peak position.
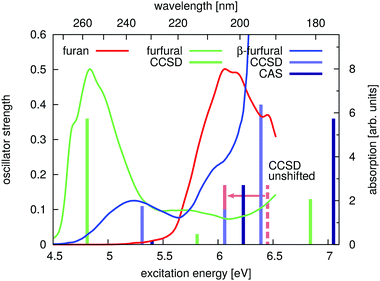 | ||
| Fig. 8 Experimental UV absorption spectra of furan (red), furfural (green) and β-furfural (blue) and calculated excitation energies at the FC point (bars). The spectra are given in individual arbitrary units. The ANO CCSD- and aug (14,14) CASSCF-excitation energies are shifted by the energy difference of the experimental peak maximum of furan with the furan excitation energies of the respective methods. This is indicated by the dashed, red line, which symbolizes the unshifted CCSD excitation energy of furan (compare Table 3). | ||
Leaving the FC region, the discrepancies in the description of the states between CCSD and CASSCF vanish. The influence of the Rydberg states decreases as their energy rises when outside the FC region. Therefore it is possible to apply the CASSCF method which allows to optimize the CoIns. CASSCF SA2 (12,11) was used to identify the S1/S0 CoIns of the puckering and ring opening pathways. In this case the lonepair of the aldehyde oxygen was left out, as the nOπ* state lies energetically above the first ππ* state at this geometry. At another geometry, a third energetically low lying S1/S0 CoIn between the nOπ* and the S0 state can be located for both furan derivates. It was optimized using the full (14,12) active space. To facilitate the comparison with the FC point, single point calculations on CCSD and MSPT2 level of theory were performed for all optimized CoIns. Table 4 shows the energy differences of the CoIns of all three molecules to the GS equilibrium energy and to the FC energy, as well as the pyramidalization realized in the puckered CoIns. The measurement of the degree of pyramidalization is explained in the ESI† (Fig. S2). A value of 0 corresponds to a planar and a value of 1 to a tetrahedral structure.
| Furan | Furfural α | Furfural δ | β-Furfural α | β-Furfural δ | |||
|---|---|---|---|---|---|---|---|
| Puckering | Δ FC-CoInp [eV] | PT2 | 1.30 | −0.33 | 0.22 | 0.16 | |
| CCSD | 1.56 | 0.18 | 0.74 | 0.63 | |||
| Δ CoInp-Min [eV] | PT2 | 4.95 | 5.05 | 4.99 | 5.05 | ||
| CCSD | 5.07 | 5.16 | 5.09 | 5.20 | |||
| CAS | 5.28 | 5.23 | 5.28 | 5.29 | |||
| Pyramidalization | 1.644 | 1.830 | 1.790 | 1.455 | |||
| Opening | Δ FC-CoIno [eV] | PT2 | 2.26 | 0.82 | 0.64 | 1.19 | 1.40 |
| CCSD | 2.39 | 1.19 | 0.99 | 1.45 | 1.74 | ||
| Δ CoIno-Min [eV] | PT2 | 3.99 | 3.89 | 4.07 | 4.01 | 3.81 | |
| CCSD | 4.24 | 4.15 | 4.34 | 4.38 | 4.09 | ||
| CAS | 3.82 | 3.63 | 3.67 | 3.63 | 3.70 | ||
| nOπ* state | Δ FC-CoInn [eV] | CCSD | 0.88 | 0.95 | |||
| Δ CoInn-Min [eV] | CCSD | 4.47 | 4.88 | ||||
| CAS | 4.48 | 5.11 | |||||
From furan to its derivates the CoIns become less stabilized with respect to the FC point (ΔFC-CoIn) for both, the puckering and the opening pathway, which will slow down the relaxation dynamics compared to furan. This is, as a general effect, largely attributed to the extension of the conjugated π-space in furfural and β-furfural compared to furan, which decreases the gap between the electronic states at the FC point. At the CoIns this effect is reduced, because the π-space partly segregates on the puckering pathway, and on the ring opening pathway the σ* orbital of the πσ* state is not part of the conjugation in the first place. Therefore, ΔCoIn-Min hardly changes from furan to its derivates. For both derivates the energies of the opened CoIns still lie roughly 1 eV below the puckered ones. The new S1/S0 CoIns of the nOπ* state (CoInn) lie inbetween the others.
In comparison to the energetic consequences from the electronic changes at the FC point, the effect of the different degrees of pyramidalization in CoInp is negligible. The exact position of only the H-atom turns out to be of minor importance. In case of β-furfural, where the α- and δ-CoInp have the same FC point, the increased pyramidalization in the α-position does not even lead to the assumed higher energy.
The influence of the substituent and its location on the pyramidalization itself, however, is exactly as predicted by the extended two-electron two-orbital model. The degree of pyramidalization is highest in furfural, followed by β-furfural, puckered in the α-position (the two CoIns with the stabilized orbital b), next is furan, and the last β-furfural, puckered in the δ-position (the CoIn with the stabilized orbital a). This is an excellent confirmation for the validity of the model, and in a next step, one could think of altering the molecule to link its energy to the predicted structural change more strongly.
6 Dynamics of furfural and β-furfural
Time resolved photoelectron spectroscopy was performed with two different pump–probe settings for the furan derivates. Fig. 10 and 11 show the spectra of furfural upon pump–probe wavelengths of 267/400 nm and 200/267 nm, respectively. The spectra of β-furfural are similar and are provided in the ESI.† Overall the experimental time constants of furfural and β-furfural confirm the theoretical findings. In comparison to furan the dynamics are slowed down significantly, as expected from the reduced excitation energy due to the extended π-system.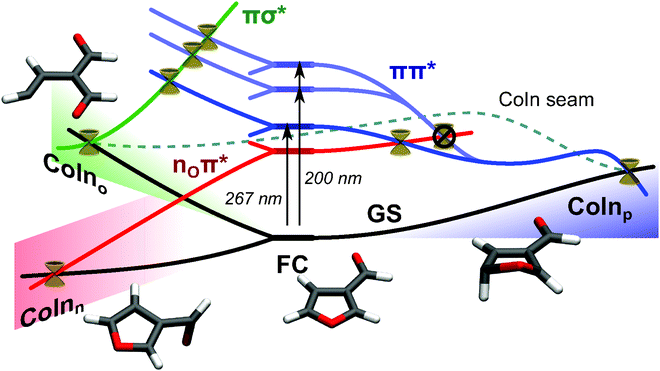 | ||
| Fig. 9 Relaxation scheme for β-furfural. Initial excitation at the FC region populates the energetically lowest lying ππ* state (blue) with the 267 nm pump pulse, or two higher excited ππ* states (light blue) with the 200 nm pump pulse. Three possible deactivation routes arise: (1) (blue) – the puckering pathway is assumed to be the main pathway, in accordance with furan. It leads through a S1 minimum to CoInp. Here it relaxes to the ground state via a photophysical process. (2) (green) – If one of the CO bonds in the ring is elongated far enough, the πσ* state (green) stabilizes and crosses all three ππ* states (see Fig. S3 in the ESI†). From CoIno the ring opens and thereby the photochemical process takes place. CoIno and CoInp are connected by a CoIn seam. (3) (red) – The nOπ* state (red) crosses the ππ* states somewhere on the potential energy surface, here shown exemplarily in the puckering pathway. It gets populated only from the lowest ππ* state. If this happens, CoInn can be reached mainly by rotation of the aldehyde group. The puckering and the opening decay with τ2, relaxation via nOπ* is responsible for τ1. | ||
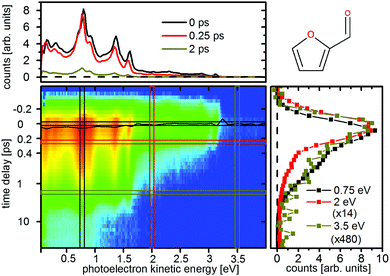 | ||
| Fig. 10 Time-resolved photoelectron spectrum of furfural upon excitation at 267 nm and ionization at 400 nm. The black line represents the time zero shift ts(E) as fitted by eqn (1). The scaling factors for the cuts on the right are 14 (2 eV, red) and 480 (3.5 eV, ocher). | ||
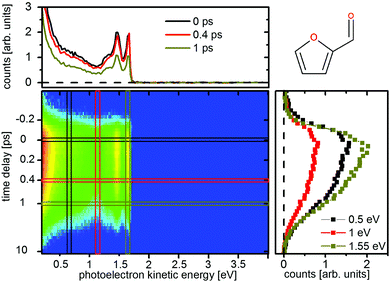 | ||
| Fig. 11 Time-resolved photoelectron spectrum of furfural upon excitation at 200 nm and ionization at 267 nm. | ||
The photoelectron spectra do not show the same strong time dependent shift of electron kinetic energy as in furan and thus no notable wavepacket dynamics in the excited state can be assigned. This is in agreement with the theoretically predicted decrease in the slope of the excited states. Instead the spectrum is highly structured (Fig. 10 and 11, top) and the individual peaks remain throughout the measured time interval. For excitation with the 267 nm pulse two time constants can be attributed to the relaxation to the ground state. The time constants are τ1 = 140 ± 30 fs and τ2 = 1.58 ± 0.2 ps for furfural, and τ1 = 300 ± 50 fs and τ2 = 2.15 ± 0.3 ps for β-furfural, respectively. Both time constants are visible across the whole spectra. For excitation with the 200 nm pulse only one time constant can be observed, τ2 = 1.5 ± 0.2 ps for furfural and τ2 = 1.3 ± 0.2 ps for β-furfural. The maximum time-zero shift ts for the 267 nm spectra is 50 ± 10 fs for furfural and 30 ± 10 fs for β-furfural. In the 200 nm spectra no shift is observed, which is likely caused by the wavepacket being temporarily trapped on the less steep, excited-state surface in the longer process connected to τ2.
The spectral structures show distinct peaks, but with different patterns for the two pump pulses. They can be explained by the corresponding He(I)-ionization spectra which exhibit a comparable structure.29 This is exemplified in the ESI† (see Fig. S1) on furfural. The strong peak at 0.7 eV in the 267 nm spectrum using a two photon probe scheme has been attributed to an ionization from the nO orbital of the aldehyde group.29 This state is called nO ionized state from here on. In the 200 nm spectrum the 0.7 eV peak is missing.
In addition the short lifetime τ1 only appears for the excitation with the 267 nm pump. At this wavelength, the first excited ππ* state, S2(ππ*), is populated for both molecules, while the 200 nm pulse should populate both, S2(ππ*) and S5(ππ*) (see Fig. 8).
This means that an additional pathway opens when the reaction is started directly from the S2(ππ*) state and is not reached from the higher lying S3 and S5 state. As both, τ1 and τ2, can be observed over the whole spectrum, two separate relaxation pathways must exist. One of them corresponds to the one identified in furan, which is the pathway through the CoIn seam connecting CoInp and CoIno. Based on the reasoning from quantum chemistry given below, the other is assigned to CoInn, which is not included in this seam. CoInn mediates the relaxation involving the nOπ* state (see Fig. 9).
After photoexcitation with either pump pulse the valence electrons of furfural and β-furfural are in a πnO2π* configuration. This configuration remains when the systems follow the relaxation path towards the CoIn seam (Fig. 9, blue). Photoionization of the outer electron will dominantly lead to a πnO2 configuration. When the other pathway towards CoInn is chosen (Fig. 9, red), the electronic character changes from πnO2π* to π2nOπ*. Photoionization of the outer electron will now result in a π2nO configuration, which corresponds to the nO ionized state. Consequently τ1 is assigned to the relaxation via the nOπ* state.
The participation of the nOπ* state is also indicated by on-the-fly dynamics, where it gets partially populated. Keeping in mind the performance of CASSCF in the FC region, however, this can only be seen as a supportive indication. For the same reason, the corresponding S2/S1 CoIns could not be optimized in a meaningful way.
7 Conclusions
The deactivation process of photoexcited furan and two of its derivates, furfural and β-furfural were studied by time-resolved photoelectron spectroscopy and by quantum chemical calculation. The systems were selected to investigate the effect of substituents on the dynamics with furan taken as reference system. Using a high intensity probe pulse, the relaxation of furan from the FC region back to the ground state could be monitored through a two photon probe process. An excited state lifetime of 60 ± 15 fs could be assigned to the time in which the molecule accesses the region of the CoIns to the ground state. A second time of 110 ± 25 fs is assigned to the decay of the excited state which is mediated via the CoIn seam connecting the ring opening and ring puckering CoIns. The relaxation of furfural and β-furfural happens on a much slower timescale and, depending on the wavelength of the pump pulse, one or two lifetimes are found. Interestingly, for both molecules the pulse with the lower energy leads to the additional, shorter time constant. Quantum chemical calculations performed on CASSCF, CASPT2 and CCSD level of theory, assign the short life time to a deactivation via the nOπ* state, which is related to the aldehyde group and thus not available in furan.The general slowdown of the relaxation process from furan to its derivates can also be explained by the aldehyde group introduced at different positions of the furan ring. It lowers the excitation energy in the FC region due to the extension of the π system, but it hardly effects the position of the CoIns with respect to the ground state minimum. Due to the structural deformation at the CoIns, the extension of the π system is removed. This is the dominant effect which defines the relative energies between ground state minimum, FC point and the CoIns. The two-electron two-orbital model successfully predicted the structural changes for CoInp of the puckering pathway when going from furan to its derivates. The degree to which a hydrogen atom is bent beneath the ring has, however, only minor energetic effects. In molecules where the deformation has larger sterical consequences and the substituent position has less, even the energetic position of the CoIn on the potential energy surface should be predictable.
Acknowledgements
We thank P. Limão-Vieira for sending us the data of their He(I) photoelectron spectrum of furfural used for Fig. S1 in the ESI† [Jones et al., J. Chem. Phys., 2015, 143, 184310] and acknowledge the generous support and technical advice of Prof. Dr Raimund Feifel. RDVR and SO acknowledge financial support by the Deutsche Forschungsgemeinschaft through the SFB749 and the excellence cluster Munich-Centre for Advanced Photonics (MAP) and thank Florian Rott and Daniel Keefer for carrying out first test calculations. OS would like to thank the Lars Hiertas Minne Foundation for a research grant. OS, TG, RT and TH acknowledge support from the Swedish Research Council and the Knut and Alice Wallenberg Foundation.References
- A. Nenov and R. de Vivie-Riedle, J. Chem. Phys., 2011, 135, 034304 CrossRef PubMed.
- A. Nenov and R. de Vivie-Riedle, J. Chem. Phys., 2012, 137, 074101 CrossRef PubMed.
- A. Nenov, W. J. Schreier, F. Koller, M. Braun, R. de Vivie-Riedle, W. Zinth and I. Pugliesi, J. Phys. Chem. A, 2012, 116, 10518–10528 CrossRef CAS PubMed.
- M. Stenrup and A. Larson, Chem. Phys., 2011, 379, 6 CrossRef CAS.
- N. Gavrilov, S. Salzmann and C. M. Marian, Chem. Phys., 2008, 349, 269–277 CrossRef CAS.
- T. Fuji, Y.-I. Suzuki, T. Horio, T. Suzuki, R. Mitrić, U. Werner and V. Bonačić-Koutecký, J. Chem. Phys., 2010, 133, 234303 CrossRef PubMed.
- R. Spesyvtsev, T. Horio, Y.-I. Suzuki and T. Suzuki, J. Chem. Phys., 2015, 143, 014302 CrossRef CAS PubMed.
- E. V. Gromov, C. Lévêque, F. Gatti, I. Burghardt and H. Köppel, J. Chem. Phys., 2011, 135, 164305 CrossRef CAS PubMed.
- E. V. Gromov, V. S. Reddy, F. Gatti and H. Köppel, J. Chem. Phys., 2013, 139, 234306 CrossRef CAS PubMed.
- T. J. A. Wolf, T. S. Kuhlman, O. Schalk, T. J. Martínez, K. B. Møller, A. Stolow and A.-N. Unterreiner, Phys. Chem. Chem. Phys., 2014, 16, 11770–11779 RSC.
- O. Schalk, M. S. Schuurman, G. Wu, P. Lang, M. Mucke, R. Feifel and A. Stolow, J. Phys. Chem. A, 2014, 118, 2279–2287 CrossRef CAS PubMed.
- O. Schalk, M. Stenrup, T. Geng, R. Lindh, R. D. Thomas, R. Feifel and T. Hansson, J. Phys. Chem. A, 2015, 119, 11105 CrossRef CAS PubMed.
- O. Schalk, A. E. Boguslavskiy and A. Stolow, J. Phys. Chem. A, 2010, 114, 4058–4064 CrossRef CAS PubMed.
- O. Schalk, T. Geng, T. Thompson, N. Baluyot, R. D. Thomas, E. Tapavicza and T. Hansson, J. Phys. Chem. A, 2016, 120, 2320 CrossRef CAS PubMed.
- P. O. Widmark, P. A. Malmqvist and B. Roos, Theor. Chim. Acta, 1990, 77, 291 CrossRef CAS.
- D. Feller, J. Comput. Chem., 1996, 17(13), 1571 CrossRef CAS.
- K. L. Schuchardt, B. T. Didier, T. Elsethagen, L. Sun, V. Gurumoorthi, J. Chase, J. Li and T. L. Windus, J. Chem. Inf. Model., 2007, 47(3), 1045 CrossRef CAS PubMed.
- F. Aquilante, J. Autschbach, R. K. Carlson, L. F. Chibotaru, M. G. Delcey, L. D. Vico, I. F. Galván, N. Ferré, L. M. Frutos, L. Gagliardi, M. Garavelli, A. Giussani, C. E. Hoyer, G. L. Manni, H. Lischka, D. Ma, P. A. Malmqvist, T. Müller, A. Nenov, M. Olivucci, T. B. Pedersen, D. Peng, F. Plasser, B. Pritchard, M. Reiher, I. Rivalta, I. Schapiro, J. Segarra-Martí, M. Stenrup, D. G. Truhlar, L. Ungur, A. Valentini, S. Vancoillie, V. Veryazov, V. P. Vysotskiy, O. Weingart, F. Zapata and R. Lindh, J. Comput. Chem., 2016, 37, 506–541 CrossRef CAS PubMed.
- H.-J. Werner, P. J. Knowles, G. Knizia, F. R. Manby, M. Schütz, P. Celani, T. Korona, R. Lindh, A. Mitrushenkov, G. Rauhut, K. R. Shamasundar, T. B. Adler, R. D. Amos, A. Bernhardsson, A. Berning, D. L. Cooper, M. J. O. Deegan, A. J. Dobbyn, F. Eckert, E. Goll, C. Hampel, A. Hesselmann, G. Hetzer, T. Hrenar, G. Jansen, C. Köppl, Y. Liu, A. W. Lloyd, R. A. Mata, A. J. May, S. J. McNicholas, W. Meyer, M. E. Mura, A. Nicklass, D. P. O'Neill, P. Palmieri, D. Peng, K. Pflüger, R. Pitzer, M. Reiher, T. Shiozaki, H. Stoll, A. J. Stone, R. Tarroni, T. Thorsteinsson and M. Wang, MOLPRO, version 2012.1, a package of ab initio programs, 2012, see http://www.molpro.net/ Search PubMed.
- H.-J. Werner, P. J. Knowles, G. Knizia, F. R. Manby and M. Schütz, Wiley Interdiscip. Rev.: Comput. Mol. Sci., 2012, 2, 242–253 CrossRef CAS.
- M. Barbatti, G. Granucci, M. Ruckenbauer, F. Plasser, R. Crespo-Otero, J. Pittner, M. Persico and H. Lischka, NEWTON-X: a package for Newtonian dynamics close to the crossing seam, version 1.4, 2014, http://www.newtonx.org/ Search PubMed.
- M. Barbatti, M. Ruckenbauer, F. Plasser, J. Pittner, G. Granucci, M. Persico and H. Lischka, Wiley Interdiscip. Rev.: Comput. Mol. Sci., 2014, 4, 26 CrossRef CAS.
- B. P. Fingerhut, S. Oesterling, K. Haiser, K. Heil, A. Glas, W. J. Schreier, W. Zinth, T. Carell and R. de Vivie-Riedle, J. Chem. Phys., 2012, 136, 204307 CrossRef PubMed.
- S. Hammes-Schiffer and J. C. Tully, J. Chem. Phys., 1994, 101, 6 Search PubMed.
- D. Feller, J. Comput. Chem., 1996, 17(13), 1571–1586 CrossRef CAS.
- K. L. Schuchardt, B. T. Didier, T. Elsethagen, L. Sun, V. Gurumoorth, J. Chase, J. Li and T. L. Windus, J. Chem. Inf. Model., 2007, 47(3), 1045–1052 CrossRef CAS PubMed.
- V. Bonačić-Koutecký, J. Köhler and J. Michl, Chem. Phys. Lett., 1984, 104, 440 CrossRef.
- V. Bonačić-Koutecký, J. Koutecký and J. Michl, Angew. Chem., Int. Ed., 1987, 26, 170 CrossRef.
- D. B. Jones, E. Ali, K. L. Nixon, P. Limão-Vieira, M.-J. Hubin-Franskin, J. Delwiche, C. G. Ning, J. Colgan, A. J. Murray, D. H. Madison and M. J. Brunger, J. Chem. Phys., 2015, 143, 184310 CrossRef CAS PubMed.
Footnotes |
| † Electronic supplementary information (ESI) available. See DOI: 10.1039/c6cp06240g |
| ‡ Note, that the problems with the Rydberg influences, mentioned later, neither affect the ground state in the FC-region, nor the degenerate states in the region of the S1/S0 CoIns. |
| § Even though the simulations likely misjudge the exact ratio between the pathways in furan, any alteration of one channel should lead to the same qualitative change in experiment and theory. |
| ¶ To facilitate the comparison at all, a set of CCSD-calculations was started from the CAS-orbitals. This hardly affected the energies but greatly helped with the interpretation of the CI vectors. |
| This journal is © the Owner Societies 2017 |


