
Correlation of dielectric, electrical and magnetic properties near the magnetic phase transition temperature of cobalt zinc ferrite
Dhiren K.
Pradhan
*a,
Shalini
Kumari
a,
Venkata S.
Puli
b,
Proloy T.
Das
c,
Dillip K.
Pradhan
d,
Ashok
Kumar
e,
J. F.
Scott
f and
Ram S.
Katiyar
*a
aDepartment of Physics and Institute of Functional Nanomaterials, University of Puerto Rico, San Juan-00936, PR, USA. E-mail: dhirenkumarp@gmail.com; rkatiyar@hpcf.upr.edu
bDepartment of Physics and Engineering Physics, Tulane University, New Orleans, LA-70118, USA
cDepartment of Physics, Indian Institute of Technology, Kharagpur-721302, India
dDepartment of Physics & Astronomy, National Institute of Technology, Rourkela-769008, India
eNational Physical Laboratory (CSIR), Delhi, India
fDepartment of Chemistry and Department of Physics, University of St. Andrews, St. Andrews KY16 ST, UK
First published on 16th November 2016
Abstract
Multiferroic composite structures, i.e., composites of magnetostrictive and piezoelectric materials, can be envisioned to achieve the goal of strong room-temperature ME coupling for real practical device applications. Magnetic materials with high magnetostriction, high Néel temperature (TN), high resistivity and large magnetization are required to observe high ME coupling in composite structures. In continuation of our investigations on suitable magnetic candidates for multiferroic composite structures, we have studied the crystal structure, dielectric, transport, and magnetic properties of Co0.65Zn0.35Fe2O4 (CZFO). Rietveld refinement of X-ray diffraction patterns confirms the phase purity with a cubic crystal structure with the (Fd![[3 with combining macron]](https://www.rsc.org/images/entities/char_0033_0304.gif) m) space group; however, we have found a surprisingly large magneto-dielectric anomaly at the Néel temperature, unexpected for a cubic structure. The presence of mixed valences of Fe2+/Fe3+ cations is probed by X-ray photoelectron spectroscopy (XPS), which supports the catonic ordering-mediated large dielectric response. Large dielectric permittivity dispersion with a broad anomaly is observed in the vicinity of the magnetic phase transition temperature (TN) of CZFO suggesting a strong correlation between dielectric and magnetic properties. The evidence of strong spin-polaron coupling has been established from temperature dependent dielectric, ac conductivity and magnetization studies. The ferrimagnetic–paramagnetic phase transition of CZFO has been found at ∼640 K, which is well above room temperature. CZFO exhibits low loss tangent, a high dielectric constant, large magnetization with soft magnetic behavior and magnetodielectric coupling above room temperature, elucidating the possible potential candidates for multiferroic composite structures as well as for multifunctional and spintronics device applications.
m) space group; however, we have found a surprisingly large magneto-dielectric anomaly at the Néel temperature, unexpected for a cubic structure. The presence of mixed valences of Fe2+/Fe3+ cations is probed by X-ray photoelectron spectroscopy (XPS), which supports the catonic ordering-mediated large dielectric response. Large dielectric permittivity dispersion with a broad anomaly is observed in the vicinity of the magnetic phase transition temperature (TN) of CZFO suggesting a strong correlation between dielectric and magnetic properties. The evidence of strong spin-polaron coupling has been established from temperature dependent dielectric, ac conductivity and magnetization studies. The ferrimagnetic–paramagnetic phase transition of CZFO has been found at ∼640 K, which is well above room temperature. CZFO exhibits low loss tangent, a high dielectric constant, large magnetization with soft magnetic behavior and magnetodielectric coupling above room temperature, elucidating the possible potential candidates for multiferroic composite structures as well as for multifunctional and spintronics device applications.
Introduction
Magnetic materials have attracted considerable attention with intensive research and development due to their remarkably high electronic and magnetic properties, and have been widely used as electro-optic devices, ferrofluid-based rocket fuel, microwave devices, and in high-density information storage, magneto-optic recording and magnetic resonance imaging, drug delivery systems, etc.1–5 Among magnetic materials, ferrimagnets are often high Curie-temperature (TC) magnetic insulators having a non-zero magnetic moment along with spin-dependent band gaps that can be utilized in spintronics as well as in spin-caloritronics.6,7 The scarcity of room temperature single-phase multiferroics due to the frequent chemical incompatibility between magnetism and ferroelectricity, low magnetic critical temperatures, and/or weak magnetoelectric (ME) coupling has led researchers to design and develop artificial composite structures with magnetic components as insulating ferri/ferromagnetic materials.8–13 The combination of spinel ferrites with high magnetostriction, high resistivity, high magnetic phase transition temperature, and structural compatibility with ferroelectric perovskites has already proven to provide important strain-driven magnetoelectric magnetic field sensor devices.9,14–16 It is also known that the magnetic and electrical properties of the ferrites can be substantially manipulated by the substitution of non-magnetic ions. With the substitution of Cu, Zn, and Cr at A-sites, Ni and Co ferrites have usually been found to increase their electrical resistivity.9,17 Cobalt zinc ferrite (CZFO) is a soft magnetic material having high saturation magnetization, low coercivity, high resistivity, high magnetostriction coefficient and low dielectric loss, thus making it an attractive ferrimagnetic candidate for composite multiferroics.1,18–21 In the case of ferrites, the dielectric permittivities are increased due to the hopping of electrons or polarons between cationic sites. The oxidation states of cations and the cation distribution play a major role in the conduction process of ferrites. Hence, the origin of the high dielectric permittivity around the Néel temperature in CZFO needs to be investigated. When a conduction electron or polaron interacts with the magnetic moment of a transition metal ion, the coupling is best described by a spin-polaron model. In the present work we show a surprisingly strong magneto-dielectric anomaly at the Néel temperature in CZFO, despite the fact that it has global cubic symmetry.Different research groups have synthesized bulk and nanoparticles of cobalt zinc ferrite using different techniques such as high temperature solid state reaction and sol–gel, and have studied their dielectric, electrical and magnetic properties.20–24 Dey et al. have studied the structural, microstructural, magnetic, and hyperfine properties of nanosized Co0.2Zn0.8Fe2O4 synthesized by high energy ball milling.22 This compound exhibits high saturation magnetization (87 emu g−1) and the blocking temperature was found to be ∼220 K. Co1−xZnxFe2O4 (x = 0–0.8) nanoparticles were synthesized by Huang et al. using the coprecipitation technique. The saturation magnetization is found to decrease with increasing Zn content at 300 K also due to the excitation of superparamagnetism.23 The magnetic properties of Co1−xZnxFe2O4 (x = 0–0.8) nanoparticles synthesized using the combustion reaction method were studied by Franco et al. The Curie temperatures were determined by means of the inverse susceptibility versus temperature and they decrease with increasing x, being ∼787 K and ∼634 K for x = 0.0 and 1.0, respectively. The magnetic cubic anisotropy constant for different Zn-contents is also calculated by a “law of approach” to saturation.24
A detailed literature survey indicates that studies on the correlation of electrical and magnetic properties are limited.
Cobalt ferrites doped with various percentages of Zn exhibit multifunctional properties; therefore an in-depth understanding of the correlation of polarization and electrical conduction with spin dynamics is of great importance from both a fundamental and technological point of view.
The optimized ratio Co0.65Zn0.35Fe2O4 has been chosen for the present investigation since it exhibits the highest saturation magnetization with high magnetostriction in the entire cobalt–zinc series, having a high Curie temperature.17–19 In this report the correlation between the dielectric and magnetic behavior with the origin of high dielectric constant have been studied.
Experimental details
The polycrystalline ceramic samples Co0.65Zn0.35Fe2O4 were synthesized via a high-temperature solid-state reaction route using high-purity (99.9%) oxide precursors CoO, ZnO and Fe2O3 in the required stoichiometry. These ingredients were mixed with methanol, calcined at an optimized temperature of 1350 °C for 6 hours, and pelletized with a final sintering at 1400 °C for 10 h based on the literature available.18 An X-ray diffractometer (Rigaku Ultima III) was used to check the phase formation of the bulk samples equipped with a CuKα (λ = 1.54 Å) radiation source operating in the Bragg–Brentano geometry. The Rietveld structure refinement was performed on the experimental XRD data using FullProf Suite software. Scanning electron microscopy (SEM) images were collected with the help of a JEOL JSM-6480LV system. Raman spectroscopic measurements were carried out at room temperature using a Horiba Jobin Yvon T64000 Raman spectrometer. The temperature dependent dielectric parameters: capacitance, dissipation factor, impedance, and phase angles were measured using an impedance analyzer HP4294A with an MMR Technologies K-20 programmable temperature controller for a fixed ac voltage amplitude of 0.5 V in a wide frequency range of 100 Hz to 1 MHz. The elemental analysis of the fabricated pellets was performed via high-resolution X-ray photoemission spectroscopy (XPS). The magnetic properties of the samples were measured using a Quantum design PPMS Dynacool in a wide range of temperatures 300–800 K. The magneto-dielectric measurements were carried out using a magnet with a varying field of up to ±1.5 T and a HIOKI 3532-50 LCR Hi-tester at room temperature.Results and discussion
Fig. 1 shows the room temperature characteristic XRD patterns with sharp and well-defined peaks that illustrate the spinel structure. The Miller indices are assigned to the XRD peaks using the JCPDF file (JCPDS Card # 01-078-4452), and are in good agreement with the earlier reported results on the same systems.22–24 Impurity phases have not been detected in samples within the experimental XRD error limit, indicating the high quality of the synthesized material. In order to have a better understanding of the structural parameters of CZFO with the spinel phase (quantitatively and qualitatively), we have refined the experimental XRD patterns using a FULLPROF package with the space group (Fdm). There is close agreement between the experimental (symbols) and simulated data with a satisfactory chi square value of 1.648. We have taken care of many parameters, such as background, zero shift, specimen displacement, atomic positions, thermal factors, scale factor, lattice parameters, FWHM, and shape parameters during refinement. The lattice parameter of CZFO is found to be 8.4183 Å from the refinement, which matches well with previous reports.19,25 Using the obtained unit cell parameters and atomic positions, a three-dimensional sketch of the CZFO unit cell projected along the c-axis is shown in Fig. 1(b). The inset of Fig. 1(a) shows the surface topography image of a CZFO sintered pellet, which displays densely packed grains with few scattered pores and voids. Distinct micron-sized grains and related grain boundaries are clearly visible, homogenously distributed throughout the matrix.
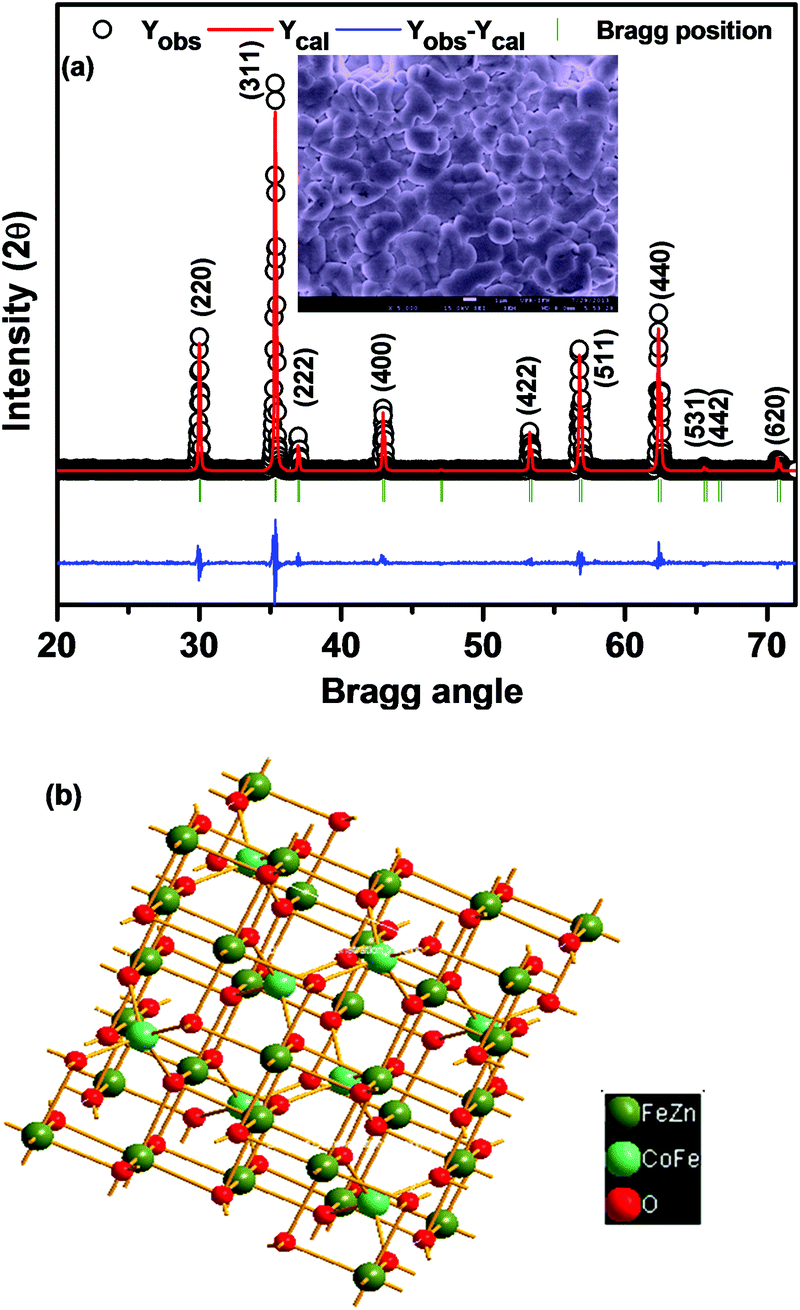 | ||
| Fig. 1 (a) Rietveld refinement of X-ray diffraction patterns and scanning electron micrograph (inset) of CZFO at room temperature. (b) Three-dimensional schematic sketch of the CZFO unit cell with a spinel structure at room temperature. | ||
For the further investigation of the formation of the material and cation disorder, Raman spectroscopic measurements have been performed at room temperature. Raman spectroscopy is a sensitive and nondestructive technique to investigate the complex structure of strongly correlated electron systems such as ferroelectric, magnetic and multiferroic materials with compositional and structural disorder. As stated above, the crystal structure of CZFO is cubic with Fdm space group symmetry and the unit cell contains 56 atoms. The smallest Bravais cell in this symmetry consists of 2 formula units with 14 atoms. The group theory analysis of Fdm crystal symmetry with a cubic structure predicts zone centre phonons by the following irreducible representations:26
| Γ = A1g(R) + Eg(R) + T1g + 3T2g(R) + 2A2u + 2Eu + 4T1u(IR) + 2T2u | (1) |
From the above equation, it is clear that five first-order Raman active modes (A1g + Eg + 3T2g) are expected in ferrites under ambient conditions.26,27 In our case, we observed only four Raman modes in CZFO. Note that the appearance of a smaller number of Raman modes in CZFO over the predicted five modes could be due to the polycrystalline nature of the sample. All four observed modes, i.e. Eg, T2g(2), T2g(3), and A1g have been assigned based on the previous reports.26 In spinel ferrites it is well known that the modes above 600 cm−1 belong to the motion of the oxygen atoms in the tetrahedral AO4 groups, whereas frequencies below 600 cm−1 belong to the motion of the oxygen atoms in the octahedral BO6 group.26,30 The schematic diagram shown in Fig. 2(a) represents the unit cell along with the FeO6 octahedral and BO4 tetrahedral sites of CZFO. The Raman spectra of pure CoFe2O4 and CZFO are shown in Fig. 2(b). Lorentzian peak functions have been used to fit all of the observed Raman modes, and the Raman spectra can be best fitted by five distinct peaks. It is observed that the peak positions of the T2g(1), T2g(2) and A1g of CZFO show a significant red shift compared to pure CoFe2O4. As indicated above, the peaks of A1g symmetry belong to the motion of oxygen atoms in the tetrahedral AO4 group. In our case Zn has been substituted in Co at the A site. Hence it is expected that the phonon frequencies related to the A site oxygen atom (i.e. those of A1g symmetry) should be red shifted (as Zn has a higher atomic mass and ionic radii than Co). However, it is also found that some of the peaks related to oxygen motion (T2g(1) and T2g(2)) associated with the B site (Fe) show a noticeable red-shift. The possible reason for the observed red shift of T2g(1) and T2g(2) could be the high temperature sintering of CZFO to obtain the pure phase. It is evident that at such a high temperature, Zn vacancies are formed in the crystal lattice. To compensate the loss of Zn, some of the Fe3+ ions from the B site reduce to Fe2+ ions, which eventually hop to the Zn site. After hopping of the central Fe ions to the A sites from their initial stable configurations, the local system is no longer in equilibrium with its neighbors. In order to stabilize the new position of the ions, other surrounding ions have to move accordingly. This hopping process will have a significant impact on the vibrational frequencies of the normal modes of the associated octahedral BO6 site.30 The proposed hopping process is also supported via XPS and conductivity studies which will be discussed in the following sections. Note that this hopping of ions leads to the existence of both Fe2+ and Fe3+ in the matrix, which increases dielectric permittivity.
 | ||
| Fig. 2 (a) Representation of the CZFO unit cell along with the FeO6 octahedral and BO4 tetrahedral sites. (b) The fitted Raman spectra of pure CoFe2O4 and CZFO at 300 K with the Lorentzian function using a peak-fit program. | ||
Fig. 3(a) shows the variation of relative dielectric permittivity (εr) and loss tangent (tan![[thin space (1/6-em)]](https://www.rsc.org/images/entities/char_2009.gif) δ (in inset)) as functions of temperatures at different frequencies. The magnitude and dispersion of dielectric permittivity remain nearly constant up to 500 K, and thereafter increase with an increase in temperature. The dielectric constant and loss tangent are sensitive to probe frequencies, where low frequencies (<10 kHz) significantly influence the nature and magnitude of the dielectric constant with an increase in temperature. In general, the dielectric permittivity in solids is mainly due to four types of polarizations: (i) space charge/interfacial polarization at grain boundaries and electrodes; (ii) dipolar polarization, such as that due to neighboring Fe2+/Fe3+ ion pairs; (iii) atomic polarization (shifts of single ions, due to strain or vacancies); and (iv) electronic polarization.28,29 The interfacial and dipolar polarizations are strongly temperature dependent under the present probe range of frequencies. The CZFO suffers Zn loss during high temperature sintering and calcination, resulting in vacancies and partially charged oxygen ions; electrons at oxygen sites bond with the neighboring Fe3+ ions, which gives rise to Fe2+ ions.30,31 Hence due to the high-temperature synthesis process, both Fe2+ and Fe3+ naturally develop in the matrix, which is further confirmed by our XPS analysis. The existence of Fe2+ cations and oxygen anions gives rise to excess thermally activated mobile charge carriers which hop among various charge-trap sites.32 As a result, Fe2+ and Fe3+ form a dipole-type polarization, which significantly increases the dielectric permittivity. So the dielectric permittivity increases due to the hopping of thermally activated charge carriers.23 Active hopping among the polarons and electrons becomes frozen at low temperatures, significantly lowering dielectric loss and electric conductivity. Electron hopping is activated with the increase in temperature due to lattice vibrations, leading to polaron hopping.21 These factors lead to an increase in the dielectric constant and loss tangent with an increase in temperature. This behavior is well correlated with the variation of the polarizability obtained from the frequency dependent ac conductivity of this material, which will be discussed below (in particular, A(T), the coefficient in the equation below). We note that εr increases gradually with the increase of temperature to its maximum value and then decreases. This is wholly unexpected and not due to ordinary thermal effects. We find a broad anomaly at 600–700 K. A broad ferrimagnetic transition has also been observed in this temperature range, which suggests that there is a strong spin-polaron coupling in this material. Further confirmation of this spin-polaron coupling is discussed below in terms of temperature dependent conductivity and magnetic behavior.
δ (in inset)) as functions of temperatures at different frequencies. The magnitude and dispersion of dielectric permittivity remain nearly constant up to 500 K, and thereafter increase with an increase in temperature. The dielectric constant and loss tangent are sensitive to probe frequencies, where low frequencies (<10 kHz) significantly influence the nature and magnitude of the dielectric constant with an increase in temperature. In general, the dielectric permittivity in solids is mainly due to four types of polarizations: (i) space charge/interfacial polarization at grain boundaries and electrodes; (ii) dipolar polarization, such as that due to neighboring Fe2+/Fe3+ ion pairs; (iii) atomic polarization (shifts of single ions, due to strain or vacancies); and (iv) electronic polarization.28,29 The interfacial and dipolar polarizations are strongly temperature dependent under the present probe range of frequencies. The CZFO suffers Zn loss during high temperature sintering and calcination, resulting in vacancies and partially charged oxygen ions; electrons at oxygen sites bond with the neighboring Fe3+ ions, which gives rise to Fe2+ ions.30,31 Hence due to the high-temperature synthesis process, both Fe2+ and Fe3+ naturally develop in the matrix, which is further confirmed by our XPS analysis. The existence of Fe2+ cations and oxygen anions gives rise to excess thermally activated mobile charge carriers which hop among various charge-trap sites.32 As a result, Fe2+ and Fe3+ form a dipole-type polarization, which significantly increases the dielectric permittivity. So the dielectric permittivity increases due to the hopping of thermally activated charge carriers.23 Active hopping among the polarons and electrons becomes frozen at low temperatures, significantly lowering dielectric loss and electric conductivity. Electron hopping is activated with the increase in temperature due to lattice vibrations, leading to polaron hopping.21 These factors lead to an increase in the dielectric constant and loss tangent with an increase in temperature. This behavior is well correlated with the variation of the polarizability obtained from the frequency dependent ac conductivity of this material, which will be discussed below (in particular, A(T), the coefficient in the equation below). We note that εr increases gradually with the increase of temperature to its maximum value and then decreases. This is wholly unexpected and not due to ordinary thermal effects. We find a broad anomaly at 600–700 K. A broad ferrimagnetic transition has also been observed in this temperature range, which suggests that there is a strong spin-polaron coupling in this material. Further confirmation of this spin-polaron coupling is discussed below in terms of temperature dependent conductivity and magnetic behavior.
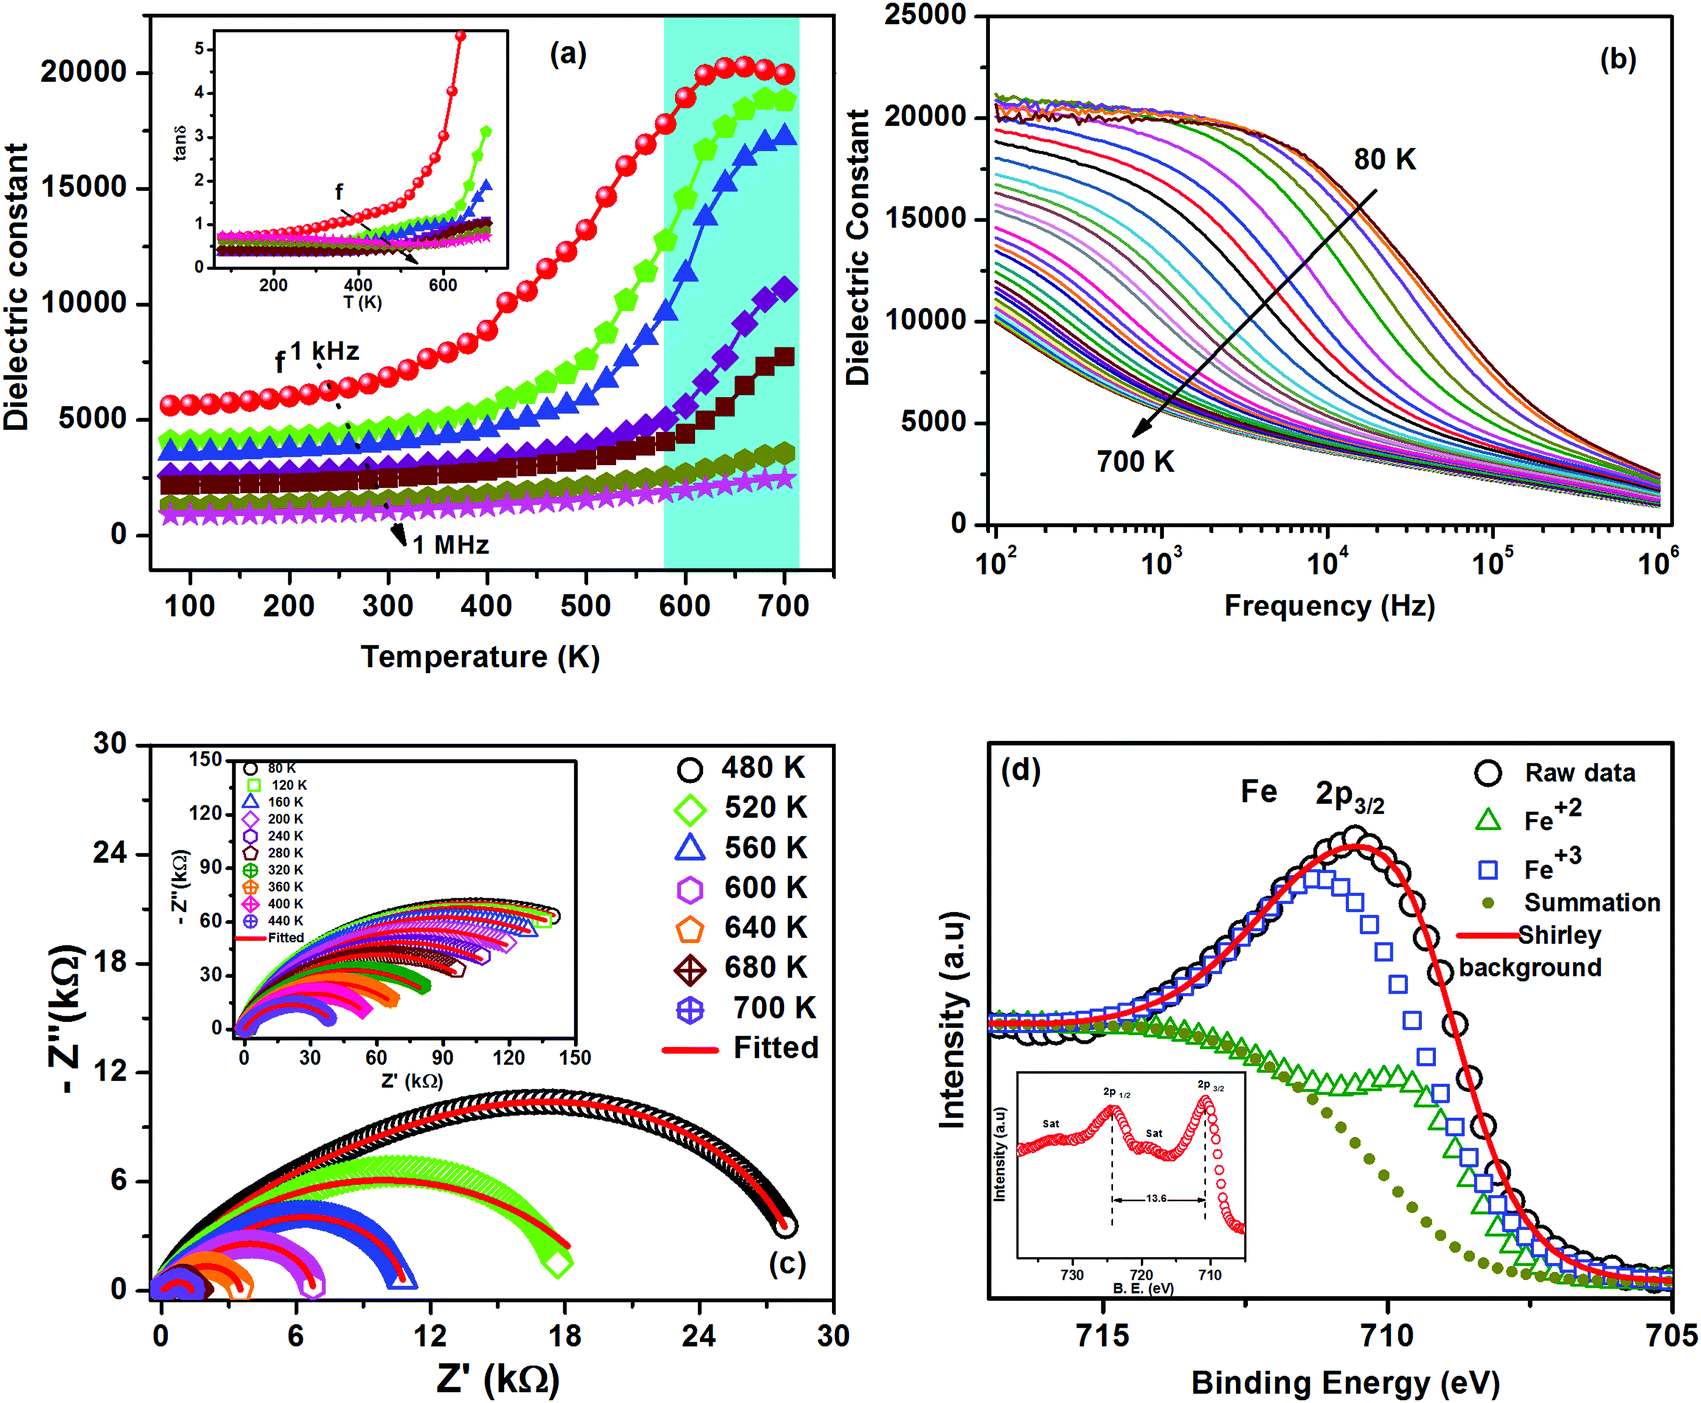 | ||
| Fig. 3 (a) Temperature dependence of relative dielectric permittivity and loss tangent (inset) at different frequencies. (b) Frequency dependence of dielectric permittivity in a wide temperature range. (c) Fitted complex impedance spectra (Nyquist-plots) at 480–700 K and at 80–440 K (inset). (d) Fitted XPS spectra of Fe 2p3/2 and XPS spectra of Fe (inset) in CZFO at room temperature. | ||
In order to clarify the origin of such a high dielectric constant in CZFO, the variation of dielectric constant with frequency (log–log scale) throughout the temperature range of investigation is depicted in Fig. 3(b). At low temperature there is a strong dispersion in the dielectric constant followed by a weak dielectric relaxation behavior. The weak relaxation behavior is found to be above 100 kHz at 80 K and the peak of the relaxation behavior shifted towards the high frequency side with the increase in temperature; for higher temperatures it goes beyond the window of the frequency range of investigation. In the high temperature regime the frequency dependent dielectric spectra are also characterized by a step-like relaxation behavior in the low frequency region. This step-like behavior shifts towards the high frequency side with the increase in temperature. The step-like behavior in the low frequency region along with the high frequency dispersion region is observed in many high dielectric constant materials such as CCTO.33 The dielectric dispersion, step-like behavior in frequency dependent dielectric properties and the high tangent loss in the low frequency region can be attributed to interfacial/space charge polarization of the materials.22 Assuming that the CZFO material is a heterogeneous electrical microstructure with the grain and grain boundary having different electrical conductivities, the frequency dependent dielectric behavior can be explained on the basis of the Maxwell–Wagner theory of interfacial polarization in consequence with Koops' phenomenological theory.34 According to Koops' theory in conjunction with the classical brick layer model (BLM), the grain and grain boundary are supposed to have different conductivities and to be connected in series with each other, which gives rise to a high dielectric constant and step-like dispersion. In fact, in the ferrite systems, this conductivity inhomogeneity due to the grain and grain boundary gives rise to a different charge hopping process i.e., a different hopping process due to the grain and grain boundary. So the collective mechanism such as conductivity in homogeneity leads to different hopping processes and accumulation of charge carriers at the boundaries, which in turn lead to the high dielectric constant and steps in frequency dependent dielectric properties.35
In order to verify the presence of the grain and grain boundary contribution to the observed high dielectric constant in CZFO, complex impedance spectra (Nyquist-plots) at different temperatures are shown in Fig. 3(c). The Nyquist plot normally comprises a single semicircular arc at low temperatures with the center often below the real axis suggesting the departure from an ideal Debye nature (CPE – constant phase elements). At low temperatures (up to 440 K) one semicircular arc has been observed, whereas at higher temperatures two semicircular arcs have been observed. The two observed overlapping semicircular arcs at high temperatures are due to the contribution of the grain (bulk) and grain boundary to the electrical properties of CZFO. It is well known that an equivalent circuit can be used in impedance spectroscopy analysis to establish the structure–property relationship of materials. Here, up to 440 K, one semicircular arc of the impedance spectra has been modeled to an equivalent circuit of a resistance (grain resistance) and a CPE connected in parallel. Above 440 K, two overlapping semicircular arcs of the impedance spectra have been modeled to an equivalent circuit containing (i) a resistance (grain resistance) and a CPE connected in parallel, (ii) a parallel combination of a resistance (grain boundary resistance) and a CPE and all these connected in series. Fig. 3(c) shows the Nyquist plots (symbols) with fitted data (solid red line) utilizing ZSimp Win Version 2 software for CZFO at various temperatures. We found close agreement between the experimental and fitted data, which verifies the appropriateness of choosing this circuit.
It can be further noted that the dielectric constant of CZFO is found to be higher due to the large grain size. For a higher grain size there exist large differences between the grain and the grain boundary resistances, which increase the polarization and hence the dielectric constant. As can be seen from the SEM micrograph, the grain size is large (5–10 μm) due to a higher sintering temperature, which might be one reason for the high dielectric constant observed in CZFO.
In order to further understand the origin of the enhanced dielectric constant of these samples, further high-resolution XPS measurements have been carried out to determine the oxidation states of Co, Fe, Zn and O. The photoelectron characteristic peaks of Co 2p3/2(781.03), Co 2p1/2(796.53), Zn 2p3/2 (1021.7), Zn 2p1/2 (1044.7), Fe 2p3/2(710.78), Fe 2p1/2(724.38), and O 1s(530.30) were observed in the high-resolution XPS spectra, which are in agreement with the reported values.36 The Fe 2p3/2 structure can be deconvoluted into two peaks that confirm the existence of two valence states of Fe elements (Fe2+ and Fe3+) in CZFO, as shown in Fig. 3(d). The inset of Fig. 3(d) shows the full XPS spectra of Fe with two satellite peaks. The coexistence of Fe2+ and Fe3+ occurs because of the cation vacancies and partially charged oxygen ions due to the loss of Zn during the high temperature synthesis. As a consequence, the occurrence of Fe 2p ions gives rise to electron hopping between the Fe ions in the 2+ and 3+ states. The coexistence of Fe2+ and Fe3+ dipoles results in orientational polarization, which is one probable reason for the enhancement of the dielectric constant. In our case the Fe3+ ions predominate at a lower temperature, contributing to the increase in the dielectric constant with temperature.21–23
Fig. 4(a) shows the variation of ac conductivity with frequency at different temperatures. The ac electrical conductivity (σac) has been calculated from the dielectric data using the empirical relationship; σac = ωεrε0tanδ, where ω, ε0, εr, and tanδ are the angular frequency, permittivity in free space, relative permittivity, and loss tangent, respectively.22 At low temperatures (below 240 K), ac conductivity increases with the increase in frequency throughout the frequency range of investigation. At higher temperatures the ac conductivity spectra are characterized by the appearance of a frequency-independent plateau at lower frequencies and frequency dispersion at higher frequencies, (ωn dependence of conductivity). This type of frequency dependent conductivity spectra in general can be explained by Jonscher's power law,37 governed by the equation σac = σdc + A(T)ωn. Here σdc is the dc conductivity (a frequency independent plateau in the low frequency region); A(T), the temperature dependent frequency pre-exponential factor; and n, the power law exponent which generally varies between 0 and 1. We have fitted the ac conductivity spectra using Jonscher's single power law, and there is close agreement between the experimental and fitted data, as shown in the inset of Fig. 4(a) typically for 80 K. The conductivity spectra have been fitted for all temperatures, and the fitted parameters σdc, A, and n are plotted versus temperature. Actually n should be equal to 0 if the carriers are free to drift through the ceramic body. As in our case the n values vary from 0.5 to 0.9, which clearly indicates that the motion of these charges occurs not only due to conduction but also due to considerable polarization. It is a typical feature of localized polarons in most disordered systems. These polarons move upon inducing polarization.27,29
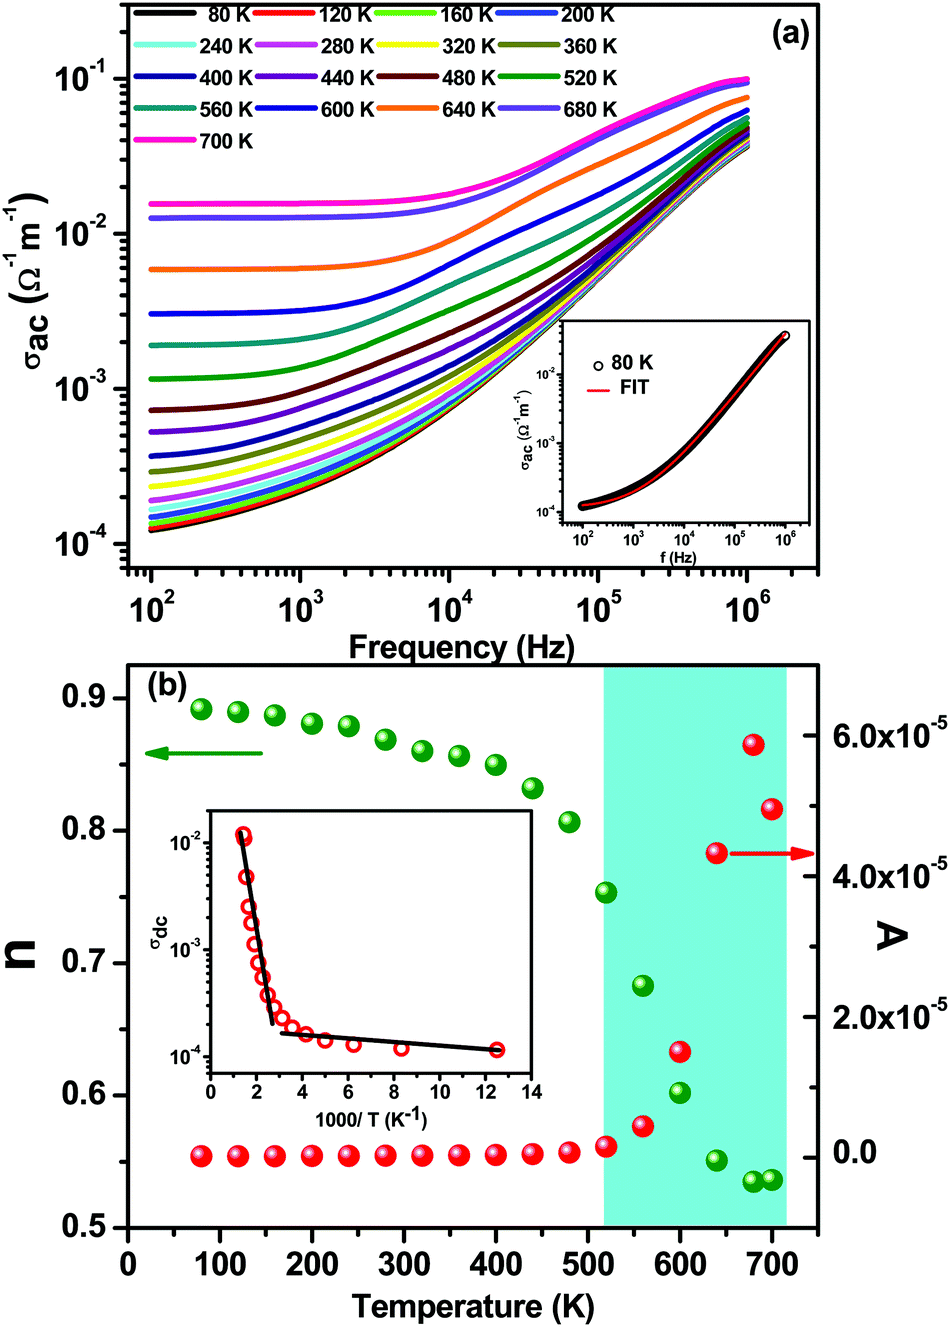 | ||
| Fig. 4 (a) Frequency dependence of ac conductivity at different temperatures and fitted ac conductivity plot at 80 K (inset). (b) Temperature dependence of n and A with the temperature dependence of dc conductivity (inset). | ||
Fig. 4(b) shows the variation of A and n as a function of temperature. It has been observed that the value of n decreases slowly with an increase in temperature up to 500 K and thereafter decreases rapidly near the magnetic phase transition temperature. In contrast, the behavior of A is completely opposite to the behavior of n: with an increase in temperature the value of A is nearly constant up to 500 K and thereafter suddenly increases. The degree of interaction between the mobile ions with the lattice is represented by the exponent n, where n = 1 implies pure Debye-type dielectric behavior, and where the interaction between the neighboring dipoles is almost negligible: i.e., the charge carriers are free to migrate through the ceramic body.38 At low temperatures the interactions between the mobile ions are negligible as the value of n is around 0.9. With an increase in temperature the value of n is almost constant up to ∼500 K and then decreases sharply to 0.5, which indicates that the interaction increases, presumably due to some disorder. The fitted value of n was found to be nearly 0.5 in the temperature range of 500 to 700 K, which implies fast hopping mobile charge carriers and random distributions of localized charge states. This indicates that the mobility of the charge carriers not only enhances conduction but also considerably increases polarization. This type of behavior has been observed in disorder systems due to localized polarons.39,40 The temperature dependent n-plot and the magnetization-temperature plot follow a similar trend: n(T) and magnetic moment drop drastically in the temperature range of 500–700 K, which suggests strong phonon–magnon interactions. The pre-exponential factor A(T) determines the strength of the polarizability.41 The increase in the value of A(T) with an increase in temperature establishes the increase in polarizability and hence dielectric properties. The temperature dependent behavior of A is quite similar to the variation of the temperature dependent dielectric properties.
The variation of dc conductivity (obtained after fitting the ac conductivity spectra) with inverse temperature is shown in the inset of Fig. 4(b). With the increase in temperature the dc conductivity increases slowly up to 400 K, thereafter increasing rapidly. The temperature dependent conductivity can be divided into two regions having different slopes. We have calculated the activation energy from the plot above. The values of activation energy for high and low temperatures are found to be Ea = 0.25 eV and 0.03 eV, respectively, suggesting an active role of interfacial activated electronic charge carriers in the conduction process, which has been explained on the basis of small polaron hopping.21–23,29
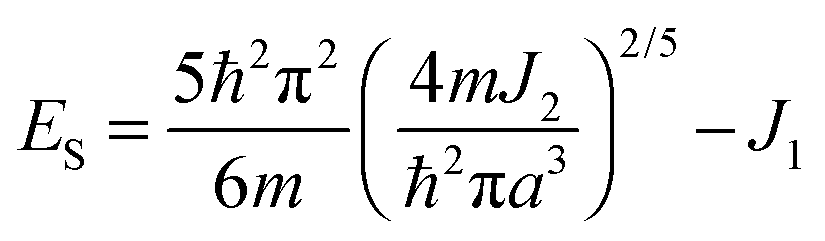
The observed behavior of high dielectric constant around transition temperature can be explained by a spin-polaron model. According to this equation, the total energy is
 | (2) |
In order to verify the existence of magnetic order and to understand the spin dynamics, dc-magnetization measurements as a function of temperature M(T) and magnetic field dependence M(H) have been carried out, as shown in Fig. 5. The M(T) measurements have been done in the out-of-plane (magnetic field perpendicular to disc/pellet plane) configuration by PPMS under 100 and 1000 Oe external magnetic fields in the temperature range of 300–800 K, as shown in Fig. 5(a). The M(T) measurements are recorded at two different modes: zero-field-cooling (ZFC) and field-cooling (FC). CZFO shows a faint bifurcation or hysteresis in M–T data down to 300 K at 100 Oe, which is very common in slightly disordered ferromagnetic systems. However, the bifurcation is smeared out at higher fields of 1000 Oe (as shown in the inset of Fig. 5(a)), independent of the direction between the applied field and the disc plane. Usually magnetic FC–ZFC bifurcation signifies the presence of magnetic instability (or rather metastability) and can be attributed to spin freeze-out. It indicates the presence of magnetic phase crossover and chemical inhomogeneity in the system.43–47 From Fig. 5(a) it is observed that magnetization remains nearly constant up to 500 K and above that decreases with the increase of temperature and vanishes above ∼700 K. In CZFO the estimated ferrimagnetic–paramagnetic transition temperature TC is around 640 K (±10 K) with a broad transition up to 700 K, which reveals the existence of a short-range spin interaction. Fig. 5(b) shows the magnetic hysteresis M(H) behavior of a CZFO sample at different temperatures up to 40 kOe. It is evident that perfect saturation down to a low temperature even for 2 kOe is observed, which is a typical signature of ferro/ferrimagnetic behavior. However, a squarer shape develops with an increase in temperature. The shapes of the curves show that the initial magnetization rapidly grows in the low-field regime (<2 kOe); however, at high fields the magnetization growth becomes weaker and tends to saturate. The maximum estimated saturation magnetization (Ms) of the sample at 300 K is 119 emu g−1 and gradually decreases with the increase of temperature and completely disappears above 700 K. M(H) curves also show decreases in remnant magnetization (Mr) and the coercive field with the increase in temperature. The observed high Ms and low Hc indicate the soft magnetic nature of CZFO, this soft magnetic nature might be useful for designing multifunctional devices to switch magnetization with a small external magnetic field.
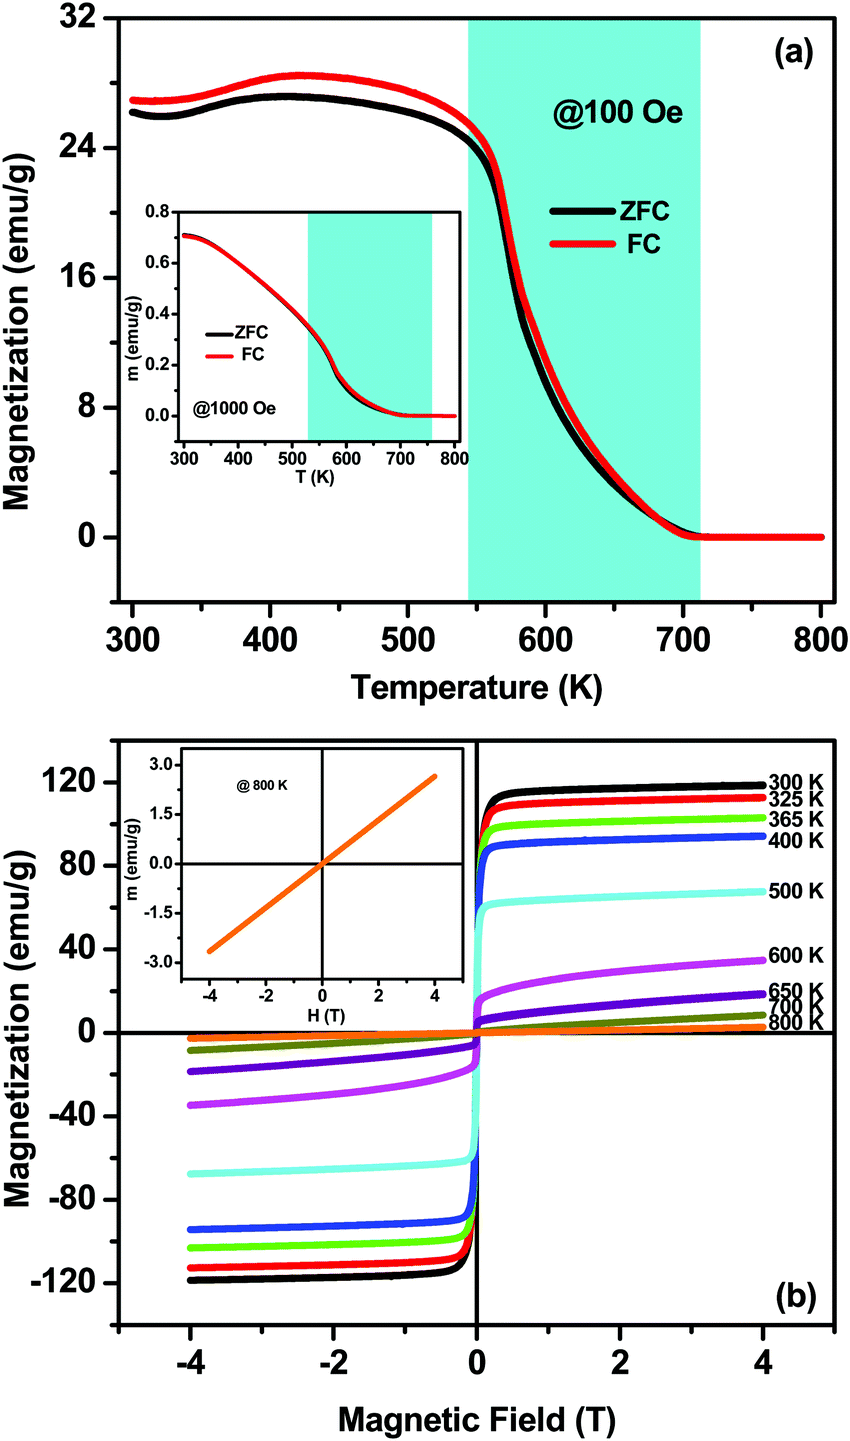 | ||
| Fig. 5 (a) Temperature dependence of magnetization for CZFO measured with zero field cooling (ZFC) and field cooling (FC) with an applied field of 100 Oe and 1000 Oe (inset). (b) M–H hysteresis loops at different temperatures and at 800 K (inset) of CZFO. | ||
The magnetodielectric coupling of materials can be confirmed by (i) a change or an anomaly in the temperature dependence of dielectric constant (ε) across a magnetic transition (TN), and/or (ii) a change in dielectric order parameters by the application of magnetic fields.48 It is clearly seen from Fig. 3(a) that CZFO shows a broad dielectric anomaly and pronounced changes in dielectric permittivity around magnetic transition temperatures, which satisfies the above mentioned first criterion. In order to verify the existence of magnetodielectric coupling between the electrical and magnetic order in CZFO, we measured capacitance and impedance in different static magnetic fields (0 ≤ H ≤ 1.5 Tesla) as a function of frequency at room temperature, as shown in Fig. 6(a) and (b). Significant and systematic changes in capacitance (Fig. 6(a)) and impedance (Fig. 6(b)) with an increase in the applied static magnetic field imply the existence of magnetodielectric coupling. The magneto-dielectric coupling can also be quantitatively measured in terms of magnetocapacitance (MC%) and magnetoimpedance (MI%) defined as the formulae given below.
The MC% and MI% calculated at 1 kHz using the above formula are ∼−1.91% and 3.6%, respectively, with a maximum static magnetic field of +1.5 T. Hence, the existence of magnetodielectric coupling in CZFO is concluded. Magnetodielectric coupling has also been observed in many non-polar magnetic materials, such as SeCuO3, TeCuO3 and CoSeO4.49,50
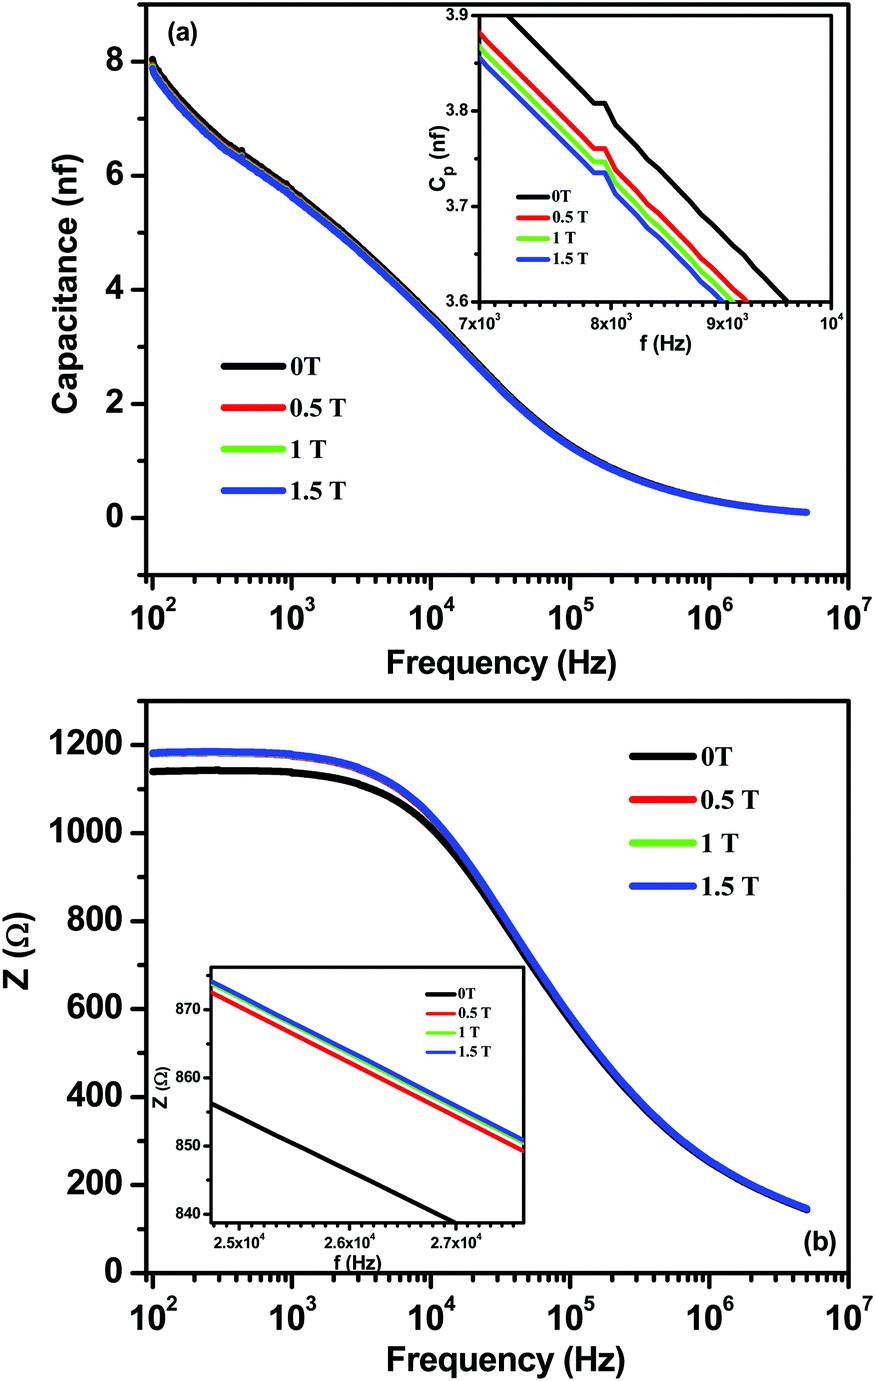 | ||
| Fig. 6 Frequency dependence of (a) capacitance and enlarged plot (inset) and (b) impedance and enlarged plot (inset) of CZFO in different magnetic fields (0 ≤ H ≤ 1.5 Tesla). | ||
In conclusion, the observation of large dielectric permittivity with a broad dielectric anomaly near TN concludes a strong correlation between dielectric and magnetic properties. The origins of high dielectric permittivity have been established. The ferrimagnetic–paramagnetic phase transition of CZFO has been probed at ∼640 K, which is well above room temperature. The temperature dependence of magnetization shows similar behavior to that of the small polaron conductivity exponent n(T), which supports the existence of strong spin-polaron coupling near TN. The high dielectric constant, low loss tangent, high magnetization, high TN with soft magnetic behavior and magnetodielectric coupling above room temperature make CZFO an interesting material for possible next generation spintronics and multifunctional device applications.
Acknowledgements
This work was supported by DOE Grant No. # FG02-08ER46526. Dhiren K. Pradhan and Shalini Kumari acknowledge IFN (NSF Grant # EPS – 01002410) for fellowship. We are very much thankful to Prof. R. Palai and K. Dasari of University of Puerto Rico for providing the magneto-dielectric measurement facilities.References
- B. D. Cullity and C. D. Graham, Introduction to Magnetic Materials, Wiley-IEEE Press, 2nd edn, 2008 Search PubMed.
- R. A. McCurrie, Ferromagnetic materials – Structure and Properties, Academic Press, San Diego, London, 1994 Search PubMed.
- M. Sugimoto, J. Am. Ceram. Soc., 1999, 82, 269–280 CrossRef CAS.
- W. Kleemann and C. Binek, Magnetic Nanostructures, Springer, 2013, vol. 246 Search PubMed.
- H. Fujimori, Y. H. Oshimoto and T. Masumuto, J. Appl. Phys., 1981, 52, 1893 CrossRef CAS.
- J. C. Slonczewski, Phys. Rev. B: Condens. Matter Mater. Phys., 2010, 82, 054403 CrossRef.
- G. E. W. Bauer, E. Saitoh and B. J. Van. Wees, Nat. Mater., 2012, 11, 391–399 CrossRef CAS PubMed.
- W. Eerenstein, N. D. Mathur and J. F. Scott, Nature, 2006, 442, 759–765 CrossRef CAS PubMed.
- J. Ma, J. Hu, Z. Li and C.-W. Nan, Adv. Mater., 2011, 23, 1062–1087 CrossRef CAS PubMed.
- D. K. Pradhan, V. S. Puli, S. N. Tripathy, D. K. Pradhan, J. F. Scott and R. S. Katiyar, J. Appl. Phys., 2013, 114, 234106 CrossRef.
- D. K. Pradhan, S. K. Barik, S. Sahoo, V. S. Puli and R. S. Katiyar, J. Appl. Phys., 2013, 113, 144104 CrossRef.
- S. Sharma, M. Tomar, A. Kumar, N. K. Puri and V. Gupta, RSC Adv., 2016, 6, 59150 RSC.
- S. Sharma, M. Tomar, A. Kumar, N. K. Puri and V. Gupta, AIP Adv., 2015, 5, 107216 CrossRef.
- R. Ramesh and N. A. Spaldin, Nat. Mater., 2007, 6, 21 CrossRef CAS PubMed.
- Y. Wang, J. Hu, Y. Lin and C.-W. Nan, NPG Asia Mater., 2010, 2, 61 CrossRef.
- C. A. F. Vaz, J. Hoffman, Y. Segal, J. W. Reiner, R. D. Grober, Z. Zhang, C. H. Ahn and F. J. Walker, Phys. Rev. Lett., 2010, 104, 127202 CrossRef CAS PubMed.
- D. K. Pradhan, S. Sahoo, S. K. Barik, V. S. Puli, P. Misra and R. S. Katiyar, J. Appl. Phys., 2014, 115, 194105 CrossRef.
- C.-W. Nan, M. I. Bichurin, S. Dong, D. Viehland and G. Srinivasan, J. Appl. Phys., 2008, 103, 031101 CrossRef.
- P. R. Mandal, S. Sahu and T. K. Nath, Int. J. Nanosci., 2011, 10, 295 CrossRef CAS.
- S. R. Murthy and T. S. Rao, Phys. Status Solidi A, 1985, 90, 631 CrossRef CAS.
- I. C. Nlebedim, M. Vinitha, P. J. Praveen, D. Das and D. C. Jiles, J. Appl. Phys., 2013, 113, 193904 CrossRef.
- S. Dey, R. Mondal, S. K. Dey, S. Majumder, P. Dasgupta, A. Poddar, V. R. Reddy and S. Kumar, J. Appl. Phys., 2015, 118, 103905 CrossRef.
- H. Huang, Y. Zhang, Z. Huang, Z. Kou, X. Yuan, Z. Ren, Y. Zhai, J. Du and H. Zhai, J. Appl. Phys., 2015, 117, 17E711 CrossRef.
- A. Franco, Jr. and F. C. e Silva, J. Appl. Phys., 2013, 113, 17B513 CrossRef.
- D. K. Pradhan, V. S. Puli, S. Kumari, S. Sahoo, P. T. Das, K. Pradhan, D. K. Pradhan, J. F. Scott and R. S. Katiyar, J. Phys. Chem. C, 2016, 120, 1936 CAS.
- J. P. Singh, R. C. Srivastava, H. M. Agrawal and R. Kumar, J. Raman Spectrosc., 2011, 42, 1510 CrossRef CAS.
- D. G. Chen, X. G. Tang, J. B. Wu, W. Zhang, Q. X. Liu and Y. P. Jiang, J. Magn. Magn. Mater., 2011, 323, 1717 CrossRef CAS.
- C. Kittel, Introduction to Solid State Physics, John Wiley & Sons, Inc, 8th edn, 2004 Search PubMed.
- H. Zheng, W. Weng, G. Han and P. Du, J. Phys. Chem. C, 2013, 117, 12966 CAS.
- D. K. Pradhan, P. Misra, V. S. Puli, S. Sahoo and R. S. Katiyar, J. Appl. Phys., 2014, 115, 243904 CrossRef.
- D. G. Chen, X. G. Tang, Q. X. Liu, Y. P. Jiang, C. B. Ma and R. Li, J. Appl. Phys., 2013, 113, 214110 CrossRef.
- A. Verma, O. P. Thakur, C. Prakash, T. C. Goel and R. G. Mendiratta, Mater. Sci. Eng., B, 2005, 116, 1 CrossRef.
- P. Lunkenheimer, R. Fichtl, S. G. Ebbinghaus and A. Loidl, Phys. Rev. B: Condens. Matter Mater. Phys., 2004, 70, 172102 CrossRef.
- E. V. Gopalan, K. A. Malini, S. Saravanan, D. Sakthi Kumar, Y. Yoshida and M. R. Anantharaman, J. Phys. D: Appl. Phys., 2008, 41, 185005 CrossRef.
- W. Chen, W. Zhu, O. K. Tan and X. F. Chen, J. Appl. Phys., 2010, 108, 034101 CrossRef.
- C. D. Wagner, W. M. Riggs, L. E. Davis, J. F. Moulder and G. E. Muilenberg, Handbook of X-ray Photoelectron Spectroscopy, Perkin-Elmer Corp., Physical Electronics Division, Eden Prairie, MN, 1979 Search PubMed.
- A. K. Jonscher, Nature, 1977, 264, 673 CrossRef.
- Z. Lu, J. P. Bonnet, J. Ravez and J. P. Hagenmuller, Solid State Ionics, 1992, 57, 235 CrossRef CAS.
- S. R. Elliot, Adv. Phys., 1987, 36, 135 CrossRef.
- N. Ortega, A. Kumar, P. Bhattacharya, S. B. Majumder and R. S. Katiyar, Phys. Rev. B: Condens. Matter Mater. Phys., 2008, 77, 014111 CrossRef.
- B. K. Barick, K. K. Mishra, A. K. Arora, R. N. P. Choudhary and D. K. Pradhan, J. Phys. D: Appl. Phys., 2011, 44, 355402 CrossRef.
- N. F. Mott, Metal-Insulatro transtions, Taylor & Francis, Newyork, 1992, 1990 Search PubMed.
- P. A. Joy, P. S. A. Kumar and S. K. Date, J. Phys.: Condens. Matter, 1998, 10, 11049 CrossRef CAS.
- B. Ghosh, S. Kumar, A. Poddar, C. Mazumdar, S. Banerjee, V. R. Reddy and A. Gupta, J. Appl. Phys., 2010, 108, 034307 CrossRef.
- X.-G. Li, X. J. Fan, G. Ji, W. B. Wu, K. H. Wong, C. L. Choy and H. C. Ku, J. Appl. Phys., 1999, 85, 1663 CrossRef CAS.
- D. S. Karmakar, K. Mandal, R. M. Kadam, P. L. Paulose, A. K. Rajarajan, T. K. Nath, A. K. Das, I. Dasgupta and G. P. Das, Phys. Rev. B: Condens. Matter Mater. Phys., 2007, 75, 144404 CrossRef.
- H. Borkar, R. J. Choudhary, V. N. Singh, M. Tomar, V. Gupta and A. Kumar, Mater. Res. Express, 2015, 2, 086101 CrossRef.
- R. Schmidt, J. Ventura, E. Langenberg, N. M. Nemes, C. Munuera, M. Varela, M. Hernandez, C. Leon and J. Santamaria, Phys. Rev. B: Condens. Matter Mater. Phys., 2012, 86, 035113 CrossRef.
- B. C. Melot, A. Goldman, L. E. Darago, J. D. Furman and E. E. Rodriguez Ram Seshadri, J. Phys.: Condens. Matter, 2010, 22, 506003 CrossRef PubMed.
- G. Lawes, T. Kimura, C. M. Varma, M. A. Subramanian, N. Rogado, R. J. Cava and A. P. Ramirez, Prog. Solid State Chem., 2009, 37, 40 CrossRef CAS.
| This journal is © the Owner Societies 2017 |