 Open Access Article
Creative Commons Attribution 3.0 Unported Licence
Structures and phase transitions in neat 4,4′-di-tert-butyl-2,2′-bipyridyl and in its molecular complexes with either bromanilic or iodanilic acid†
M.
Rok
 *a,
P.
Szklarz
a,
M.
Moskwa
a,
M.
Kijewska
a,
J.
Baran
b,
G.
Bator
a,
W.
Medycki
c and
M.
Zamponi
d
aFaculty of Chemistry, University of Wroclaw, 14 F. Joliot – Curie, 50-383 Wroclaw, Poland. E-mail: magdalena.rok@chem.uni.wroc.pl
bInstitute of Low Temperature and Structure Research, Polish Academy of Science, Okólna 2, PO Box 937, 50-950 Wroclaw, Poland
cInstitute of Molecular Physics, Polish Academy of Sciences, Smoluchowskiego 17, 60-179 Poznań, Poland
dJülich Centre for Neutron Science (JCNS) at Heinz Maier-Leibnitz Zentrum (MLZ), Forschungszentrum Jülich GmbH, Lichtenbergstr. 1, 85748 Garching, Germany
First published on 31st October 2017
Abstract
Using the DSC method, structural phase transitions have been found at 165 and 219 K for 4,4′-di-tert-butyl-2,2′-bipyridyl (dtBBP), whereas for its complex with iodanilic acid (dtBBP·IA), its phase transition is at 331 K. For the other molecular complex described (with bromanilic acid, dtBBP·BRA), no phase transitions have been observed between the liquid nitrogen temperature and the temperature of crystal decomposition. The crystal structures of the neat dtBBP have been determined at 130, 190 and 250 K, whereas for its molecular complex with bromanilic acid (BRA) is determined at 150 K and for its complex with iodanilic acid (IA) determined at 293 and 345 K. The crystal structure of neat dtBBP is characterized by layers of molecules, which are grouped by their t-butyls. The structures of dtBBP·BRA and dtBBP·IA are analogous to one another and consist of infinite chains of alternating acid and base molecules linked by hydrogen bonds. On the basis of the structural, dielectric and spectroscopic results (infrared and Raman), the mechanisms of the phase transitions have been proposed for dtBBP and dtBBP·IA. The 1H NMR spin–lattice relaxation times for all compounds under study, as well as the second moment for the neat dtBBP in a wide temperature, have been measured. The anomalies in the temperature dependent infrared spectra together with the NMR results support the supposition that for dtBBP the dynamics of tert-butyl groups is responsible for the mechanism of the phase transitions found. The dynamics of the molecules in the crystals presented is related to the rotation both of the methyl and tert-butyl groups.
1. Introduction
Molecular complexes are formed from base (proton acceptor, B) and acid (proton donor, A) molecules. These molecules are usually linked by hydrogen bonds (h.b.) in their solid state, creating a variety of structures of different stoichiometries. Among others, the infinite chains of alternating acid and base [A⋯B⋯A⋯B]∞ molecules have been frequently found. The chain formation is strongly desired from the viewpoint of the interesting dielectric properties of these organic materials. We can more or less predict the behaviour of protons between acid and base molecules based on the pKa value. In solution, the proton is normally present on the molecule with the higher pKa value. The difference in pKa [ΔpKa = pKabase − pKaacid] of the carboxylic acid and the aromatic base is a great indicator in order to determine whether a hydrogen bond exists with or without proton transfer. It was suggested that the possibility of proton transfer increases when the pKa values of the participating molecules match. In the pharmaceutical industry, the rule of thumb for salt formation is a pKa difference greater than 2 or 3 and this is typically used as a criterion for selecting counterions for salt formation.1 Johnson and Rumon,2 however, suggested limits. They have been reported that ΔpKa < 3.75 affords a neutral hydrogen bond, whereas ΔpKa > 3.75 results in proton transfer. They have pointed out that in the series of complexes composed of carboxylic acids and pyridines, there exists a critical region of ΔpKa of interacting components. They suggested that protons are then located close to the centre of the bridge with single minimum potential for the proton motion. On the other hand, Cruz-Cabeza calculated the ΔpKa values for a large and varied set of acid–base multicomponent crystal structures (6465) in the Cambridge Structural Database.3 The results have been divided into three zones: zone 1 (ΔpKa < −1), zone 2 (−1 ≤ ΔpKa ≤ 4) and zone 3 (ΔpKa > 4). The ionized acid–base complexes are observed exclusively for ΔpKa > 4 and non-ionised acid–base complexes are observed for ΔpKa < −1.If one selects the appropriate difference in the acid–base equilibrium constants, ΔpKa, the hydrogen bond is strong enough to exhibit the proton dynamics and jumps over a barrier between the proton donor and acceptor centres, even at room temperature.4 This phenomenon results in the semiconducting properties, when the alternating current, ac, is applied. These properties reveal a strong relationship of the ac conductivity on temperature and frequency. Herein, the pKa value of 4,4′-di-tert-butyl-2,2′-bipyridyl equals 5.11, while the pKa1 of chloranilic acid is 0.76. The difference in pKa (ΔpKa = 4.35) suggests the creation an ionic form rather than the neutral one.
Molecular complexes with hydrogen bonds have been widely investigated.5–11 The semiconducting properties of organic compounds seem interesting from the viewpoint of crystal engineering. For example, Horiuchi et al. studied phenazine and 2,5-dichloro-3,6-dihydroxy-p-benzoquinone (chloranilic acid) linked via chains of hydrogen bonds or 5,5′-dimethyl-2,2′-bipyridyl with chloranilic acid, showing a proton transfer mediated antiferroelectric phase transition.12–15 The mechanism of this transition is governed by the proton jumping along the OHN hydrogen bond chains. On one side of the 5,5′-dimethyl-2,2′-bipyridyl molecule, the proton is transferred from the acid, N+–H⋯O−, while on the other one it is not, O–H⋯N.
The other systems, however, composed of analogous base molecules, 4,4′- and 6,6′-dimethyl-derivatives, did not show such a property. In their case, this property was discussed rather in terms of a marked elongation of the OHN hydrogen bonds. The shortest h.b. (2.569 Å) has been found just for the 5,5′-dimethyl derivative on both sides of the bipyridyl molecule. According to Table S1 (ESI†), those values suggest that a hydrogen bond can be classified as a strong one. Nevertheless, the former complexes showed interesting dielectric properties as well.16
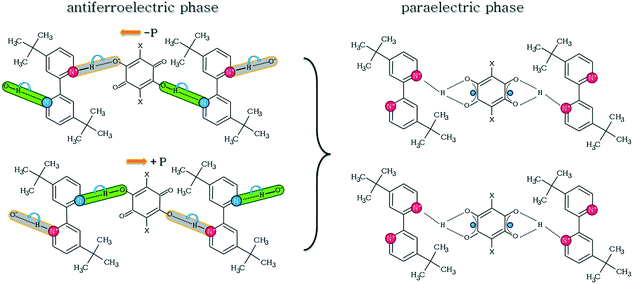
The other interesting feature of the molecular complexes is a possible π–π stacking arrangement of molecules. For example, 2,5-dichloro-3,6-dihydroxy-p-benzoquinone (chloranilic acid, CLA) forms in the crystalline state with 4,4′-di-tert-butyl-2,2′-bipyridyl (dtBBP) infinite hydrogen-bonded chains along the crystallographic b-axis.17 The molecules are linked by the π–π stacking interactions as well. The hydrogen bonds found can be either with the proton transfer, N+–H⋯O−, or without, O–H⋯O. The chains of hydrogen bonds are elongated antiparallel in the crystal structure. The N+–H⋯O− hydrogen bond length is very short (2.615 Å), but a little longer than that in the antiferroelectric complex of CLA with 5,5′-dimethyl-2,2′-bipyridyl. A weak, close to continuous, phase transition has been found at 412 K (cooling/heating) for the dtBBP·CLA complex. The mechanism of the phase transition has been proposed by Rok et al.17,18 (Scheme 1). It was shown that it is related to the proton disorder in the hydrogen bonds. The dielectric permittivity of dtBBP·CLA revealed a strong anisotropy (ε′ = 120 and 20 along the b and c-axes (412 K), respectively). At low frequencies, the ac electric conductivity of the crystal has been ascribed to an activation process, while at high frequencies, the dielectric relaxation has been found to be of the Cole–Cole type.
All these experimental observations for the organic complexes led us to synthesize and characterize the other complexes of dtBBP. One is the bromo- and the other one is the iodo-derivative of 3,6-dihydroxy-p-benzoquinone, i.e. 2,5-dibromo-3,6-dihydroxy-p-benzoquinone (bromanilic acid, BRA) and 2,5-diiodo-3,6-dihydroxy-p-benzoquinone (iodanilic acid, IA). In this paper, we will present the crystal structures, spectroscopic and dielectric properties of the dtBBP base and its complexes with either bromanilic or iodanilic acid. The mechanism of the structural phase transition in dtBBP·IA will be discussed as well.
2. Experimental section
2.1 Materials
Single crystals of the molecular complexes of 4,4′-di-tert-butyl-2,2′-bipyridyl (1 g, 3.7 mmol) (dtBBP, 98% Aldrich) with either bromanilic (1.1 g, 3.7 mmol) (BRA, >98% TCI) or iodanilic acid (1.5 g, 3.7 mmol) (IA) were grown from a methanol solution (250 ml) (98%) with the stoichiometric amounts of the components by a slow evaporation of the solvent at room temperature. Iodanilic acid (IA) was prepared from p-chloranil according to the literature.19 The purity and identity were checked by elemental analysis. The molecular mass and isotopic pattern observed in the mass spectrum correspond well to the molecular formula of iodanilic acid (C6H2O4I2). The impurity content was found to be a few to 10%. Analysis (% calcd, % found for C6H2O4I2): C (18.39, 18.80), H (0.51, 0.64). The composition of the synthesized compounds was identified by elemental analysis using a Vario FT III Element Analyzer on C, H and N (% exp./theor.): C(50.32/50.90), H(4.48/4.64), N(4.87/4.95) and C(45.98/45.66), H(3.93/3.92), N(4.16/4.24) for dtBBP·BRA and dtBBP·IA, respectively.2.2 Thermal analysis
Differential scanning calorimetry (DSC) runs for dtBBP·IA were recorded with a Perkin Elmer DSC 8500 calorimeter in the temperature range between 310 and 350 K with a scanning rate of 20 K min−1. The temperature was measured with the accuracy better than 0.1 K (relative error). Thermogravimetric analysis (TGA) and differential thermal analysis (DTA) were carried out on a Setaram SETSYS16/18 instrument between 290 and 700 K with a ramp rate in a nitrogen atmosphere.2.3 Single crystal X-ray diffractometry
The X-ray diffraction data were collected using KUMA KM4CCD (dtBBP at 130 and 250 K and dtBBP·BRA) and Ruby X-Calibur (dtBBP at 190 K and dtBBP·IA) κ-axis four circle diffractometers equipped with an Oxford Cryosystem cooler using graphite-monochromated MoKα radiation. The structures were solved by direct methods (SHELXS-2013)20 and refined by full-matrix least-squares on F2 using the SHELXL-2013 programs.21 All non-hydrogen atoms were refined with anisotropic thermal parameters. H atoms attached to O and N atoms were found in a difference Fourier map and refined with isotropic thermal parameters. Other H atoms were treated as riding and their isotropic temperatures were assumed as 1.2 and 1.5 times Ueq of their closest heavy atoms. The crystal data together with experimental and refinement details are given in Table S2 (ESI†). Full crystallographic data are deposited with the Cambridge Crystallographic Data Center (CCDC No. 1567116–1567121).2.4 Neutron scattering
High resolution neutron spectra were measured on a SPHERES22 backscattering spectrometer of the Jülich Centre for Neutron Science at Forschungsneutronenquelle Heinz Maier-Leibnitz FRM II (Technische Universität München (TUM), Garching) at temperatures between 100 and 300 K in the energy range of ±30 μeV with an energy resolution of about 0.65 μeV. The programs SLAW23 and FRIDA24 were used for reducing and fitting the data, respectively.2.5 Spectroscopic studies: IR and Raman
Infrared spectra of dtBBP·IA were recorded in the temperature range between 298 and 330 K using a BRUKER IFS-88 FTIR spectrometer over the wavenumber range 4000–400 cm−1 with a resolution of 1 cm−1. The sample was prepared as a suspension in Nujol and embedded between KBr windows. An APD Cryogenics was used for temperature dependent studies in the temperature range between 300 and 350 K. FT-Raman spectra were measured with a FRA-106 attachment to the Bruker IF-88, having a resolution of 2 cm−1. The Nd:YAG laser power was ca. 200 mW. The IR/Raman data were analysed by using the GRAMS/386 program from Galactic Industries.2.6 Dielectric measurements
The complex dielectric permittivity, ε* = ε′ − iε′′, has been calculated from the measured value of the complex admittance, Y = G + iωC, with an Agilent E4980A Precision LCR Meters in the frequency range between 100 Hz and 2 MHz and in the temperature range between 100 and 350 K. The dimensions of the samples were 5 mm × 3 mm × 1 mm. As an electrode, a copper-foil was affixed to the crystals. The overall error in the estimation of the real and imaginary parts of the complex electric permittivity as well as of the conductivity was about 5%. Dielectric measurements were carried out using a sample holder placed over liquid nitrogen vapour.2.7 1H-NMR
The NMR measurements were made using ELLAB TEL-Atomic PS 15 (operating at 25 MHz in temperatures from room temperature down to the liquid nitrogen temperature) and Tecmag Scout (operating at 24.8 MHz at temperatures below the liquid nitrogen temperature) spectrometers. Spin–lattice relaxation times, T1, were measured using a saturation sequence of π/2 pulses followed by a variable time interval τ and a reading π/2 pulse. The magnetization was found to recover exponentially within experimental error at all temperatures. The temperature of the sample down to the liquid nitrogen temperature was controlled by using a UNIPAN 660 temperature controller operating on a Pt 100 sensor providing long time temperature stability better than 1 K. Below the liquid nitrogen temperature, a helium cooled Leybold cryostat was applied. Powdered samples of the neat dtBBP and its complexes with the organic acids were evacuated at room temperature and then sealed under vacuum in glass ampoules. All measurements were performed in a heating cycle. The errors in the measurements of T1 were estimated to be about 5%.3. Results
3.1 Thermal analysis
By analyzing the results of the thermogravimetric measurements, one can state that the crystals of dtBBP, dtBBP·BRA and dtBBP·IA are stable up to 400 K. In the temperature ranges up to the above-mentioned temperatures, the mass loss of the compounds is less than 1% (Fig. S1†).The DSC results show that in the case of the pure base 4,4′-di-tert-butyl-2,2′-bipyridyl (dtBBP), two solid-to-solid phase transitions were observed in the temperature range between 300 and 100 K (Fig. S2a, ESI†). Upon cooling, one peak at 216 K was found with enthalpy (ΔH) and entropy (ΔS) values of 1.7 kJ mol−1 and 7.9 J K−1 mol−1, respectively. While, upon heating, two peaks of thermal anomaly appeared, first at 165 K with ΔH = 0.35 kJ mol−1 and ΔS = 2.1 J K−1 mol−1, and the other one at 219 K. The latter peak, at 219 K, exhibits similar energy values to those found in the cooling cycle (ΔH = 1.6 kJ mol−1, ΔS = 7.5 J K−1 mol−1). The peak shape and the temperature hysteresis (ΔT = 3 K) present on the DSC curves clearly indicate the discontinuous character (first order) of the transition from the partially ordered (intermediate temperature, IT) to the disordered (high temperature, HT) phase. The single peak observed during the cooling cycle may be due to, on one hand, limitations of the applied method (the low-temperature limit is 100 K) or, on the other hand, the possibility that the low-temperature peak is not reversible.
In turn, in the case of the dtBBP·BRA complex, we have not found any indication in the DSC measurements that the crystals undergo a structural phase transition. In contrast to the complex described above, the reversible anomaly for dtBBP·IA at 331 K (I → II) (upon cooling/heating) has been detected. The two phases of dtBBP·IA are numbered I and II from the high to the low temperature one. The results of the calorimetric (DSC) measurements for dtBBP·IA are presented in Fig. S2b, ESI.† The shape of the small thermal anomaly observed at 331 K is characteristic of a continuous (or second order) phase transition. The high ramp rate (20 K min−1) was used in order for the anomaly to be observed, because at ramp rates lower than the 20 K min−1 ramp rate, the peaks assigned to the phase transition were hardly observed.
3.2 Crystal structure analysis
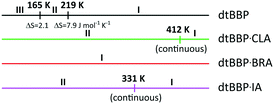
The structural phase transitions found by the DSC method for 4,4-di-tert-butyl-2,2-bipyridyl (dtBBP) at 165 and 219 K, and that for 4,4-di-tert-butyl-2,2-bipyridyl with iodanilic acid (dtBBP·IA) at 331 K as well as for the neat dtBBP and for comparison those found for dtBBP·CLA,17,18 are depicted in Scheme 2. This is the reason that the temperatures of the X-ray measurements were chosen according to the different phases found for the single crystals under study.The X-ray diffraction studies were carried out for the single crystals of dtBBP at 130 (phase III), 190 (phase II) and 250 K (phase I), for dtBBP·BRA at 155 K (no structural phase transitions found, phase I) and for dtBBP·IA at 295 (phase II) and 345 K (phase I). The asymmetric parts of the crystal structures for the phases analysed with the atom numbering are presented in Fig. 1.
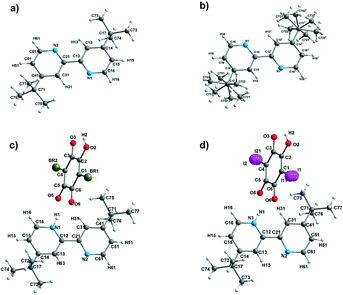 | ||
| Fig. 1 The asymmetric parts with the atom numbering (a) for dtBBP at 130 K and (b) at 250 K; (c) for dtBBP·BRA at 155 K and (d) for dtBBP·IA at 295 K. | ||
dtBBP crystallizes in the monoclinic space group P21/c in all phases analysed. When we compare the low temperature phases with that at 250 K, we can state that the unit cell is doubled in the phases II and III. At 250 K, the asymmetric part of the unit cell consists of a half molecule of dtBBP. The tert-butyl groups are disordered, described by the two-site model with the occupation factor equal to 69![[thin space (1/6-em)]](https://www.rsc.org/images/entities/char_2009.gif) :
:![[thin space (1/6-em)]](https://www.rsc.org/images/entities/char_2009.gif) 31%. The large ellipsoids of the thermal vibrations of the carbon atoms in the tert-butyl groups indicate the rotations of these groups around their C–C(ring) bonds. In the remaining two phases, II and III, the unit cell is doubled along the crystallographic c-axis, which is obviously accompanied by the doubling of the asymmetric part. Now, the whole dtBBP molecule becomes this asymmetric part. At 190 K, we still deal with a disorder of the tert-butyl groups described by the one-site model with large thermal ellipsoids, which may indicate the diminishing of the freedom for rotations of these groups.
31%. The large ellipsoids of the thermal vibrations of the carbon atoms in the tert-butyl groups indicate the rotations of these groups around their C–C(ring) bonds. In the remaining two phases, II and III, the unit cell is doubled along the crystallographic c-axis, which is obviously accompanied by the doubling of the asymmetric part. Now, the whole dtBBP molecule becomes this asymmetric part. At 190 K, we still deal with a disorder of the tert-butyl groups described by the one-site model with large thermal ellipsoids, which may indicate the diminishing of the freedom for rotations of these groups.
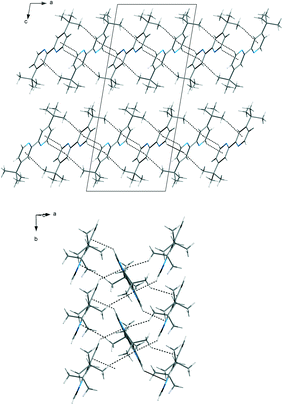
The packing of the dtBBP molecules in the crystal structure at 130 K is presented in Fig. 2. The structures of all three phases are characterized by the existence of the layers of the dtBBP molecules. The molecules from two adjacent layers are connected by their tert-butyl groups. The layers are formed by the dtBBP molecules connected by weak CH⋯π bonds. Each dtBBP molecule forms four CH⋯π independent bonds, two as proton donors and two as acceptors (Fig. 3). The packing of the molecules and their mutual orientations are the same in all phases analysed. In turn, the ordering degree of the tert-butyl groups is different in the particular phases. This is probably a result of the strengthening of the molecular interactions between the adjacent layers in the structure on cooling the crystal.
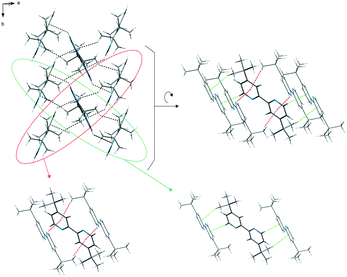 | ||
| Fig. 3 The layers of the dtBBP molecules in the crystal structure at 130 K stabilized by weak CH⋯π bonds (green and red lines). | ||
In the case of the crystals of dtBBP with halo-anilic acids analysed in this work, the crystal structures are isostructural. In the case of dtBBP·IA, the iodide atoms are disordered, as described by the two-site model with the occupation factor equal to 54![[thin space (1/6-em)]](https://www.rsc.org/images/entities/char_2009.gif) :
:![[thin space (1/6-em)]](https://www.rsc.org/images/entities/char_2009.gif) 46% in both phases. The crucial element in their crystal structures is the infinite chains along the b-axis formed by the alternating dtBBP and acid molecules joined by the hydrogen bonds. The example of the chain in the dtBBP·BRA, the crystal formed by N–H⋯(O,O) and O–H⋯(N,O) bifurcated hydrogen bonds, is presented in Fig. S3 (ESI†). The other characteristic feature of these crystals is the formation of the π–π stacking structure. An example of the π–π stacking in the crystal of dtBBP·BRA at 155 K is presented in Fig. S4 (ESI†).
46% in both phases. The crucial element in their crystal structures is the infinite chains along the b-axis formed by the alternating dtBBP and acid molecules joined by the hydrogen bonds. The example of the chain in the dtBBP·BRA, the crystal formed by N–H⋯(O,O) and O–H⋯(N,O) bifurcated hydrogen bonds, is presented in Fig. S3 (ESI†). The other characteristic feature of these crystals is the formation of the π–π stacking structure. An example of the π–π stacking in the crystal of dtBBP·BRA at 155 K is presented in Fig. S4 (ESI†).
The selected most important bond lengths and angles for the crystalline state of the neat dtBBP and its complexes with the BRA, CLA and IA acids at different temperatures corresponding to the different phases of the particular crystals are collected in Tables S3 and S4 (ESI†). The isomorphous crystal structures of the molecular complexes will be described on the basis of dtBBP·BRA. In the complex dtBBP·BRA, one hydrogen atom of the BRA hydroxyl group is transferred to the dtBBP moiety to form a BRA− anion and a dtBBPH+ cation. Similar to that in the case of the dtBBP·CLA complex (see Table S5, ESI†), the proton transfer in the hydrogen bond substantially shortens the corresponding C–O bond in the BRA acid molecule (from 1.3264(4) to 1.261(4) Å) and widens the C![[double bond, length as m-dash]](https://www.rsc.org/images/entities/char_e001.gif) N–C angles (from 116.9(3) to 122.0(3)°) in the dtBBP base molecule. Similar observations were present in the case of 5,5- or 6,6′-dimethyl-2,2′-bipyridine with anilic acid.9,15,25 Studies of the single-crystal structures of, e.g. pentachlorophenol, with amines also prove that the C–O bond length can be used to determine the ionic state of the complex.26 When the phenol C–O distance is ∼1.36 Å, neutral phenol is observed, while the phenolic anion is formed for distances shorter than 1.26 Å.
N–C angles (from 116.9(3) to 122.0(3)°) in the dtBBP base molecule. Similar observations were present in the case of 5,5- or 6,6′-dimethyl-2,2′-bipyridine with anilic acid.9,15,25 Studies of the single-crystal structures of, e.g. pentachlorophenol, with amines also prove that the C–O bond length can be used to determine the ionic state of the complex.26 When the phenol C–O distance is ∼1.36 Å, neutral phenol is observed, while the phenolic anion is formed for distances shorter than 1.26 Å.
The acid BRA and dtBBP base molecules are linked by bifurcated hydrogen bonds – N(1)–H(1)⋯O(5) and N(1)–H(1)⋯O(6) as well as by the O(2)–H(2)⋯N(2)#1 hydrogen bond – to form a chain running along the b-axis. The corresponding N(1)–H(1)⋯O(5), N(1)–H(1)⋯O(6) and O(2)–H(2)⋯N(2)#1 distances are equal to 2.629(4), 2.972(4), 2.758(4) Å, respectively. Moreover, the crystal packing is stabilized by the C–H⋯O interactions as well as by the π–π stacks (Table S6 and Fig. S4, ESI†). They form with the bromanilic acid plane an angle of 73.24°. Also, in the crystal lattice, three contacts – C(72)–H(722)⋯O(3)#4 (3.456(5) Å), C(74)–H(743)⋯O(5)#5 (3.421(5) Å) and C(76)–H(61)⋯O(6)#7 (3.400(4) Å) – are shorter than the sum of the van der Waals radii.
The crystal structures of dtBBP·IA were determined in two phases – I (345 K) and II (295 K). The structure at 295 K, as it was mentioned above, is isostructural with those of the molecular complexes investigated in this paper. We have again the [A⋯B⋯A⋯B]∞ infinite chains with the hydrogen bonds of either O–H⋯N or N+–H⋯O− types (see Fig. S5, and Table S7, ESI†). Moreover, we can distinguish the directions of the chains according to the proton positions in the hydrogen bonds in adjacent chains. The crystal structure of dtBBP·IA is characterized by stacks of dtBBP molecules. The corresponding centroid to centroid distances in the dtBBP·XA (X = CL, BR, I) complexes are equal to CLA: 3.672 and 3.652 Å, BRA: 3.706 and 3.666 Å, IA: 3.910 and 3.823 Å. The molecules forming the stacks belong to the adjacent chains of hydrogen bonds. In this way, the hydrogen bond and the π–π stacking interactions organize the described structure in the layers lying in the bc plane according to a scheme (Scheme 3):
On the other hand, these layers stack one over the other along the a-direction. The weak interactions between layers are realized by the H⋯H contacts between methyl groups as well as by the X⋯H short contacts. In the low temperature phase of dtBBP·IA (below 331 K), we deal with layers of the [A⋯B⋯A⋯B]∞ chains in the bc plane which are oriented in the same way along the b-axis. In a single layer, the chains are alternately oriented along one direction and in the adjacent layers they are parallel (see Fig. S6, ESI†). In the high temperature phase (above 331 K), the organization of the chains in one layer is the same as that in the LT phase. The mutual orientation of the chains in the adjacent layers is, however, changed. The chains in the adjacent layers become oriented antiparallel. It looks as if they are shifted by 0.5c to each other. As a result, in the phase transition, the orientations of the chains change in every second layer in Fig. 4.
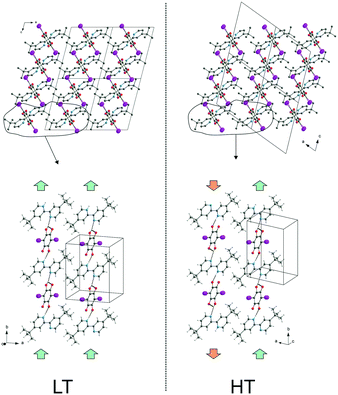 | ||
| Fig. 4 The mutual orientation of the chains in the adjacent dtBBP·IA layers in the LT and HT phases. | ||
3.3 Dielectric response
Fig. 5 presents the temperature and frequency dependence of the real part of the electric permittivity of the pure dtBBP upon the cooling cycle. At temperatures close to 216 K, the compound undergoes a phase transition from the disordered phase (HT) to the ordered phase (LT). This effect is observed as a small decrease of ε′ near the 216 K phase transition. Due to the fact that the change of the crystal structure is related exclusively to an ordering of the tert-butyl/methyl groups, only a very small increment of the permittivity (Δε ≅ 0.04) has been found at 216 K.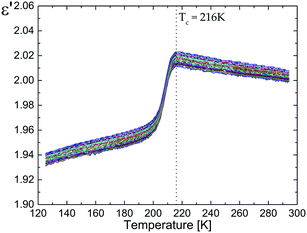 | ||
| Fig. 5 Electric permittivity versus temperature measured for the polycrystalline pellets of the pure dtBBP (on cooling). | ||
Although no structural phase transition has been found for dtBBP·BRA, the measurements of the electric permittivity in a temperature range between 380 and 430 K showed dielectric dispersion and absorption.
The temperature and frequency dependence of the real, ε′, and imaginary, ε′′, parts of the complex electric permittivity is depicted in Fig. 6 and Fig. S7 (ESI†). The changes in the electric permittivity are similar to those observed in the low-temperature solid phase of the dtBBP·CLA crystal.14 We have analysed the results in terms of the Cole–Cole equation:
 | (1) |
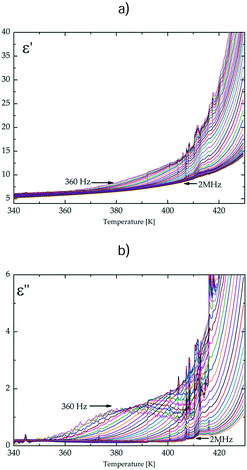 | ||
| Fig. 6 The temperature dependence of (a) the real part, ε′, and (b) the imaginary part, ε′′; of the electric permittivity for the dtBBP·BRA complex along the b-axis. | ||
Fig. S8 (ESI†) shows the Argand diagrams at several temperatures for single crystals of dtBBP·BRA. At temperatures above 412 K, the characteristic low-frequency-tail is observed, which is assigned to the ac conductivity of the sample. The same effect was obtained for dtBBP·CLA in the high-temperature phase (HT), also above 412 K.17,18 From the Arrhenius relationship,  , where τo is the relaxation time limit at high temperature, E – activation energy, R – gas constant and T – temperature, we have estimated the activation energy for the rotational process connected with the dielectric absorption to be equal to 108 ± 5 kJ mol−1.
Fig. 7 illustrates the comparison of the relaxation times for both dtBBP·CLA and dtBBP·BRA crystals, based on the Arrhenius dependence. Two activation energies were estimated for the dtBBP·CLA crystal, 80 and 145 kJ mol−1, for the low-temperature phase (LT) and the high-temperature phase (HT), respectively, whereas in the case of the dtBBP·BRA molecular complex, the activation energy is equal to 108 kJ mol−1. This value is rather high for such a type of molecular motion and may indicate also a cooperative process, most probably related to the proton dynamics in the hydrogen bonds. As it was mentioned in the Introduction section, the dtBBP·CLA crystal undergoes one solid-to-solid phase transition at 412 K. This transformation was also discussed in terms of the change in protons dynamics in the crystals. In the low-temperature (LT) phase, two adjacent polar chains of hydrogen bonds are created with opposite polarization directions, therefore, this phase has an antiferroelectric nature, as is shown in Scheme 1.
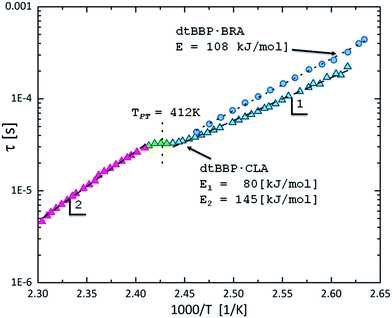 | ||
| Fig. 7 The temperature dependence of the macroscopic dielectric relaxation time for dtBBP·CLA (triangles)17 and dtBBP·BRA (circles). The dtBBP·CLA low-temperature (LT) and high-temperature (HT) phases are indicated by 1 and 2, respectively. | ||
According to X-ray analysis, in both crystals (dtBBP·CLA and dtBBP·BRA), the molecules are monovalent, asymmetric and the ordered hydrogen bonds form a polar supramolecular chain. In the low-temperature phase of dtBBP·CLA and in the crystal of dtBBP·BRA, structural data indicate two types of hydrogen bonds: (i) one with proton transfer from an acid to a base (NH+⋯O−), and (ii) the other one with a hydrogen bond between a proton donor (CLA or BRA) and an acceptor (dtBBP). Analysis of the dielectric response and literature data allows us to conclude that the high-temperature (HT) phase for dtBBP·CLA is paraelectric. In the HT phase, the protons are localized as a superposition between nitrogen (from the base molecule) and two oxygen atoms from CLA. Both in the LT and HT phases, the proton transfer should be followed and the dynamical disorder of protons along the hydrogen chains generates the large relative permittivity in the vicinity of the phase transition. The mechanism of transformation was defined as the order–disorder and in the LT phase, the proton movements are in disorder, whereas the collective proton motions may be proposed in the HT phase.
We assumed that movement of the protons in the crystal of dtBBP·BRA could be the same like what was observed in the LT phase of the dtBBP with chloranilic acid (CLA). On the other hand, the crystal of dtBBP·IA also undergoes one phase transition at 331 K, but in this case, we have observed only changes in the electrical permittivity in the close vicinity of the transition. It could be a consequence of the crystal preparation path; the iodanilic acid is unstable in solvents other than methanol. Crystallization in such a highly evaporating solvent causes the crystals to be of very poor quality and the electrical measurement was scrutinized on the powder sample (pellets). These results should be, therefore, treated only roughly.
3.4 Infrared and Raman spectroscopy
We have carried out the spectroscopic measurements in the temperature range between 11 and 300 K for dtBBP and between 303 and 353 K for dtBBP·IA in order to check if any changes in the IR spectra could be observed around their structural phase transitions (PT: dtBBP at 165 and 219 K, dtBBP·IA at 331 K). Since the used wavenumber range corresponds to the internal vibrations of the organic molecules, any changes could indicate the possible mechanism of the PT. The measurements for both compounds were carried out on heating.In Tables S8 and S9 (ESI†), we have collected the wavenumbers of the observed bands in the IR spectra of dtBBP and dtBBP·IA and their tentative assignments to the internal vibrations of molecules. The assignments of the bands observed to the corresponding internal vibrations of dtBBP and dtBBP·IA were done on the basis of the corresponding literature.27–30
IR spectra of the polycrystalline dtBBP (at 11 and 300 K) and dtBBP·IA (at 300 and 353 K) as a suspension in Nujol and the FT-Raman spectra (300 K) between 3500 and 400 cm−1 are shown in Fig. S9a and b (ESI†), respectively. For both compounds, only very small changes with temperature could be found. The following figures show the most spectacular changes in the temperature dependent IR spectra for dtBBP and dtBBP·IA, respectively.
Fig. 8 presents the temperature evolution of the bands in the IR spectra of dtBBP between 3090 and 3040 cm−1 and the temperature dependence of their respective wavenumbers. This wavenumber region corresponds to the stretching C–H vibrations, ν(CH). In the low temperature phase of dtBBP, the band at 3069 cm−1 slightly diminishes its wavenumber and a step-wise change is observed at the 219 K PT temperature. In the high temperature, the wavenumber insignificantly increases on heating. The little effect of the PT can be observed also for the change in position at 165 K.
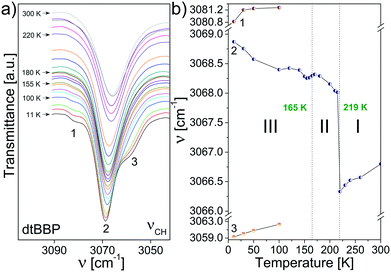 | ||
| Fig. 8 (a) The temperature evolution of the bands assigned to the stretching C–H vibrations, ν(CH), of dtBBP between 3090 and 3040 cm−1; (b) temperature dependencies of the band positions. | ||
In the wavenumber, which corresponds to out of plane C–H vibrations (870–820 cm−1), two bands are observed at 849 and 839 cm−1 (Fig. 9). Their relative intensities change with temperature: the high-wavenumber band becomes stronger and stronger. Moreover, their positions change in the PT at 219 K, which is depicted in Fig. 9b and they are more spectacular again for the band at 849 cm−1.
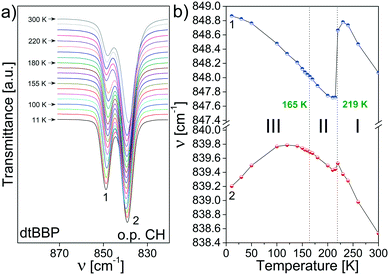 | ||
| Fig. 9 (a) The bands at 849 and 839 cm−1 (RT) in the dtBBP spectra assigned to the out of plane C–H vibrations; (b) temperature dependencies of their positions. | ||
In turn, a phase transition has been found for dtBBP·IA at 331 K. The extremely small shifts were found for the bands assigned to in-plane ring vibrations between 1700 and 1590 cm−1 (Fig. 10). In this wavenumber region, three well separated bands are observed (at 1664, 1623 and 1598 cm−1). The medium wavenumber band increases its wavenumber at the PT, and the other two bands decrease.
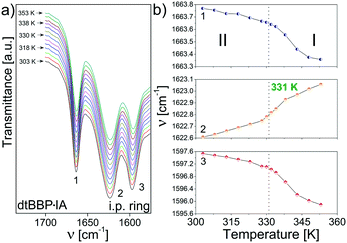 | ||
| Fig. 10 (a) The temperature evolution of the bands assigned to dtBBP·IA in-plane ring vibrations between 1700 and 1590 cm−1, (b) temperature dependencies of their positions. | ||
Similar to that for the neat dtBBP, changes in positions have been found for the bands assigned to the out of plane C–H vibrations, which is presented in Fig. 11. The largest changes are observed at the 331 K phase transitions and the bands lay closer and closer one to another in the high temperature phase.
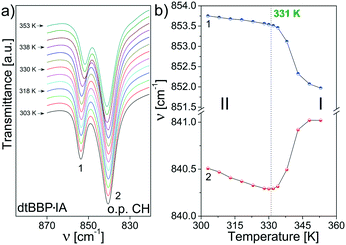 | ||
| Fig. 11 (a) The bands assigned to the out of plane C–H vibrations (870–820 cm−1) for dtBBP·IA; (b) temperature dependencies of their positions. | ||
On the basis of the presented results of the temperature dependent IR spectra, the mechanisms of the structural phase transitions at 219 K of dtBBP and at 331 K of dtBBP·IA may be connected with the change in the dynamical state of the tert-butyl groups.
3.5 Quasielastic neutrons scattering (QENS)
QENS signals appear in the neutron scattering spectra, which concern the almost elastic collisions of neutrons with atoms. As a consequence, a broadening of the elastic line in the neutron energy spectrum, S(ω,Ω) (Ω – momentum and ω – energy transfer), is observed. The elastic scattering of neutrons is due to the atoms, which move too slowly to be resolved with the resolution of the instrument and move in a stochastic manner.31 The QENS signal contains both coherent and incoherent scattering contributions. The former process yields information about interference phenomena among atoms, like collective dynamics or transport properties, and it depends on the momentum transfer, Ω. The latter one – the incoherent scattering – comes from individual atoms and can give information about the single-particle motions. It does not depend on Ω.32 At low temperatures, the molecular rotations or long-range diffusions are almost frozen but the dynamics of the methyl groups can still be present. The quasi-elastic component, if it appears at all, will be observed at temperatures above ca. 50 K and the motion of methyl groups can be described by a classical hopping process. The classical jumps of the hydrogen atoms over the energy barrier can be postulated from the temperature dependent QENS broadening of the elastic line.The spectra measured at several temperatures between 150 and 300 K could be described by the instantaneous 120° jumps of the CH3 groups around the three-fold symmetry axis with the scattering law S(ω,Ω) given in ref. 33–35.
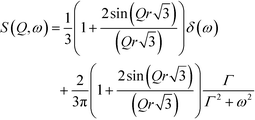 | (2) |
 is the bandwidth parameter, in which τ is the mean time between the proton jumps.
The QENS spectra of the pure base, dtBBP, and its molecular complexes with the organic acids, CLA, BRA and IA, are shown in Fig. 12. In the case of the complexes, only the protons from the CH3 groups of the dtBBP molecules take part in the fast reorientation described by the scattering function given above (Nq = 18). The other protons from the dtBBP molecules and the organic acid ones contribute only to the elastic part of the spectrum (Ne = 6). The solid lines represent the fittings to the QENS spectrum. The model used was convoluted with the resolution function. The instrumental resolution function was taken from the sample scattering at a temperature of ca. 4 K, where only the elastic neutron scattering line was observed. The fitted mean time between jumps, τ, changes for pure-dtBBP from 6.10 × 10⁻⁸ (100 K) to 6.10 × 10⁻¹⁰ s (200 K). For complexes with anilic acid, the τ changes as follows: (i) dtBBP·CLA from 4.12 × 10⁻⁸ (150 K) to 1.80 × 10⁻⁹ s (250 K), (ii) dtBBP·BRA from 6.20 × 10⁻⁸ (150 K) to 2.05 × 10⁻⁹ s (250 K), and (iii) dtBBP·IA from 3.45 × 10⁻⁸ (150 K) to 1.85 × 10⁻⁹ s (250 K). The activation energy obtained from the Arrhenius plot ln![[thin space (1/6-em)]](https://www.rsc.org/images/entities/char_2009.gif) Γ versus 1000/T (see Fig. S10, ESI†) changes from 80 meV (∼8 kJ mol−1) for pure dtBBP to 113 meV (∼11 kJ mol−1) for the dtBBP·BRA complex. In fact, the activation energies obtained for the complexes are slightly higher than that obtained for the pure dtBBP. It means that the methyl groups rotate more freely in the pure base crystal than in those of the molecular complexes under study.
Γ versus 1000/T (see Fig. S10, ESI†) changes from 80 meV (∼8 kJ mol−1) for pure dtBBP to 113 meV (∼11 kJ mol−1) for the dtBBP·BRA complex. In fact, the activation energies obtained for the complexes are slightly higher than that obtained for the pure dtBBP. It means that the methyl groups rotate more freely in the pure base crystal than in those of the molecular complexes under study.
This observation is quite opposite to that observed for hexamethylbenzene (HMB) and its complex with tetracyanoquinodimethane (TCNQ)36 and for durene and the durene–TCNB complex37 as well as for TMP and the MP–TCNB complex.38 For the latter compounds, it was found that the methyl groups rotated more freely in the crystals of the molecular complexes in comparison to those estimated for the pure crystals.
3.6 1H-NMR relaxation
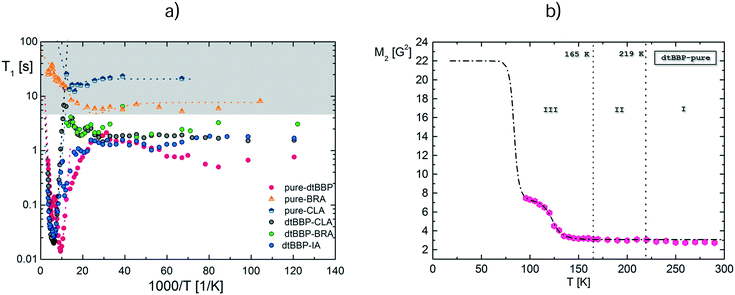
The temperature dependence of the 1H NMR spin–lattice relaxation times (T1) for the studied compounds is shown in Fig. 13a and S11 (ESI†). The dependence of T1 for the complexes of dtBBP with acids has two distinct ranges: the low temperature region with a plateau of T1 and a high temperature one with the double minimum.At low temperatures, below the liquid nitrogen temperature, the measured relaxation times form plateau with the nearly constant values of T1 (1.7 ÷ 3.25 s). This means that at these temperatures, the dominant mechanism of relaxation is related to the interactions of protons with the adjacent quadrupolar halogen atoms. Moreover, the single minima in the spin–lattice relaxation times have been detected for the complexes under study. We have attempted to fit these single minima taking into account the interactions of protons with neighbouring quadrupolar halogen nuclei (Cl, Br).39,40 The interactions are probably the main reason of the visible characteristic flattening of the spin–lattice relaxations time runs at low temperature.
The obtained theoretical fit curves were drawn with the quadrupolar spin–lattice rates of each halogen (RClQ = 5.7 × 10⁻⁹ s and RBrQ = 4.0 × 10⁻⁹ s) and with suitable relaxation constants CHCl = 3.1 × 10⁶ s−2 and CHBr = 5.9 × 10⁶ s−2. As usual, the quadrupolar relaxation has been assumed to be temperature independent. The contribution of the dipole–dipole coupling to the effective modulations of the proton–quadrupolar halogen interactions causes the proton relaxation time to appear to remain constant despite the fact that the correlation time, τc, becomes very long at low temperatures.
In the other temperature range, near the liquid nitrogen temperature, for each studied sample, the wide and double minimum has been observed with the following parameters: T1min = 15 ms at 105 K and T1min = 62 ms at 187 K for pure dtBBP, T1min = 19 ms at 160 K and T1min = 24 ms at 200 K for dtBBP·CLA, T1min = 26 ms at 155 K and T1min = 38 ms at 230 K for dtBBP·IA. The analysis of the double spin–lattice relaxation time minima according to the BPP41 theory requires that the sum of two different contributions has to be taken into account:
 | (3) |
![[thin space (1/6-em)]](https://www.rsc.org/images/entities/char_2009.gif) :
:![[thin space (1/6-em)]](https://www.rsc.org/images/entities/char_2009.gif) C2 = 2
C2 = 2![[thin space (1/6-em)]](https://www.rsc.org/images/entities/char_2009.gif) :
:![[thin space (1/6-em)]](https://www.rsc.org/images/entities/char_2009.gif) 1, in which for every sample the low temperature relaxation component is greater than the high temperature one. Moreover, for the complexes of dtBBP with acids at high temperatures, we have found the rather high values of the negative index of the correlation times for the relaxing component. This means that the relaxation times found for the dtBBPH+ cations are similar to those estimated for the similar molecules.42,43
1, in which for every sample the low temperature relaxation component is greater than the high temperature one. Moreover, for the complexes of dtBBP with acids at high temperatures, we have found the rather high values of the negative index of the correlation times for the relaxing component. This means that the relaxation times found for the dtBBPH+ cations are similar to those estimated for the similar molecules.42,43
For neat dtBBP, the temperature dependence of the second moment, M2, of the proton NMR line (Fig. 13b) has been measured between 96 K and 293 K. On heating from 96 K, the second moment decreases from about 8 G2 to about 3 G2 around 140 K. Then, up to room temperature, the values of the second moment remain nearly constant. The theoretical calculations of the second moment were carried out according to the van Vleck method44 for the rigid state of dtBBP, basing on the structural crystallographic data with an assumed distance between carbon and hydrogen atoms, C–H, equals 1.09 Å. The calculations lead to a value of MRigid2 equals 21.88 G2. This result means that such a frozen state of the analysed compound has not been reached. The characteristic bend of the reduction of the second moment value just above 96 K suggests that the whole narrowing of the proton NMR line should undergo in two steps. It was impossible to carry out the measurements of M2 at low temperatures due to the limitation of the cooling system, so that, regretfully, the first step has not been detected. Nevertheless, the theoretical dashed line as shown in the Fig. 13b is perfectly consistent with the experimental results of the other reduction of M2 in the vicinity of 100 K. The similar behaviour of the second moment has been found in the other compounds analysed by us.45,46 In the latter papers, the way of the fitting procedure for the M2 temperature runs was described in detail. For this reduction, the dynamical parameters obtained are the following: activation energy Ea = 4.3 kcal mol−1 (18 kJ mol−1) and correlation time τc0 = 4.3 × 10⁻¹³ s. It should be noted that the expected value of M2 at low temperatures, i.e. 23 G2 = 21.88 G2 plus inter component, reduces at high temperature to nearly a quarter of its primary value, which additionally confirms our estimation.
4. Discussion and conclusions
In this paper, we have described the properties of pure base 4,4′-di-tert-2,2′-bipyridyl (dtBBP) and its two molecular complexes containing two different organic acids: bromanilic (dtBBP·BRA) or iodanilic (dtBBP·IA) acid. The main purpose of this work was the detailed analysis of the intermolecular interactions in the solid state and their effect on the macroscopic properties of the crystals. The experimental results are compared with those of the chloranilic analogue (dtBBP·CLA).17,18The single-crystal X-ray diffraction studies reveal that all complexes of dtBBP with halo-anilic acids described in this paper crystallize in the 1![[thin space (1/6-em)]](https://www.rsc.org/images/entities/char_2009.gif) :
:![[thin space (1/6-em)]](https://www.rsc.org/images/entities/char_2009.gif) 1 stoichiometry. We have found that both crystals of dtBBP·BRA and dtBBP·IA show a layer structure. The molecular organization within the layer is governed by two types of the intermolecular interactions. First interactions are related to the OH⋯N hydrogen bonds and the other ones to π–π stacking which connects chains into layers. The crystal packing of the pure dtBBP can be described by the layer structure as well. The interactions exhibit, however, a different nature (dispersive).
1 stoichiometry. We have found that both crystals of dtBBP·BRA and dtBBP·IA show a layer structure. The molecular organization within the layer is governed by two types of the intermolecular interactions. First interactions are related to the OH⋯N hydrogen bonds and the other ones to π–π stacking which connects chains into layers. The crystal packing of the pure dtBBP can be described by the layer structure as well. The interactions exhibit, however, a different nature (dispersive).
In both complexes with anilic acids, we deal with the proton transfer in the −O⋯HN+ hydrogen bond (h.b.) on one side of the dtBBP molecule. On the other side of dtBBP, we deal with the classical h.b. without proton transfer. The evidence of the dtBBPH+ protonation includes both the shortening of the C(5)–O(5) distances from 1.326 to 1.261 Å in BRA− or from 1.331 to 1.260 Å in IA−, and the enlargement of the C(16)–N(1)–C(12) angle from 116.9 to 122.0° and from 116.5 to 121.8, for dtBBP·BRA and dtBBP·IA, respectively.
Using thermal methods, the structural phase transitions were disclosed for the pure-dtBBP base and its complex with iodanilic acid (dtBBP·IA). For the dtBBP·BRA complex, no phase transition has been found. Then the phase diagram has been constructed (see Scheme 2).
In the case of the pure base, dtBBP, upon cooling, one solid-to-solid phase transition was observed, at 216 K, while upon heating, two PTs appeared, at 165 K and 219 K. In all phases analysed, of course, on heating from 130 K, (phase III, II and I at 130, 190 and 250 K, respectively), space group P21/c is unchanged and the phases differ by the tert-butyl group ordering. This is accompanied by a doubling of the unit cell in comparison to that in phase I. In the intermediate phase, the freedom of the tert-butyl group changes gradually with temperature. In the lowest temperature phase III, both tert-butyl groups of the dtBBP molecule are ordered. The observed changes in the structure on one hand very weakly impact the dielectric response and, on the other hand, significantly affect the neutron scattering of dtBBP. The small dielectric increment may be explained by the very little change in the dipole moment of the molecule connected either with the methyl or tert-butyl group rotations.
The existence of the infinite hydrogen bonded chains in crystals favours the long range interactions, which may result in the collective proton jumps in the chain. In consequence, these crystals could reveal a large electric permittivity value as well as they could show polar properties at room temperature. The molecule of the dtBBP-base can be an excellent candidate for the creation of one-dimensional hydrogen ribbons with the dynamical disorder of protons. The comparison of dtBBP·CLA with dtBBP·BRA allows us to state that although the latter crystal does not exhibit any structural phase transition, the dielectric response also indicates the collective jump of the protons through the infinite hydrogen-bonded chains. The energy, which is necessary to activate the protons, is rather high (108 kJ mol−1). The question is why the exchange of the chlorine atoms by the bromine ones has such an impact on the crystal properties that no structural phase transition has been observed up to the decomposition of dtBBP·BRA. Relying on the crystallographic data, it is known that the adjacent polar chains in one layer are antiparallel in the dtBBP·BRA crystal structure as well. The reason why the phase transition is not observed in this case should be assigned to subtle changes in the geometrical parameters of the main hydrogen bonds. In the case of dtBBP with bromanilic acid, the length between donor N+(1) and proton H(1) is much longer than that for the dtBBP·CLA complex, 1.30(7) and 1.05(2), respectively. The distance between proton H(1) and acceptor O(5) is shorter for the bromanilic analogue (1.39(7), 1.60(2)-CLA). These data and the angle ∠(D…A) can suggest that the main hydrogen bond between the acid and the base in dtBBP·BRA is weaker than that in dtBBP·CLA. Most likely, the generally weaker interactions in the complex with bromanilic acid are the reason for any structural changes with temperature.
We did not succeed in obtaining the dtBBP·IA single crystals of good quality for dielectric measurements and, as a consequence, the results presented in Fig. S12 and S13 may be treated only qualitatively. Nevertheless, an increase of the real part of the complex electric permittivity of dtBBP·IA may indicate some proton motions in the h.b. in the vicinity of the structural phase transition at 331 K. These motions might be connected with the reorganizations of the molecular chains. This of course weakly affects the motions of methyl/tert-butyl groups.
The analysis of the QENS results over a broad temperature range allows us to evaluate the activation energy for the stochastic jumps of the methyl groups. In the temperature range between 150 and 300 K, the QENS signal has been observed for neat dtBBP and its complexes with the organic acids, CLA, BRA and IA. The activation energies found are slightly higher for the complexes than those estimated for neat dtBBP. The differences in the activation energy are most probably due to the other contact lengths between the hydrogen atoms in tert-butyl groups and the adjacent molecules. This causes the higher barrier for the methyl/butyl rotations in the complexes. It should be noted that the effect of the charge transfer in these molecules seems to be negligible, as there are insignificant differences among the dtBBP complexes with different acids.
The gradual release of the rotational freedom proposed in the crystals of dtBBP is almost consistent with runs of the 1H NMR second moment, M2. Taking into account the temperature dependence both of the spin–lattice relaxation time, T1, and M2, we can assume that at low temperatures, T < 100 K, the lattice of the dtBBP compounds is still not rigid. Below ca. 96 K, we deal still with the methyl group rotations, whereas the whole tert-butyl groups are rigid. Above let say 100 K, we can see the onset of the release of the whole tert-butyl group dynamics follows, which is manifested in the reduction of the M2 value. From these M2 runs it shows, however, that the tert-butyl group rotations begin already in phase III (below 165 K).
The magnetization relaxation found for the complexes studied seems to be similar in nature to that in the case of the other molecular-ionic crystals investigated by us earlier.37,38 At high temperature, the double minimum on the T1 runs for all three compounds, with the proportion 2![[thin space (1/6-em)]](https://www.rsc.org/images/entities/char_2009.gif) :
:![[thin space (1/6-em)]](https://www.rsc.org/images/entities/char_2009.gif) 1, may suggest that at temperatures close to the liquid nitrogen temperature, methyl groups' non-equivalence in the crystal structure in this proportion is present.
1, may suggest that at temperatures close to the liquid nitrogen temperature, methyl groups' non-equivalence in the crystal structure in this proportion is present.
The temperature dependent infrared spectra confirmed first of all the proton transfer in hydrogen bonds in the molecular complex of dtBBP·IA. We have observed the fingerprints of the O–H⋯N hydrogen bond and the bands assigned to the vibrations of the NH+ group (ca. 2300 cm−1). As regards to the phase transitions found at 165 and 219 K for pure dtBBP and at 331 K for dtBBP·IA, only very small changes with temperature could be found. The most spectacular changes are observed for the bands assigned to the C–H vibrations. This is consistent with the postulated changes in dynamics of the methyl/tert-butyl groups with temperature. Particularly the mechanism of the phase transition at 331 K for dtBBP·IA may affect very slightly the infrared spectra since it is connected with different organizations of the hydrogen bonded chains of molecules. This is also consistent with the observed dielectric response of the crystals.
In the case of the infrared spectra of the pure dtBBP, the changes are observed only around the high temperature phase transition at 219 K and they are undoubtedly connected with the change of the methyl/tert-butyl dynamics. The spectra were recorded for the suspensions in Nujol, which exhibit the bands overlapping those coming from the OH groups involved in the hydrogen bonds, so that no changes in the spectra could be observed in this region.
Conflicts of interest
There are no conflicts to declare.Acknowledgements
The authors gratefully acknowledge the financial support provided by the JCNS to perform the neutron scattering measurements at the Heinz Maier-Leibnitz Zentrum (MLZ), Garching, Germany.The author, Marcin Moskwa gratefully acknowledges the financial support provided by Wroclaw Centre of Biotechnology, programme The Leading National Research Centre (KNOW) for years 2014–2018.
The paper is a result of the realization of the project No. UMO-2016/21/B/ST3/004640201/2078/17 financed by National Science Centre, Poland.
References
- P. H. Stahl and C. G. Wermuth, Handbook of pharmaceutical salts: properties, selection and use; International Union of Pure and Applied Chemistry, Wiley-VCH, Weinheim, New York, 2002 Search PubMed.
- S. L. Johnson and K. A. Rumon, J. Phys. Chem., 1965, 69, 74–86 CrossRef CAS.
- A. J. Cruz-Cabeza, CrystEngComm, 2012, 14, 6362–6365 RSC.
- K. Molčanov and B. Kojić-Prodić, CrystEngComm, 2010, 12, 925–939 RSC.
- W. Sawka-Dobrowolska, G. Bator, B. Czarnik-Matusewicz, L. Sobczyk, A. Pawlukojć, E. Grech, J. Nowicka-Scheibe and H. Rundlöf, Chem. Phys., 2006, 327, 237–246 CrossRef CAS.
- M. Prager, A. Wischnewski, G. Bator, E. Grech, A. Pawlukojć and L. Sobczyk, Chem. Phys., 2007, 334, 148–153 CrossRef CAS.
- A. Pawlukojć, M. Prager, W. S. Dobrowolska, G. Bator, L. Sobczyk, A. Ivanov, S. Rols, E. Grech, J. Nowicka-Scheibe and T. Unruh, J. Chem. Phys., 2008, 129, 154506 CrossRef PubMed.
- J. Nowicka-Scheibe, E. Grech, W. Sawka-Dobrowolska, G. Bator, A. Pawlukojć and L. Sobczyk, J. Mol. Struct., 2010, 976, 30–35 CrossRef CAS.
- G. Bator, W. Sawka-Dobrowolska, L. Sobczyk, E. Grech, J. Nowicka-Scheibe, A. Pawlukojć, J. Wuttke, J. Baran and M. Owczarek, J. Chem. Phys., 2011, 135, 44509 CrossRef CAS PubMed.
- G. Bator, L. Sobczyk, W. Sawka-Dobrowolska, J. Wuttke, A. Pawlukojć, E. Grech and J. Nowicka-Scheibe, Chem. Phys., 2013, 410, 55–65 CrossRef CAS.
- G. Bator and L. Sobczyk, Trends Org. Chem., 2014, 17, 93–105 Search PubMed.
- S. Horiuchi, F. Ishii, R. Kumai, Y. Okimoto, H. Tachibana, N. Nagaosa and Y. Tokura, Nat. Mater., 2005, 4, 163–166 CrossRef CAS PubMed.
- S. Horiuchi, R. Kumai and Y. Tokura, J. Mater. Chem., 2009, 19, 4421 RSC.
- J. Fujioka, S. Horiuchi, N. Kida, R. Shimano and Y. Tokura, Phys. Rev. B: Condens. Matter Mater. Phys., 2009, 80, 1–8 CrossRef.
- K. Kobayashi, S. Horiuchi, S. Ishibashi, F. Kagawa, Y. Murakami and R. Kumai, Chem. – Eur. J., 2014, 20, 17515–17522 CrossRef CAS PubMed.
- S. Horiuchi and Y. Tokura, Nat. Mater., 2008, 7, 357–366 CrossRef CAS PubMed.
- M. Rok, A. Piecha-Bisiorek, P. Szklarz, G. Bator and L. Sobczyk, Chem. Phys., 2015, 452, 53–60 CrossRef CAS.
- G. Bator, W. Sawka-Dobrowolska, L. Sobczyk, M. Owczarek, A. Pawlukojć, E. Grech and J. Nowicka-Scheibe, Chem. Phys., 2012, 392, 114–121 CrossRef CAS.
- H. A. Torrey and W. H. Hunter, J. Am. Chem. Soc., 1912, 34, 702–715 CrossRef CAS.
- G. M. Sheldrick, Acta Crystallogr., Sect. A: Found. Crystallogr., 2007, 64, 112–122 CrossRef PubMed.
- G. M. Sheldrick, Acta Crystallogr., Sect. C: Struct. Chem., 2015, 71, 3–8 CrossRef PubMed.
- M. Zamponi and M. Khaneft, J. Large-scale Res. Facil., 2015, 1, A30 CrossRef.
- J. Wuttke, SLAW - A neutron histogram to scattering law converter, http://apps.jcns.fz-juelich.de/slaw/ Search PubMed.
- J. Wuttke, FRIDA - Flexible rapid interactive data analysis, http://apps.jcns.fz-juelich.de/frida/ Search PubMed.
- S. Horiuchi, R. Kumai and Y. Tokura, Angew. Chem., Int. Ed., 2007, 46, 3497–3501 CrossRef CAS PubMed.
- S. L. Childs, G. P. Stahly and A. Park, Mol. Pharmaceutics, 2007, 4, 323–338 CrossRef CAS PubMed.
- M. A. Slifkin and B. M. Smith, Spectrochim Acta A, 1969, 25, 1479–1489 CrossRef CAS.
- P. K. Kipkemboi, P. P. Kiprono and J. J. Sanga, Bull. Chem. Soc. Ethiop., 2003, 17, 211–218 CAS.
- E. Castellucci, L. Angeloni, N. Neto and G. Sbrana, Chem. Phys., 1979, 43, 365–373 CrossRef CAS.
- K. Łuczyńska, K. Drużbicki, K. Lyczko and J. C. Dobrowolski, J. Phys. Chem. B, 2015, 119, 6852–6872 CrossRef PubMed.
- M. Karlsson, Phys. Chem. Chem. Phys., 2015, 17, 26–38 RSC.
- M. Kofu, M. Tyagi, Y. Inamura, K. Miyazaki and O. Yamamuro, J. Chem. Phys., 2015, 143, 234502 CrossRef PubMed.
- T. Springer, Quasielastic Neutron Scattering for the Investigation of Diffusive Motions in Solids and Liquids, Springer-Verlag, Berlin Heidelberg New York, 1972, vol. 64 Search PubMed.
- J. D. Barnes, J. Chem. Phys., 1973, 58, 5193 CrossRef CAS.
- M. Bee, Quasielastic Neutron Scatering, Adam Hilger, Bristol and Philadelphia, 1988 Search PubMed.
- W. Sawka-Dobrowolska, G. Bator, L. Sobczyk, A. Pawlukojć, H. Ptasiewicz-Bak, H. Rundlöf, J. Krawczyk, M. Nowina-Konopka, P. Jagielski, J. A. Janik, M. Prager, O. Steinsvoll, E. Grech and J. Nowicka-Scheibe, J. Chem. Phys., 2005, 123, 1243305 CrossRef.
- G. Bator, L. Sobczyk, A. Pawlukojć, J. Nowicka-Scheibe, E. Grech, J. Krawczyk, M. N. Konopka, I. Natkaniec, I. V. Kalinin and O. Steinsvoll, Phase Transitions, 2007, 80, 489–500 CrossRef CAS.
- J. Krawczyk, M. Nowina Konopka, J. A. Janik, O. Steinsvoll, G. Bator, A. Pawlukojć, E. Grech, J. Nowicka-Scheibe and L. Sobczyk, Collect. Czech. Chem. Commun., 2009, 74, 73–84 CrossRef CAS.
- J. Przesławski, W. Medycki, A. Piecha, R. Jakubas and D. Kruk, Chem. Phys., 2013, 410, 19–24 CrossRef.
- M. Węcławik, P. Szklarz, W. Medycki, R. Janicki, A. Piecha-Bisiorek, P. Zieliński and R. Jakubas, Dalton Trans., 2015, 44, 18447–18458 RSC.
- N. Bloembergen, E. M. Purcell and R. V. Pound, Phys. Rev., 1948, 73, 679–712 CrossRef CAS.
- M. Węcławik, A. Gągor, A. Piecha, R. Jakubas and W. Medycki, CrystEngComm, 2013, 15, 5633 RSC.
- M. Wojciechowska, P. Szklarz, A. Białońska, J. Baran, R. Janicki, W. Medycki, P. Durlak, A. Piecha-Bisiorek and R. Jakubas, CrystEngComm, 2016, 18, 6184–6194 RSC.
- J. H. Van Vleck, Phys. Rev., 1948, 74, 1168–1183 CrossRef.
- P. Szklarz, J. Zaleski, R. Jakubas, G. Bator, W. Medycki and K. Falińska, J. Phys.: Condens. Matter, 2005, 17, 2509–2528 CrossRef CAS.
- W. Medycki and R. Jakubas, Solid State Nucl. Magn. Reson., 1999, 15, 73–77 CrossRef CAS PubMed.
Footnote |
| † Electronic supplementary information (ESI) available. CCDC 1567116–1567121. For ESI and crystallographic data in CIF or other electronic format see DOI: 10.1039/c7ce01481c |
| This journal is © The Royal Society of Chemistry 2017 |

