 Open Access Article
Creative Commons Attribution 3.0 Unported Licence
Molecular dynamics simulations of aqueous glycine solutions†
Yuriy G.
Bushuev
 *,
Svetlana V.
Davletbaeva
 and
Oscar I.
Koifman

Institute of Chemistry of Macro Heterocyclic Compounds, Ivanovo State University of Chemistry and Technology, pr. Sheremetevskiy, 7, Ivanovo, 153000, Russia. E-mail: yuriyb2005@gmail.com
First published on 7th November 2017
Abstract
Simulations of glycine aqueous solutions have been carried out to study the effect of increasing solute concentration on the aggregation of glycine zwitterions. AMBER force field coupled with three atomic charge sets was employed for the simulations of the aqueous solutions. The number of glycine monomers in solutions rapidly decreases with increase in concentration. The properties of the glycine clusters in the solutions were studied. It was shown that the clusters are strongly hydrated entities with a liquid-like character. The residence lifetimes of water and glycine from the first solvation shell of glycine molecules were calculated. The lifetime values show that the clusters are highly dynamic solutes that change configuration within hundreds of picoseconds. We observed long-living pairs of glycine molecules, which move together in the solutions for ca. 1 ns. The effect of the electric-field-induced orientation of the highly polar glycine molecules in the clusters was studied. A preferential parallel arrangement of the molecules was observed as the distinctive feature of the γ-polymorph, which was crystallized from the solutions in a static electric field.
Introduction
Glycine is abundant in various proteins and enzymes. It is the smallest molecule among amino acids, which explains why glycine is an attractive object for investigation using experimental and computer simulation methods. In its crystalline states and in neutral aqueous solution, glycine exists in the zwitterionic form, NH3+–CH2–COO−. Three solid polymorphs, which are designated as α-, β- and γ-glycine, are detected under ambient conditions. A lot of factors affect glycine crystallization from a solution, such as pH, additives, degree of supersaturation, solvent, impurities and seeding. These conditions determine the properties of the synthesized materials. Polymorphs have different physical and chemical properties including stability, solubility, melting point, compressibility and bioavailability.1,2It has been established that γ-glycine is the most stable polymorph, whereas β-glycine has the highest free energy.3–5 Under ambient conditions and neutral pH, an aqueous solution of glycine is predominantly crystalized as the α-polymorph. The crystallization of a particular polymorph is poorly reproducible. Boldyreva et al. argued that the three polymorphs crystallize simultaneously.4 The nucleation and crystal growth of α- and γ-glycine from the same solution have been investigated experimentally.6 Little et al.6 concluded that the rate of nucleation is very sensitive to impurities, the conditions in which the samples are prepared and supersaturation. The least stable β-glycine polymorph crystalizes from aqueous solutions containing methanol or ethanol7 or from the gas phase via sublimation of the α or γ forms in vacuum.8
It has been shown that intense nanosecond near-infrared laser pulses could induce supersaturated aqueous glycine solutions to crystallize into either the α- or γ-polymorph depending on the polarization state of the laser beam.9,10 This phenomenon is called non-photochemical laser-induced nucleation (NPLIN). Linearly polarized near-infrared laser pulses or a strong dc electric field applied to a supersaturated aqueous glycine solution induces the crystallization of γ-glycine.11 These methods could be used to control polymorph formation.
The difference in the size and shape of the glycine particles was observed when cooling and evaporative methods were used in their preparation with the addition of surfactants.12 Recent studies have indicated that under certain circumstances, in microemulsions and lamellar phases, the γ-glycine rather than the more common α-glycine can be crystallized.13 It was proposed that the experimental results could be rationalized if it is postulated that molecular clusters binding to the interface were formed in the microemulsions. Glycine clusters can be captured by the charged surfactant monolayer. The structural and orientational specificity of the nucleation process must then be the result of the overall polarity of the clusters involved. However, the organization of the glycine clusters in solutions formed through the electric-field-induced alignment of molecules has not been studied using computer simulation methods, which could provide information regarding the structure of the solutions.
Computer simulations of glycine polymorphs and their aqueous solutions have been performed.14–21 Classical molecular dynamics (MD) simulations are based on using of force fields, which usually include intra- and inter-molecular terms. The results of the computer simulations depend on the employed force field. To minimize this influence, the calculations should be repeated with different force fields. Various sets of potentials have been proposed for the calculation of glycine interactions. AMBER force field was particularly designed for the simulation of amino acids, proteins and large organic molecules.22 It has been widely used for simulations over the last several decades. To calculate the energy of the Coulombic interactions, numerous atomic charge sets are employed. For a specific compound, the atomic charges are chosen according to results of quantum mechanics calculations or they are fitted to reproduce the experimental properties of solids, liquids or solutions. Systematic investigations of the applicability of different force fields for the simulation of glycine aqueous solutions have been published. Cheong and Boon21 used Charmm27, AMBER, OPLS and GROMOS force fields with six charge sets adopted for the calculation of the electrostatic interactions. The authors concluded that the AMBER force field coupled with CNDO charges is the optimal force field to be used for simulation studies of the α-glycine crystal growth.
Understanding the crystal growth mechanism is valuable for pharmaceutical industry and drug design. Glycine is a major precursor in the biosynthesis of porphyrins. New functional materials based on macro-heterocyclic compounds and their complexes have been widely used in various fields of science, technology and medicine. Of particular interest is the study of porphyrin complexes with various amino acids and biomolecules.23,24 For this purpose, the properties of glycine solutions should be investigated. It has been proposed25 that among a set of compounds, such as calcium carbonate, calcium phosphate and silica, amino acids form pre-nucleation clusters (PNCs) in aqueous solutions, which have specific properties. The PNCs are solute precursors to the phases formed from a homogeneous solution, but, to date, the actual scenario of nucleation and crystallization from glycine aqueous solutions is unknown.
The goal of this article is the study of the glycine clusters formed in aqueous solutions at different concentrations. The size distribution and radii of gyration are the basic properties of clusters. To characterize the stability of the clusters, the residence lifetimes were calculated: (a) for water from the first hydration shells of hydrophilic moieties of a glycine and (b) for glycine molecules forming clusters. To shed light on the molecular mechanism of the NPLIN phenomenon, the structure of a saturated solution of glycine under an applied dc electric field was investigated.
Methods
Classical molecular dynamics (MD) simulations were employed to study the aqueous solutions of glycine. All calculations were performed using the DL_POLY Classic 1.9 program26,27 in the isotropic NpT ensemble at T = 300 K, 350 K and p = 0.1 MPa. The Nosé–Hoover thermostat and barostat, designed by Melchionna et al.,28 was employed with relaxation times of 0.1 ps (T) and 1 ps (p) as previously recommended.29 An example of the typical time-dependence of volume and energy is presented in Fig. S1.† The integration time-step was 1 fs. The cubic boxes, taken with the periodic boundary conditions, contained 1200 water and 12, 36 and 72 glycine molecules. The last composition corresponds to the concentration of a saturated solution of glycine (m = 3.33 mol kg−1).30 A cut-off radius of 12 Å was used for both the non-bonded and electrostatic interactions. Long-range electrostatic interactions were treated using the Ewald method. The relaxation period was ca. 1 ns. For trajectory analysis, the structures were saved every 10![[thin space (1/6-em)]](https://www.rsc.org/images/entities/char_2009.gif) 000 time-steps (Δt = 10 ps), however, the interval was of 1 ps when the diffusion coefficients were calculated. The simulation time in each productive run exceeded 3 ns (Table S1†). A cluster analysis was performed on the simulation snapshots of the liquids to determine how the glycine molecules tend to associate with each other in the aqueous solutions. The Edvinsson algorithm31 was used to calculate cluster statistics.
000 time-steps (Δt = 10 ps), however, the interval was of 1 ps when the diffusion coefficients were calculated. The simulation time in each productive run exceeded 3 ns (Table S1†). A cluster analysis was performed on the simulation snapshots of the liquids to determine how the glycine molecules tend to associate with each other in the aqueous solutions. The Edvinsson algorithm31 was used to calculate cluster statistics.
AMBER force field, which is well-proven in the simulation of large organic molecules, was applied to calculate the intra- and inter-molecular interactions of glycine.22 The charge–charge interactions between atoms in a molecule separated by 3 bonds (1–4 interactions) were scaled by a factor of 1/1.2 and the Lennard-Jones interactions by a factor of 0.5. To calculate the interactions of the water molecules, the SPC/Fw potential32 was selected, which takes into account the flexibility of the water molecules. We employed the DL_FIELD version 3.2 program package, which simplifies the procedure of creating the FIELD file required for the DL_POLY program.
Based on the results of the quantum-chemical calculations, various charge models were proposed for glycine.14,23,24,29,39,40 In the present study, the three charge sets, summarised in Table 1, were used for the MD simulations. The ESP (the Merz–Kollman scheme) electrostatic partial charge method was used to derive the B3LYP partial charges.16 The CNDO charge set was calculated from gross Mulliken populations.33 Despite the arbitrary nature of the method, these atomic charge sets were used in the calculations and a good reproduction of experimental properties of the crystals and aqueous solutions of glycine was demonstrated.21,34 We slightly corrected the B3LYP charge set. According to our calculations, the modified B3LYP (mB3LYP) charge set predicts α- and γ-glycine structures better than the other sets. Any force field used for flexible glycine molecules contains terms that take into account the rotations of the –COO and –NH3 groups. Thus, the original atomic charges proposed for a rigid molecule were slightly corrected to eliminate the difference in the charges of the O and H atoms when the molecule adopts various conformations. The dipole moment of a glycine molecule was calculated to be 10.3, 13.8 and 13.5 D for the CNDO, B3LYP and mB3LYP sets, respectively. The results of the ab initio MD simulation of an aqueous glycine solution demonstrate that the dipole moment of a glycine molecule increases by about 40% due to polarization effects and it was around 16.5 D.23 To investigate a possible dependence of the results on the employed force field, independent simulations of the systems were carried out with three charge sets. The parameters of the force field are presented in ESI.†
Results and discussion
Density and self-diffusion coefficients
To test the reliability of the models, the densities and diffusion coefficients were calculated for the aqueous solutions of glycine. In the equilibrium MD simulation, the self-diffusion coefficient (D) was computed by taking the slope of the mean-squared displacement (MSD) at long time | (1) |
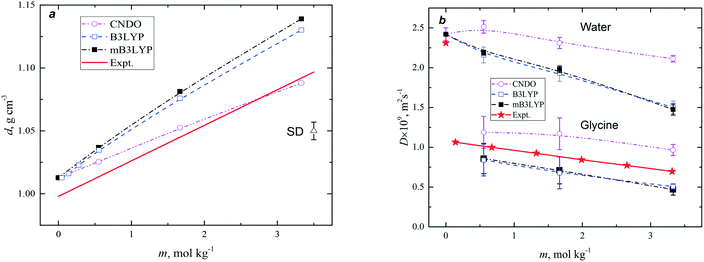
The experimental35 and calculated densities are plotted in Fig. 1a. The density of SPC/Fw water was about 1% higher than the experimental value, therefore the difference between the calculated and experimental density of pure water could be taken into consideration. The presented results demonstrate an almost linear increase in the density of the solution with increase in concentration of glycine. The slopes of the fitting lines, corresponding to the B3LYP and mB3LYP models, slightly differ from that obtained experimentally. This is a typical situation observed for several force fields. The force fields GAFF, OPLS and Charmm with default atomic charge sets predict higher density of solutions with respect to the experimental values.21 By choosing the appropriate charge set, it is possible to reach a better agreement with the experimental data, but it does not mean that other properties of the aqueous solutions would be effectively reproduced.
Fig. 1b shows the variation of the calculated self-diffusion coefficients of glycine and water with the solute concentration. The diffusion coefficient of water molecules is more than two times larger than the diffusion coefficient of glycine in solution. The diffusivity of water and glycine decreases with increase in concentration. The CNDO model demonstrates a weaker concentration dependence of the water diffusivity. The experimental36 self-diffusion coefficients of glycine in the solutions were taken for comparison with the results of our calculations. The calculated values are slightly higher (CNDO) or lower (B3YLP and mB3LYP) than the experimental values.
For pure water the calculated D = (2.42 ± 0.08) × 10−9 m2 s−1 (SPC/Fw), which is larger than the experimental D = 2.3 × 10⁻⁹ m2 s−1.37 The weak and approximately linear dependence of water diffusivity on the concentration has been reported for the AMBER force field with other charge sets.38 Thus, the presented models of the solutions are in agreement with the experimental data. The variation observed for the calculated properties are in accordance with the results of previous simulations, where other force fields were tested.25,29,38 The experimental diffusion coefficients obtained for the glycine in solutions are slightly over- (CNDO) or under-estimated (B3LYP and mB3LYP) in the computer models and these effects correlate with the dipole moment of the glycine molecules. In solution, the diffusivity of glycine and water decreases with an increase in the dipole moment. We could expect that for better correspondence with the experimental data, the model of the glycine molecule should have a dipole moment of about 12 D.
Correlation functions and running coordination numbers
Radial distribution functions (RDFs) are usually used for the description of disordered systems. The structure of the hydration shells of glycine molecules has been discussed previously.14,15,39–41 The present investigation is primarily focussed on the study of the aggregation of glycine in the solutions. Therefore, to avoid a repetition of the results, only two functions, which characterize the distribution of nitrogen atoms, gNN, and oxygen atoms with respect to the nitrogen atoms, gNO as well as the corresponding running coordination numbers, were calculated to analyse the structures formed by glycine molecules in the aqueous solutions.These functions are presented in Fig. 2 and S4.† They depend on the model and concentration of the solutions; however, these functions demonstrate similar behaviour. Two overlapping peaks for gNN were observed at r < 6.5 Å and correspond to the minimum two types of atomic coordination in the first solvation shell of each nitrogen atom. The NNN functions show that the aggregation of glycine molecules increases with increase in concentration and was larger for the CNDO model at any concentration despite having the smallest dipole moment of the molecule. The gNO functions (Fig. S4†) exhibit the first peak at ca. 3 Å, corresponding to the formation of intermolecular hydrogen bonds between hydrogens of the amino group and oxygens of nearest glycine molecules. The running coordination numbers, NNO, show larger molecular aggregation when the CNDO charge set was used for the simulations.
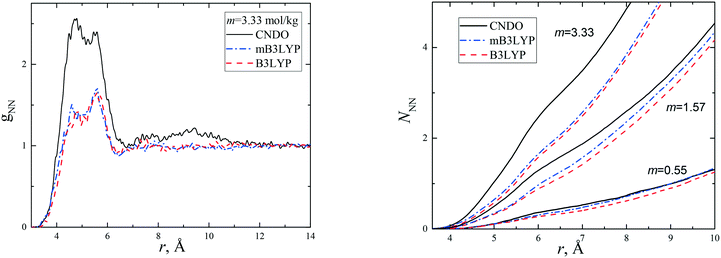 | ||
| Fig. 2 Radial distribution functions, gNN(r), and running coordination numbers, NNN(r), obtained for the nitrogen atoms of glycine in aqueous solutions with various solute concentrations (m). | ||
The molecular configurations, presented in Fig. S5 and S6,† show that various types of glycine aggregation are possible at m = 3.33 mol kg−1. The two small glycine clusters are presented in Fig. S7.† The first cluster is a compact three-member ring, while the larger cluster has a complex structure, where a compact ‘head’ is connected to a long ‘tail’.
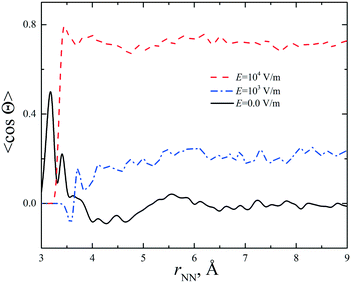
It was shown11 that a strong static electric field (E = 6 × 10⁵ V m−1) applied to supersaturated aqueous glycine solutions (SS is ca. 2.0) results in the nucleation of the γ-polymorph. We performed simulations of the concentrated aqueous solutions under a dc electric field at E = 103 and 104 V m−1. A preferable orientation of the glycine molecules along the electric field was observed. The average cosine of the angle between the vectors connecting the carbon atoms (H2C → CO2) in the glycine molecules was calculated. The results are presented in Fig. 3 and S8† for the CNDO and mB3LYP force fields. The cosine value increases with the increase in electric field strength and becomes close to 1. The parallel arrangement of the C–C vectors is a distinctive feature of the γ-polymorph (Fig. S9†). The temperature has little effect on the orientation of the glycine molecules in these electric fields. The crystallization of glycine is a long process and cannot be reproduced using computer simulations; however, the results obtained in our study show the orientational ordering of the glycine molecules in the solutions when a strong electric field was applied. This corresponds to experimental observations.
Finite cluster size distributions and radius of gyration
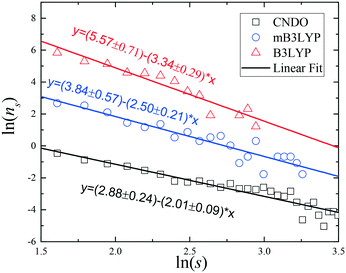
RDFs provide general information on the correlations between the atomic positions in liquids. The types of molecular association can be studied using cluster analysis, which is widely used in percolation theory.42 Phase transitions and percolation have many similarities. The percolation threshold, pc, is a point of singularity for many properties and these properties show a universal scaling behavior around percolation. In particular, the number of finite clusters decreases with the increase in cluster size, s, according to ns ∼ s−τ, where τ = 2.189 is a universal constant and s is the number of molecules in the cluster.43 The radius of gyration, Rg, is a fundamental characteristic of the finite clusters calculated according to the formula: | (2) |
The clustering of glycine molecules in an aqueous solution was studied previously.20,39 Two specific hydrogen bond criteria, a H⋯O distance of 2.2 Å and a minimum N–H⋯O angle of 140° as well as 2.2 Å per 160° were used in analysis of the clustering of glycine molecules from the MD simulations. In the aqueous solutions the hydrogen bonds are constantly forming and breaking only to form once again. It was shown20,39 that the lifetime of the hydrogen bonds was about of 1–4 ps. Due to the coordinated collective movement of the molecular aggregates, the glycine molecules stay close to each other for a longer time. This type of movement has not been studied to date.
To avoid a repetition of the same calculations and to obtain new information, we did not analyse the hydrogen bonding; thus, in the present study, a criterion of mutual proximity of glycine molecules was applied. The position of the nitrogen atom was taken as a center of a monomer (s = 1) and the glycine molecule was considered belonging to a cluster if the distance between the nitrogen atom and any other nitrogen in the cluster was less than 6 Å. This distance approximately corresponds to the first coordination shell of glycine molecule (Fig. 2). Clearly, the cluster properties depend on the value of the threshold distance; however, this is not very important for a general characterization of the aggregation of glycine molecules in the solutions.
In all the investigated cases, spanning glycine clusters were not formed in the simulation boxes at E = 0 V m−1. All the observed clusters were finite. This means that even at m = 3.33 mol kg−1 the systems are located below the percolation threshold and the indexes could deviate from the universal critical values. A large cluster comprised of 40 molecules is presented in Fig. 4. Bulky fragments containing 4–6 molecules connected by chains are observed.
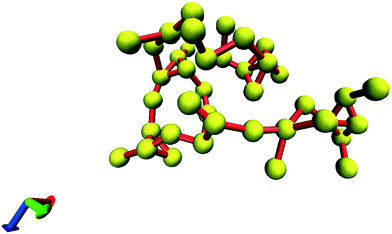 | ||
| Fig. 4 The finite cluster consisting of 40 glycine molecules, (Rg = 13 Å). Nitrogens are shown as yellow balls. Red sticks connect the nearest nitrogen atoms. | ||
The cluster size distributions, ns(s), were calculated from our simulations for m = 3.33 mol kg−1 (72 glycine molecules in the simulation box) and they are depicted in Fig. 5 and S10.† A broad spectrum of the cluster sizes was observed in the saturated solution. The presented distributions depend on the charge set used. All the systems are far from the percolation threshold; however, when the CNDO charge set was used, the slope of the fitting line was closer to the value of universal exponent, τ = 2.19. The results of the small-angle neutron scattering (SANS) experiments show that the glycine aggregates in the solutions can be described by relatively broad distributions of both size and shape.41 The set of clusters presented in Fig. S5–S7† show that the clusters have various shapes. Thus, the results of our computer simulations are in agreement with the results of the SANS experiments.
Temperature has little effect on the distribution as shown in Fig. S11.† However, a strong electric field supports cluster formation. The number of small glycine clusters (s < 7) decreases slightly at 350 K and E = 104 V m−1, but the number of large clusters increases significantly. Percolated chain- and strip-like glycine clusters are observed in the simulation box. Some of these are shown in Fig. S12.†
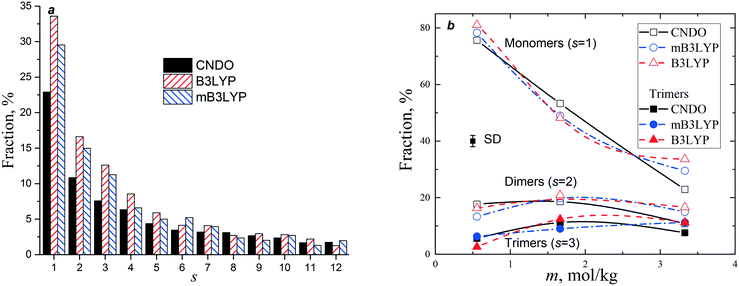
The probabilities of finding a glycine molecule in a monomeric state (s = 1) and small clusters (s < 13) are presented in Fig. 6. The fraction of the monomers drops from ca. 80% at m = 0.55 mol kg−1 to 25–35% in the saturated solution, whereas the fractions of glycine molecules belonging to dimers and trimers weakly depends on the solute concentration. Small clusters prevail in all the models, but the system computed with the B3LYP charge set has a larger amount of small clusters (s < 6). The calculated fractions are consistent with the previously reported results obtained using a different force field and a criterion of a molecular aggregation.41 It is noteworthy that a significant variation in the fraction of glycine molecules in the monomers, dimers and trimers was not observed in a temperature range from 20 to 50 °C.41
An average cluster size and an average radius of gyration are the first moments of the distribution, ns:
 | (3) |
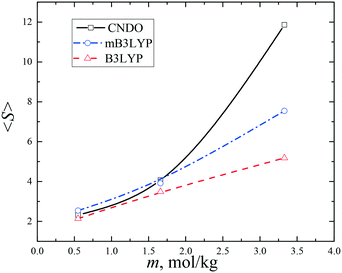 | ||
| Fig. 7 Average sizes 〈S〉 of the glycine clusters in the aqueous solutions. The lines connecting the data points are drawn to guide the eye. | ||
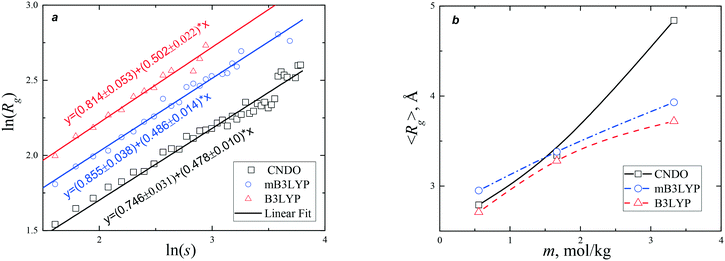
The plots of Rg(s) calculated from our simulations are depicted in Fig. 8 and S13.† The slopes of the fitting lines deviate from the universal scaling law (1/df = 0.396) because the systems are far from the percolation threshold. The larger values of the slopes indicate that the clusters grow in 3-D space faster than the clusters near the percolation threshold. The fractal dimension of the clusters was ca. 2.0–2.1. The radii of gyration calculated at 350 K with and without an external electric field are presented in Fig. S14.† The cluster size distribution and radii of gyration are the basic properties of the system. They depend on the model used; however, the temperature and strong electric field do not affect these distributions. The number of large clusters increases with increase in the electric field and they have large radii.
The nucleation and crystallization of glycine from a supersaturated solution were studied using a small angle X-ray scattering (SAXS) method.44,45 In order to achieve supersaturation, two procedures of cooling were used. The measured average radius of gyration monotonically increased upon cooling from 3.38 to 4.0 Å.44 In the later experiment,45 〈Rg〉 increased from 2.72 to 3.2 Å during the initial 15 min of cooling and then stayed near 3.2 Å for the next 40 min. In both experiments, the average radius of gyration reached a maximum value of 4.24 Å, followed by a decrease to 4.02 Å. These variations in 〈Rg〉 are in good agreement with data presented in Fig. 8b. Our calculation predicts that, depending on the model used, in a saturated solution, the radius varies from 3.7 (B3LYP) to 4.8 Å (CNDO). The average radius of gyration increases with the increase in concentration of glycine at a fixed temperature or with increase in the supersaturation in the cooling processes. Simulations using the mB3LYP force field demonstrate that 〈Rg〉 increases from 3.8 Å to 4.5 Å (4.3 Å at T = 350 K) in the strong electric field (E = 104 V m−1).
It has been proposed,44,45 that the crystallization initiates at 〈Rg〉 = 4.24 Å. According to our calculations, this value corresponds to s = 4, but this does not indicate that the critical nucleus is very small or tetramers predominate in the solution. The distribution of Rg(s) is broad and asymmetric (Fig. S13 and S14†). At the percolation threshold, clusters of all sizes, including the infinite cluster, are simultaneously present in the system. At E = 0 V m−1 the largest clusters observed in our simulations contain 44 glycine molecules. According to a probabilistic approach in the frame of classical nucleation theory, nucleation is a stochastic process.46,47 The probability of the formation of large clusters decreases with increase in size as s−τ (Fig. 5). In the laboratory, crystals usually start to grow with a time lag of several hours after the supersaturated solution is prepared. If classical nucleation theory is applicable to the description of crystallization from glycine aqueous solutions, we could expect that a critical nucleus would contain hundreds of glycine molecules.
Residence lifetimes
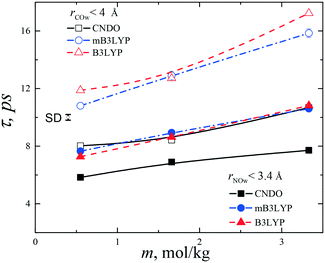
To describe the collective molecular movement in the aqueous solutions, the distribution of the residence lifetimes of water molecules from the first hydration shells of the hydrophilic –NH3 and –COO groups was calculated. The boundaries of the shells were selected according to positions of the first minima of the RDFs as shown in Fig. S15.† The hydration numbers strongly depend on the threshold interatomic distances. At m = 3.33 mol kg−1, the first hydration shell of the NH3 group (rNOw < 3.4 Å) contains an average 4.0 (mB3LYP, B3LYP) or 3.1 (CNDO) water molecules, which are close to the experimental value of 3.0 ± 0.6.39 The hydration shell of the –COO group (rCOw < 4.0 Å) contains 7.2 (mB3LYP, B3LYP) and 5.2 (CNDO) molecules. Some molecules, belonging to the hydration shell of the hydrophobic –CH2 group, occur in the hydration shell of the –COO group. During the residence lifetime, the glycine and water molecules are moving together and the water molecules belong to the first hydration shell of the glycine molecule. Due to diffusion and a molecular exchange between hydration shells, the water molecules leave early or late from the first shell.A hydrogen bond criterion typically has two adjustable parameters, namely, the interatomic distance and the hydrogen bond angle. The residence lifetimes of the water-glycine aggregates differ from the lifetimes of hydrogen bonds, which take place on a timescale of several picoseconds20,38 because the threshold distances are larger than values usually used as hydrogen bond criteria and the mutual orientation of the molecules are not taken into consideration.
To calculate the residence lifetimes, we analysed snapshots of the systems stored with a step of 10 ps. A list of water molecules, within the cut-off distance (rNow < 3.4 Å or rCOw < 4.0 Å) from each –NH3 or –COO group of any glycine molecule, was composed at each time step tl. Then, the lifetime was calculated according to the equation: t = te − ts, where te is the time when the water molecule leaves the first hydration shell and ts is the time of appearance of the molecule in the shell.
The distributions of the fractions F of water molecules versus the lifetime are shown in Fig. S16.† To fit the calculated data, the model of exponential decay was applied according to the equation:
 | (4) |
Other behaviours of residence lifetimes were observed for glycine molecules in clusters formed at high concentrations. These lifetimes characterize the stability of the clusters and they differ from the glycine–glycine hydrogen bond lifetime. The hydrogen bond formation and breaking processes have been studied recently.38 In the cited study, the exponential decay model was not applied to fit the hydrogen bond correlation function.
To calculate the glycine–glycine residence lifetimes, the cut-off distance between the nitrogen atoms was selected to be 6 Å. Various structures of the glycine dimers were found in the aqueous solutions and crystalline polymorphs. A statistical analysis of the distributions, F(t), (Fig. S17†) show that two terms (n = 2) in eqn (4) should be used to approximate the calculated data. This indicates that the short- and long-living pairs of the glycine molecules were formed in the solutions. At the highest concentration, the systems contain 72 glycine molecules in the simulation boxes and the monomers were not taken into consideration when residence lifetimes were calculated. It is difficult to estimate the number of long-living pairs due to poor statistics of events (Fig. S17c†). Nevertheless, the mean lifetimes were calculated as 14.3 and 112.4 ps; 12.3 and 96.8 ps; 13.1 and 108.3 ps for the B3LYP, mB3LYP and CNDO models, respectively. For the mB3LYP model at 350 K and E = 104 V m−1 the residence times increase to 13.2 and 109.1 ps. The short-living glycine pairs of the molecules have mean lifetimes close to the lifetimes of water molecules near the hydrophilic fragments of the glycine molecules. However, we observed pairs of glycine molecules, which moved together in the solution for longer than 1 ns. Restructuring of the glycine clusters was observed during visualization of the molecular configurations, but some ‘skeleton’ fragments exist after a long time, providing stability to the clusters. Our results support the previously proposed mechanism of crystallization.25 The crystallization of glycine could proceed through the formation of pre-nucleation clusters. These are thermodynamically stable solutes and there is no boundary between the clusters and the surrounding solution. They participate in the process of phase separation. The clusters can subsequently aggregate, leading to liquid–liquid separation. Nucleation of the crystalline phase then occurs within the dense hydrated amorphous phase.
Conclusions
The properties of simulated systems depend on intermolecular electrostatic interactions. To reduce the influence of this factor on the results, three charge sets (B3LYP, mB3LYP and CNDO) coupled with the AMBER force field were selected and simulations of aqueous solutions were performed. All models predicted the density and diffusivity in agreement with data available in the literature. The properties of glycine clusters were studied. Despite small quantitative differences, they were the same in all these models.Clustering rapidly increased with the increase in concentration of the solutions. In a concentrated aqueous solution, only a third of the glycine molecules were in a monomeric state. Percolated clusters are not observed even in a saturated solution, but an electric field facilitates cluster formation. Percolated chain-like and stripe-like glycine clusters are observed in the saturated aqueous solutions when a strong electric field was applied. This result supports the hypothesis for the orientational ordering of glycine clusters in the presence of a charged surfactant monolayer or an intense nanosecond near-infrared laser pulses with linear polarization of the laser beam (NPLIN phenomenon). Thus, an electric field can be used to control the nucleation and crystallization in saturated and supersaturated aqueous solutions of glycine. The orientational ordering inherent to the γ-polymorph appeared in a concentrated solution when a strong electric field was present. As a result, γ-glycine can be synthesised instead of the α-polymorph.
The calculated average radii of gyration for the finite clusters are in agreement with the results of the SAXS experiments. The estimated fractal dimension of the clusters is about 2. There is no phase boundary in the solutions. The mean residence lifetime of the water molecules from the hydration shells of the –NH3 and –COO groups is of the order of 10 ps; in addition, short- and long-living glycine pairs were observed and some pairs moved together in the liquid for more than 1 ns. The presence of two mean lifetimes of glycine molecules demonstrates the lability and stability of the clusters. The clusters are highly dynamic objects that are in equilibrium with their monomers. The diffusivity of glycine in the solutions weakly decreases with increase in concentration and it is only two times smaller than the diffusivity of water. Changes in the shape and size of the clusters occur over hundreds of picoseconds. Thus, our simulations show that the glycine clusters are strongly hydrated solutes with a liquid-like character.
Conflicts of interest
There are no conflicts to declare.Acknowledgements
This work was performed at the Institute of Chemistry of Macro Heterocyclic Compounds at Ivanovo State University of Chemistry and Technology. This work was supported by the Russian Science Foundation under project number 14 – 23 – 00204 – C. The research is carried out using the equipment of the shared research facilities of HPC computing resources at Lomonosov Moscow State University [project number 1756]. DL_FIELD is a program package written by C. W. Yong and was obtained from STFC's Daresbury Laboratory via the website.Notes and references
- K. Srinivasan, K. Renuka Devi and S. Anbuchudar Azhagan, Cryst. Res. Technol., 2011, 46, 159–165 CrossRef CAS.
- R. A. Kumar, R. E. Vizhi, N. Vijayan and D. R. Babu, Phys. B, 2011, 406, 2594–2600 CrossRef.
- G. L. Perlovich, L. K. Hansen and A. Bauer-Brandl, J. Therm. Anal. Calorim., 2001, 66, 699–715 CrossRef CAS.
- E. V. Boldyreva, V. A. Drebushchak, T. N. Drebushchak, I. E. Paukov, Y. A. Kovalevskaya and E. S. Shutova, J. Therm. Anal. Calorim., 2003, 73, 409–418 CrossRef CAS.
- E. V. Boldyreva, V. A. Drebushchak, T. N. Drebushchak, I. E. Paukov, Y. A. Kovalevskaya and E. S. Shutova, J. Therm. Anal. Calorim., 2003, 73, 419–428 CrossRef CAS.
- L. J. Little, R. P. Sear and J. L. Keddie, Cryst. Growth Des., 2015, 15, 5345–5354 CAS.
- I. Weissbuch, V. Y. Torbeev, L. Leiserowitz and M. Lahav, Angew. Chem., Int. Ed., 2005, 44, 3226–3229 CrossRef CAS PubMed.
- Z. Liu, L. Zhong, P. Ying, Z. Feng and C. Li, Biophys. Chem., 2008, 132, 18–22 CrossRef CAS PubMed.
- B. A. Garetz, J. Matic and A. S. Myerson, Phys. Rev. Lett., 2002, 89, 175501 CrossRef PubMed.
- X. Sun, B. A. Garetz and A. S. Myerson, Cryst. Growth Des., 2006, 6, 684–689 CAS.
- J. E. Aber, S. Arnold, B. A. Garetz and A. S. Myerson, Phys. Rev. Lett., 2005, 94, 1–4 CrossRef PubMed.
- K. Chadwick, R. J. Davey, R. Mughal and I. Marziano, Org. Process Res. Dev., 2009, 13, 1284–1290 CrossRef CAS.
- K. Allen, R. J. Davey, E. Ferrari, C. Towler, G. J. Tiddy, M. O. Jones and R. G. Pritchard, Cryst. Growth Des., 2002, 2, 523–527 CAS.
- N. Takenaka, Y. Kitamura, Y. Koyano and M. Nagaoka, J. Chem. Phys., 2012, 137, 24501 CrossRef PubMed.
- S. Gnanasambandam, Z. Hu, J. Jiang and R. Rajagopalan, J. Phys. Chem. B, 2009, 113, 752–758 CrossRef CAS PubMed.
- A. White and S. Jiang, J. Phys. Chem. B, 2011, 115, 660–667 CrossRef CAS PubMed.
- C. T. Andrews and A. H. Elcock, J. Chem. Theory Comput., 2013, 9, 4585–4602 CrossRef CAS PubMed.
- K. Leung and S. B. Rempe, J. Chem. Phys., 2005, 122, 184506 CrossRef PubMed.
- M. J. Schnieders, J. Baltrusaitis, Y. Shi, G. Chattree, L. Zheng, W. Yang and P. Ren, J. Chem. Theory Comput., 2012, 8, 1721–1736 CrossRef CAS PubMed.
- Y. Yani, P. S. Chow and R. B. H. Tan, Cryst. Growth Des., 2012, 12, 4771–4778 CAS.
- D. W. Cheong and Y. D. Boon, Cryst. Growth Des., 2010, 10, 5146–5158 CAS.
- W. D. Cornell, P. Cieplak, C. I. Bayly, I. R. Gould, K. M. Merz, D. M. Ferguson, D. C. Spellmeyer, T. Fox, J. W. Caldwell and P. A. Kollman, J. Am. Chem. Soc., 1995, 117, 5179–5197 CrossRef CAS.
- M. P. Kolesnikov, N. I. Voronova and I. A. Egorov, Origins Life, 1981, 11, 223–231 CrossRef CAS.
- J. Sun, D. Bousquet, H. Forbert and D. Marx, J. Chem. Phys., 2010, 133, 114508 CrossRef PubMed.
- D. Gebauer, M. Kellermeier, J. D. Gale, L. Bergström and H. Cölfen, Chem. Soc. Rev., 2014, 43, 2348–2371 RSC.
- W. Smith and T. R. Forester, J. Mol. Graphics, 1996, 14, 136–141 CrossRef CAS PubMed.
- S. L. Price, S. Hamad, A. Torrisi, P. G. Karamertzanis, M. Leslie and C. R. A. Catlow, Mol. Simul., 2006, 32, 985–997 CrossRef CAS.
- S. Melchionna, G. Ciccotti and B. L. Holian, Mol. Phys., 1993, 78, 533–544 CrossRef CAS.
- P. Raiteri and J. D. Gale, J. Am. Chem. Soc., 2010, 132, 17623–17634 CrossRef CAS PubMed.
- A. Bouchard, G. W. Hofland and G. J. Witkamp, J. Chem. Eng. Data, 2007, 52, 1626–1629 CrossRef CAS.
- T. Edvinsson, P. J. Råsmark and C. Elvingson, Mol. Simul., 1999, 23, 169–190 CrossRef CAS.
- Y. Wu, H. L. Tepper and G. A. Voth, J. Chem. Phys., 2006, 124, 24503 CrossRef PubMed.
- J. L. Derissen, P. H. Smit and J. Voogd, J. Phys. Chem., 1977, 81, 1474–1476 CrossRef CAS.
- J. Voogd, J. L. Derissen and F. B. Van Duijneveldtt, J. Am. Chem. Soc., 1981, 103, 7701–7706 CrossRef CAS.
- T. S. Banipal, D. Kaur and P. K. Banipal, J. Chem. Eng. Data, 2004, 49, 1236–1246 CrossRef CAS.
- J. Huang, T. C. Stringfellow and L. Yu, J. Am. Chem. Soc., 2008, 130, 13973–13980 CrossRef CAS PubMed.
- W. S. Price, H. Ide and Y. Arata, J. Phys. Chem. A, 1999, 103, 448–450 CrossRef CAS.
- S. Hamad, C. E. Hughes, C. R. A. Catlow and K. D. M. Harris, J. Phys. Chem. B, 2008, 112, 7280–7288 CrossRef CAS PubMed.
- Y. Kameda, H. Ebata, T. Usuki, O. Uemura and M. Misawa, Bull. Chem. Soc. Jpn., 1994, 67, 3159–3164 CrossRef CAS.
- M. G. Campo, J. Chem. Phys., 2006, 125, 114511 CrossRef PubMed.
- C. E. Hughes, S. Hamad, K. D. M. Harris, C. R. A. Catlow and P. C. Griffiths, Faraday Discuss., 2007, 136, 71–89 RSC.
- M. Isichenko, Rev. Mod. Phys., 1992, 64, 961–1043 CrossRef.
- D. Tiggemann, Int. J. Mod. Phys. C, 2006, 17, 1141–1150 CrossRef.
- S. Chattopadhyay, D. Erdemir, J. M. B. Evans, J. Ilavsky, H. Amenitsch, C. U. Segre and A. S. Myerson, Cryst. Growth Des., 2005, 5, 523–527 CAS.
- D. Erdemir, S. Chattopadhyay, L. Guo, J. Ilavsky, H. Amenitsch, C. U. Segre and A. S. Myerson, Phys. Rev. Lett., 2007, 99, 115702–115704 CrossRef PubMed.
- Y. G. Bushuev and L. S. Bartell, J. Phys. Chem. B, 2007, 111, 1712–1720 CrossRef CAS PubMed.
- I. L. Dimitrov, F. V. Hodzhaoglu and D. P. Koleva, J. Biol. Phys., 2015, 41, 327–338 CrossRef CAS PubMed.
Footnote |
| † Electronic supplementary information (ESI) available: Supporting figures, tables, snapshots of molecular configurations and DL_POLY files. See DOI: 10.1039/c7ce01271c |
| This journal is © The Royal Society of Chemistry 2017 |

