 Open Access Article
Crystallisation of a salt hydrate with a complex solid form landscape†
Eszter
Tieger
 *ab,
Violetta
Kiss
c,
György
Pokol
a and
Zoltán
Finta
d
aDepartment of Inorganic and Analytical Chemistry, Budapest University of Technology and Economics, Szt. Gellért tér 4, 1111 Budapest, Hungary. E-mail: tiegereszter@gmail.com
bZentiva – a Sanofi company, U Kabelovny 130, 102 37, Prague, Czech Republic
cJanssen Pharmaceuticals, Inc. – Pharmaceutical Companies of Johnson & Johnson, Turnhoutseweg 30, B-2340 Beerse, Belgium
dChinoin Zrt., Tó utca 1-5, 1045 Budapest, Hungary
First published on 17th March 2017
Abstract
Different approaches were utilized to assess the thermodynamic stability relationship between four distinct hemihydrates of sitagliptin L-tartrate (SLT). These phases are true polymorphs, having the same chemical composition and molar ratio of water, but different arrangement in the crystal lattice. The general approaches (Burger and Ramberger rules) have only limited applicability, but indicated a monotropic relationship between Phase 1 and Phase 2. The crystallisation and transformation behaviour of the polymorphs was strongly influenced by the solvent composition. As the stability thereof was found to be solvent-dependent, the application of the van't Hoff plot or the solvent-mediated transformation did not unambiguously reveal the relative stability of the forms. Experiments were carried out in an endeavour to determine the most suitable concentration trajectory for cooling crystallisation of the selected candidate and prevent concomitant crystallisation. The application of in situ monitoring techniques, such as FTIR-ATR and FBRM, offered great potential for process optimization and control.
Introduction
Crystallisation of active pharmaceutical ingredients, particularly those that possess multiple polymorphic forms, is among the most critical pharmaceutical manufacturing processes. Controlling polymorphism is a major issue both for research and for industry, presenting substantial scientific and economic challenges. Metastable states are frequently encountered in pharmaceutical systems, in the crystallisation of desired solid-state modifications.1Not only does crystallisation affect the efficiency of downstream operations such as filtering, drying, and formulation, but also the efficacy of the drug can be dependent on the final crystal form. To ensure consistent production of the desired polymorph, better control over the crystallisation process is required. Strategies for obtaining the desired forms include seeding, choice of solvents, and crystal engineering.2
The key step towards a robust crystallisation process is a detailed solid-state characterization and polymorphic investigation which provides an overview of the phase transformations, including the identification of the most stable form at a given temperature. For solvates and hydrates, both thermodynamic parameters and solvent activity must be examined.3 Hydrate formation is of great importance in the pharmaceutical industry as, owing to the ubiquity of water vapour, hydrates are often the stable form under ambient conditions. The determination of possible transformation pathways between different forms is a crucial part in the development of a drug product.4
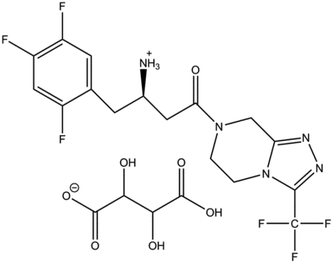
Sitagliptin (7-[(3R)-3-amino-1-oxo-4-(2,4,5-trifluorophenyl)butyl]-5,6,7,8-tetrahydro-3-(trifluoromethyl)-1,2,4-triazolo[4,3-a]pyrazine) is an oral antihyperglycemic of the dipeptidyl peptidase-4 (DPP-4) inhibitor class. It is one of the most popular type 2 diabetes drugs on the market. The original product is marketed by Merck & Co under the trade name Januvia® as sitagliptin phosphate monohydrate. In this paper, L-tartaric acid was used as a salt-forming agent and the obtained hydrogen tartrate salt (Fig. 1) was studied.
To date, four polymorphs of SLT hemihydrate as well as one tetrahydrate have been identified,5 but no anhydrous form or solvate has been discovered. The hemihydrate forms possess the same stoichiometry (water content) and as polymorphism denotes systems with the same chemical composition,6,7 these forms are considered true polymorphs.
SLT hemihydrates Phase 1,8 Phase 29 and Phase 310 are claimed by Zentiva, while the fourth modification is described in a patent application filed by Merck,11 referred to as a hemihydrate, therefore this phase is labeled Phase M. Phase 1 and Phase 2 – and probably Phase M as well – are packing polymorphs,5 and their IR spectra are very similar, while Phase 3 is easily distinguishable (see the ESI†). As the forms are closely related, concomitant crystallisation was frequently observed.
In an attempt to reveal the relative thermodynamic relationship of SLT polymorphs, it was interesting to examine whether the general approaches to determine the existence of monotropism or enantiotropism could be applied in a polymorphic hydrate system. Another challenge arose when we observed that the solvent composition is one of the major factors in determining the crystal structure.
After selecting the lead candidate, a direct design approach was used to determine and control the design space of the crystallisation process. This approach uses a feedback control system to monitor a solution concentration trajectory as a function of temperature.12 The introduction of advanced in situ monitoring techniques such as FBRM® (Focused Beam Reflectance Measurement) and ATR-FTIR (Attenuated Total Reflection-Fourier Transform Infrared spectroscopy) provided the ability to monitor and control the crystallisation processes in real time.
Materials and methods
Sitagliptin free base (>99% pure) was commercially available (Zhejiang Jiuzhou Pharmaceutical Co, China). L-Tartaric acid (Alfa Aesar, 99% pure, U.K.) was used for the salt formation and distilled water, 2-propanol, ethanol, methanol, acetone and acetonitrile (penta Chemicals, Prague, Czech Republic) were applied in the preparation.Phase 1 was obtained when SLT was crystallised from a 2-propanol![[thin space (1/6-em)]](https://www.rsc.org/images/entities/char_2009.gif) :
:![[thin space (1/6-em)]](https://www.rsc.org/images/entities/char_2009.gif) water (8
water (8![[thin space (1/6-em)]](https://www.rsc.org/images/entities/char_2009.gif) :
:![[thin space (1/6-em)]](https://www.rsc.org/images/entities/char_2009.gif) 2 V/V) mixture. Crystallisation of SLT from a methanol
2 V/V) mixture. Crystallisation of SLT from a methanol![[thin space (1/6-em)]](https://www.rsc.org/images/entities/char_2009.gif) :
:![[thin space (1/6-em)]](https://www.rsc.org/images/entities/char_2009.gif) water (6
water (6![[thin space (1/6-em)]](https://www.rsc.org/images/entities/char_2009.gif) :
:![[thin space (1/6-em)]](https://www.rsc.org/images/entities/char_2009.gif) 4 V/V) mixture resulted in Phase 2 crystals. Crystallisation of SLT from an acetone
4 V/V) mixture resulted in Phase 2 crystals. Crystallisation of SLT from an acetone![[thin space (1/6-em)]](https://www.rsc.org/images/entities/char_2009.gif) :
:![[thin space (1/6-em)]](https://www.rsc.org/images/entities/char_2009.gif) water (9
water (9![[thin space (1/6-em)]](https://www.rsc.org/images/entities/char_2009.gif) :
:![[thin space (1/6-em)]](https://www.rsc.org/images/entities/char_2009.gif) 1 V/V) mixture leads to Phase 3. SLT Phase M was obtained from pure methanol.
1 V/V) mixture leads to Phase 3. SLT Phase M was obtained from pure methanol.
Intrinsic dissolution rate determination
Disks were prepared by compressing ∼10 mg of the drug in a die with a 100 kg load force for 120 s using a screw press (Sirius Analytical Instr. Ltd., Forest Row, UK). The exposed surface area of the resulting disk was 0.07 cm2. A USP dissolution set-up maintained at 22, 37 and 55 °C was used for the study. Dissolution measurements were performed using a Sirius inForm platform (Sirius Analytical Instr. Ltd., Forest Row, UK) with a built-in pH measurement and UV fibre optic spectroscopy system. Each dissolution vessel contained 60 mL of an aqueous dissolution medium maintained at a constant pH of 6.8 (0.2 M, phosphate buffer). The disk holder (die) was immersed into the dissolution medium and rotated at 100 rpm. The amount of dissolved API was determined from multi-wavelength UV absorption measured using an in situ dip probe. Spectra were recorded every 30 s. Samples were analysed in triplicate.Critical water activity
A series of acetone/water, acetonitrile/water, 2-propanol/water, ethanol/water and methanol/water binary mixtures of varying water content was prepared and saturated with the compound. A small amount of all the obtained forms was added to each mixture. The suspensions were shaken at room temperature (unless otherwise stated) for 2 or 4 weeks in a thermoshaker, then the solids were collected by filtration and characterized by XRPD and Raman spectroscopy. The water activity of the binary mixtures was calculated using an NRTL (non-random two-liquid) model of VLE (vapour liquid equilibrium) data.Kinetic solubility data
A Crystal16 crystallisation system (Avantium, NL) was used to determine the kinetic solubility curves on 1 mL scale in glass HPLC vials. Mixing was facilitated with magnetic stirring bars. The presence or absence of solids was identified using a turbidity sensor. To ensure that no solvent-mediated transformation occurred during the measurements, an additional sample was stirred under the same conditions, which was withdrawn during the heating ramp and analysed by XRPD.Crystallisation
Crystallisation experiments were performed using a METTLER TOLEDO EasyMax workstation (Mettler-Toledo, Greifensee, Switzerland) equipped with 100 mL vessels in conjunction with iControl software. The temperature control was achieved using a Huber cc231 chiller. Mixing was provided by a 4-blade impeller rotating at a speed of 350 rpm.4.2 g of sitagliptin L-tartrate was dissolved in 65 mL of a solvent mixture of 2-propanol and water with a volumetric ratio of 8![[thin space (1/6-em)]](https://www.rsc.org/images/entities/char_2009.gif) :
:![[thin space (1/6-em)]](https://www.rsc.org/images/entities/char_2009.gif) 2. The solution obtained was filtered through a paper filter into the reactor to get rid of the insoluble particles. The paper filter was rinsed with further 5 mL of the solvent mixture of 2-propanol and water with a volumetric ratio of 8
2. The solution obtained was filtered through a paper filter into the reactor to get rid of the insoluble particles. The paper filter was rinsed with further 5 mL of the solvent mixture of 2-propanol and water with a volumetric ratio of 8![[thin space (1/6-em)]](https://www.rsc.org/images/entities/char_2009.gif) :
:![[thin space (1/6-em)]](https://www.rsc.org/images/entities/char_2009.gif) 2.
2.
The clear solution was heated up to 75 °C within 30 minutes and kept at this temperature. The clear solution was cooled to 60/55 °C with a cooling rate of 18 °C h−1 and it was seeded with a 0.5–1% excess (with respect to the amount of SLT) of sitagliptin L-tartrate Phase 1. The suspension obtained was either held at this temperature for an hour or further cooled to 40 °C with a cooling rate of 18 °C h−1 and then left to stir at this temperature for an additional 60 minutes. The suspension was further cooled to 0 °C with a cooling rate of 10 °C h−1 and then stirred at 0 °C overnight. The product was filtered on a glass funnel (pore size: G4) by vacuum suction, washed with 5 mL of a solvent mixture of 2-propanol and water with a volumetric ratio of 8![[thin space (1/6-em)]](https://www.rsc.org/images/entities/char_2009.gif) :
:![[thin space (1/6-em)]](https://www.rsc.org/images/entities/char_2009.gif) 2 and dried in a vacuum oven at 40 °C and 200 mbar overnight.
2 and dried in a vacuum oven at 40 °C and 200 mbar overnight.
When sieved seeds were applied, the crystals were sieved through a 63 μm mesh width sieve, suspended in a solvent mixture of 2-propanol and water with a volumetric ratio of 8![[thin space (1/6-em)]](https://www.rsc.org/images/entities/char_2009.gif) :
:![[thin space (1/6-em)]](https://www.rsc.org/images/entities/char_2009.gif) 2 and continuously stirred for 24 hours. The suspension was introduced into the reactor using a syringe.
2 and continuously stirred for 24 hours. The suspension was introduced into the reactor using a syringe.
In situ characterization techniques
ATR-FTIR spectroscopy has been applied to monitor the liquid-phase concentration.Spectra were collected using a Thermo Scientific™ Nicolet™ iS™10 FT-IR spectrometer (Thermo Fisher Scientific Inc., Waltham, MA, USA), equipped with an immersion probe and a diamond ATR crystal. Spectra were collected in the 650–1800 cm−1 region and averaged over 128 scans. Omnic and TQ Analyst software programs (Thermo Fisher Scientific Inc., Waltham, MA, USA) were used to collect and analyse the data. The background scan was collected in air at room temperature.
The spectra for calibration were collected by keeping the concentration constant while the temperature was gradually increased which allowed collection of the spectra in undersaturated as well as supersaturated regions. The calibration model was constructed by using the classical least-squares (CLS) method using the spectral range of the peak at 1022 cm−1.
Measurements of CLDs were carried out using an FBRM probe (Mettler Toledo, Seattle, USA), a primary chord selection method, and analysis was conducted using iC FBRM Control 4.2 Interface software.
Results
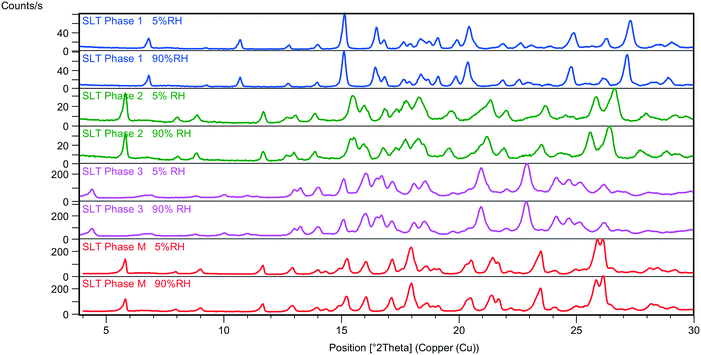
SLT Phase 1, Phase 2, Phase 3 and Phase M are crystalline solids with the same chemical composition, but different crystal structures, hence they are considered polymorphs. During the desorption in the humidity chamber, the structures of SLT Phase 1, Phase 2, Phase 3 and Phase M have not changed, and a so-called isomorphic dehydrate formed without significantly altering the crystal arrangement (Fig. 2). The structures of the parent hydrates are retained regardless of the RH-level, and only lattice expansion and contraction were observed in the cases of Phase 1 and Phase 2. Further details can be found in a previous work.5It is of practical importance to determine whether a system is monotropic or enantiotropic to enable the choice of and control over the desired form.13 Extensive efforts were made to evaluate the thermodynamic stability relationships using various approaches. It was worth investigating whether the Burger and Ramberger rules14 are applicable to hydrate polymorphs.
In the case of the SLT hemihydrates, revealing the relative thermodynamic relationship is challenging as the general approaches – originally used to evaluate neat forms – have limited applicability to determine the existence of enantiotropism or monotropism.
The heat of transition rule14 is not applicable as no endothermic/exothermic event is observed below the melting point (Fig. 3) except for dehydration. Neither the heat of fusion rule14 can be employed15 because melting is accompanied by concomitant decomposition.
According to the infrared rule,14 Phase 3, with a higher absorption band at 3473 cm−1 (Table 1) (see the spectra in the ESI†), is assumed to have larger entropy than the other polymorphs and therefore is less stable at 0 K. The other three forms have comparable values and Phase 1 seems to be the most stable one. Furthermore, SLT Phase 1 has the highest melting point and density (Table 1) suggesting that stronger intermolecular interactions take place in this structure.16,17 As stated by Bernstein,13 two modifications are monotropically related if the higher melting modification shows the higher density. Accordingly, Phase 1 and Phase 2 are monotropically related, while Phase 2 and Phase M are enantiotropically related. However, extensive efforts were made to confirm their relationship and the potential transition temperature, but no enantiotropic transformation was observed between −50 and 130 °C.
| Solid form | Phase 1 | Phase 2 | Phase 3 | Phase M |
|---|---|---|---|---|
| Melting point (of the isostructural dehydrates), Tpeak (°C) | 203.7 | 197.9 | 196.4 | 202.1 |
| Density (g cm−3) at 293 K | 1.549 | 1.544 | N/A | 1.543 |
| First IR absorption band (cm−1) | 3449.0 | 3451.2 | 3473.1 | 3449.3 |
The van't Hoff plot14 derived from the solubility data is not unambiguously applicable, as solvent-mediated transformation of the SLT forms generally results in rapid conversion (Fig. 4), precluding the proper measurement of the solubility of metastable forms. Moreover, depending on the solvent media, the order of solubility might differ (see the ESI†). Usually, the most stable form has the lowest solubility, thus obtained in a slurry experiment, but when the stability is solvent-dependent, it does not reveal the relative stability of the forms.18
In an ethanol–water (3–1 V/V) mixture, Phase 1 showed the lowest solubility (Fig. 4 and 5). Phase 2 showed significantly higher solubility, similar to Phase 3 and Phase M. But the latter ones started to transform into Phase 2 during the experiment, as confirmed by XRPD, thus their results are not reliable (marked with dashed lines). It was observed that in this medium, Phase 3 and Phase M convert to Phase 1 through Phase 2. The van't Hoff plot calculated using the kinetic solubility curves measured in the ethanol–water (3–1 V/V) mixture (Fig. 5) shows that the lines are almost parallel over the temperature range of interest indicating that Phase 1 and Phase 2 are monotropically related, as they only cross below absolute zero.
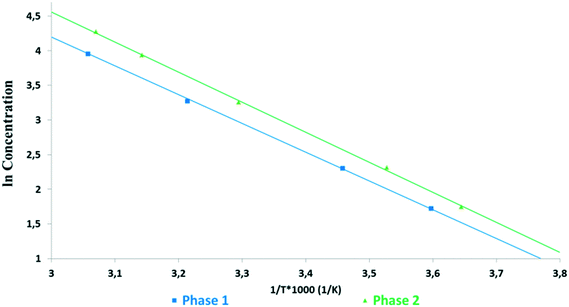 | ||
| Fig. 5 Van't Hoff plots of kinetic solubilities against the reciprocal of absolute temperature measured in an ethanol–water (3–1 V/V) mixture. | ||
As the solubility measurements were not suitable for elucidating the relative stability order due to the fast conversion of the metastable forms (see more data in the ESI†), the intrinsic dissolution rate of the SLT hemihydrate polymorphs was determined. The use of the intrinsic dissolution method assumes that the intrinsic dissolution rate (IDR) is proportional to the solubility, the proportionality constant being the transport rate constant, which is constant under the same hydrodynamic conditions in a transport-controlled dissolution process.19 Due to the close relationship between the intrinsic dissolution rate and solubility, measuring the IDR is an alternative method for solubility estimation when equilibrium solubility cannot easily be obtained experimentally.20
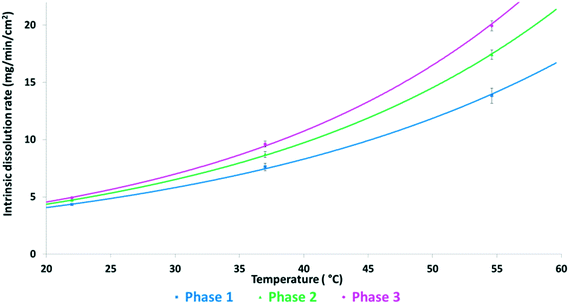
Fig. 6 shows the intrinsic dissolution rates of the SLT hemihydrate polymorphs in phosphate buffer, pH 6.8 measured at 22, 37, and 55 °C. The solubility order is inversely proportional to the order of melting points and is in accordance with the IR rule, as Phase 3 has the highest, while Phase 1 has the lowest dissolution rate. Unfortunately, the values for Phase M could not be recorded due to rapid conversion to Phase 2 in the applied medium. Fig. 7 depicts the van't Hoff plots calculated using the intrinsic dissolution rates of the forms. A transition temperature of 7 °C was defined by extrapolating the lines to the point of intersection. Based on Fig. 7, SLT Phase 1, Phase 2 and Phase 3 are enantiotropically related. The graph indicates that Phase 1 is the most stable form above the transition temperature, whereas Phase 3 is the most stable one below the transition temperature.
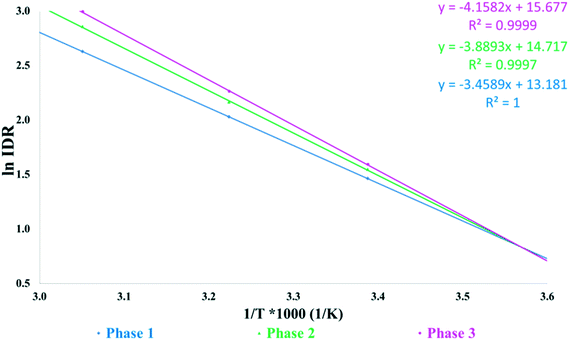 | ||
| Fig. 7 Van't Hoff plots of intrinsic dissolution rates against the reciprocal of absolute temperature measured at pH 6.8. | ||
The contradictory results (Fig. 5 and 7) indicated that further investigation of the solid form stability in various organic solvent–water mixtures and as a function of pH should be conducted. As the stability of the SLT polymorphs was found to be solvent-dependent, the application of the van't Hoff plot is deemed nonviable.
The relative physical stability can be unambiguously established in most cases through solvent-mediated solid phase transformation (competitive slurry conversion experiments) containing mixtures of crystalline forms in various solvent systems.21 A range of solvents, with a variety of different properties such as hydrogen bonding and dielectric constant, were employed. The water activity value is consistent from solvent to solvent but represents different amounts of water in different solvent mixtures.
Slurry experiments investigating the stability of the forms in different organic solvent–water mixtures demonstrated that the solvent composition is one of the major factors in determining the crystal structure. Solvent-mediated transformation in ethanol–water mixtures (Fig. 8), acetonitrile–water mixtures (Fig. 9) and dissolution media with various pH values (Fig. 13) resulted in Phase 1. In acetone–water mixtures (Fig. 10), Phase 3 dominates at higher acetone contents, while Phase 1 prevails at high RH values. The phase map recorded in methanol–water mixtures (Fig. 11) revealed that three different forms are attainable in this medium, by tuning the solvent composition. The solute–solvent interaction in pure methanol accelerates the nucleation and growth rate of Phase M, while in methanol–water mixtures at moderate water activity levels Phase 2 is the preferred form, and Phase 1 is favoured at elevated water activity values. On the other hand, in 2-propanol–water mixtures (Fig. 12), Phase 1 dominates, and the admixture of Phase 2 was only observed as a consequence of inadequate solubility. The presence of mixtures does not necessarily reflect equilibrium between the phases. In pure 2-propanol, both the absolute solubility (<0.5 mg mL−1 at room temperature, see the ESI†) and the solubility difference between the forms are very poor, thus the transformation rate is expected to be slow. The solubility difference between the solid phases present in the mixtures is small and therefore the driving force of solvent-mediated transformation is limited. Thus, at lower temperatures the conversion was not complete, but at 50 °C the system could reach equilibrium, resulting in pure Phase 1.
A possible reason for the limited difference in solubility may be the small difference in the free energy of Phase 1 and Phase 2, which results only from the packing differences. The transformation rate is determined by a balance of solubility and strength of the solvent–solute interactions, mainly the hydrogen bonding interactions. Both the temperature and degree of agitation influence the transformation rate.22
It was found that in the ethanol–water (3–1 V/V) mixture (Fig. 4 and 8) and in the 2-propanol–water (8–2 V/V) mixture (Fig. 12 and 14), Phase 3 and Phase M convert to Phase 1 through Phase 2. From these results, we can gain information about their stability order, assuming that their transformation follows the Ostwald rule of stages.23
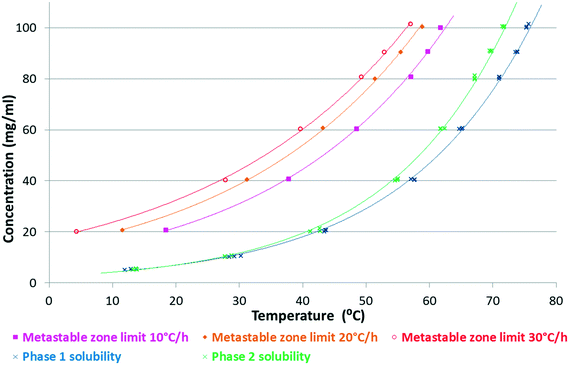 | ||
| Fig. 14 Kinetic solubility curves of SLT Phases 1 and 2 in a 2-propanol–water (8–2 V/V) mixture and the metastable zone limits at different cooling rates. | ||
In principle, the solubility ratio of the polymorphs is independent of the nature of the solvents, provided that Henry's law is obeyed, unless solvate formation occurs.13,20,24,25 In contrast, we experienced that the solid form of SLT is dependent on the solvent composition. The solubility ratio, even the rank order, changes in solvents having different properties.
A reasonable explanation is that the solvent changes the solute–solvent interaction, the solubility of the solute and the interfacial energy on the crystal surface. Therefore, the solvent frequently changes the relative nucleation rate, the relative growth rate and the transformation rate of polymorphs. Solvent–solute molecular interactions, such as hydrogen bonding, can encourage the formation of certain inter- or intramolecular assemblies and can explain the appearance of a specific form in a given solvent.13,26–31
This behaviour is not uncommon in the pharmaceutical industry. Kitamura et al. observed32 a similar behaviour of BPT, that in specific solvents or by altering the composition of methanol–water mixtures, different forms were obtained. Hao et al. experienced33 that the polymorph of prasugrel hydrochloride directly depended on the solvent used. Davey et al. investigated34 the solvent effect on molecular self-assembly during nucleation of 2,6-dihydroxybenzoic acid and found that solution crystallisation in toluene favoured the formation of form 1, while crystallisation in chloroform favoured the formation of form 2. The hydrogen bond donor propensity of the solvents used was found to be the key parameter in the crystallisation of the desired polymorph of ASP3026.35
The effect of solvents is similar to the effect of additives/impurities as they selectively adsorb on particular faces, retarding the growth in a certain direction.25 The growth synthon hypothesis36,37 provides some evidence that molecular assembly in the liquid phase can mirror the packing of certain polymorphs in a system. The nature of the solvent–solute interactions can play a significant role in determining the viability of these clusters and hence direct the structural outcome of the crystallisation. The ability of the solvent to strongly bind the solute molecules can prevent the geometric requirements necessary for the stable form to nucleate.30 The stronger solvent–solute interactions may then stabilize those growth units and retard the crystallisation of the most stable form.22
It is important to emphasize that the solvent does not change the relative thermodynamic stability of the polymorphs. These observations are the result of kinetic and/or molecular recognition effects on crystallisation processes. The kinetics for a solvent-mediated phase transformation is governed by the kinetics of dissolution, nucleation, and crystal growth. These rates will directly depend on the solvent and any step may be rate-limiting.38 Also, since SLT hemihydrates are considered true polymorphs, possessing identical water content, it is not the water activity which directs the crystallisation, but the solvent media, through specific solute–solvent interactions.
The results indicate that it is possible to preferentially crystallise the selected form(s) simply by tuning the solvent system and composition. With the knowledge of the phase diagrams, it is possible to predict the solid phase that would be produced under equilibrium conditions.
Crystallisation
Phase 1 was selected as a lead candidate, because this form possesses the highest density and melting point and has the lowest solubility in the majority of the solvents including the dissolution media.The 2-propanol–water (8–2 V/V) mixture was selected for the crystallisation of Phase 1. In this medium, the metastable zones of Phase 1 and Phase 2 overlap (Fig. 14), therefore concomitant crystallisation was frequently observed. The conformation of Phase 1 and Phase 2 is identical,5 which corresponds to the small difference in the chemical potential between the polymorphs resulting in similar solubility profiles.39
According to Fig. 14, the most favourable, seeded, cooling crystallisation is feasible as the slope of the solubility curve allows the application of this method. Many parameters must be taken into consideration when designing a seeding strategy such as seed size, seed loading (mass) and seeding temperature (supersaturation level). These parameters are generally optimized based on process kinetics and the desired final particle properties. In this case, seed crystals with the correct particle size, mass and crystal form were required at the right point in the process in order to change the previously poorly behaving, inconsistent crystallisation process to one that is repeatable and produces the desired polymorph satisfying the required particle size specification.
But while the solubility curve is thermodynamically fixed for a given solvent–solute system, the Metastable Zone Width (MSZW) is a kinetic boundary and can change depending on process parameters such as the cooling rate, agitation or scale (Fig. 14).40 The fast cool down (30 °C h−1) produces the largest metastable zone and the highest supersaturation at the time of nucleation, while the slow cool down (10 °C h−1) produces a narrower metastable zone. This is an effect which must be taken into account when designing the seeding temperature.
The application of seeding to control the polymorphic form requires that the secondary nucleation of the desired polymorph occurs with a considerable speed at lower supersaturation than which is needed for spontaneous nucleation of the undesired polymorphs. Consequently, the supersaturation is consumed by the nucleation and growth of the seeded polymorph.41
Experiments were carried out in an endeavour to determine the most suitable concentration trajectory for cooling crystallisation of Phase 1. The experiments were monitored using ATR-FTIR and FBRM probes. Due to the low depth of the IR beam which is about in the order of 1–2 μm,42 the ATR probe could be applied to acquire the spectra of the liquid phase even in the presence of the solid phase.
Temperature variations influence the baseline of the measured infrared signal, hence a baseline correction was applied to compensate for the temperature effect. A univariate peak area calibration is in principle able to quantify liquid composition even for nonisothermal processes.43 In order to obtain a calibration model that is applicable over a wide range of process conditions, an extensive calibration set was designed including samples in under- as well as supersaturated regions (see the ESI†). According to our investigations, the signal intensity of the selected band is mainly influenced by the concentration of SLT, and is almost insensitive to temperature. Therefore, we could build a calibration model without additional temperature correction by applying the Lambert–Beer law.44
Since concomitant polymorphism was frequently encountered, additional care was taken in choosing the correct seeding protocol. Firstly, 0.5% seeds were applied at 60 °C to induce crystallisation (Fig. 15, red curve). The relative supersaturation45 of Phase 1,  , where C is the actual concentration of SLT and C* is the solubility of SLT at the seeding point, at this stage is 28%. As shown in Fig. 15, the relatively small amount of seeds (0.5% w/w with respect to the amount of SLT) is not sufficient to induce crystallisation and upon further cooling the concentration remains constant until the metastable boundary is reached. It is followed by a sudden decrease in the concentration as a result of spontaneous nucleation and concomitant crystallisation of Phase 1 and Phase 2 is observed. When spontaneous nucleation occurs, as the Ostwald rule of stages dictates, the metastable Phase 2 nucleates prior to the stable phase, meaning that the kinetic factors prevail over the thermodynamic factors. The results from the in situ techniques, FBRM and FTIR, were consistent with each other. Monitoring the CLD trends, we could see that the seeding crystals did not dissolve, but could not induce secondary nucleation and uncontrolled nucleation occurred when the temperature has reached the metastable boundary (see the ESI†).
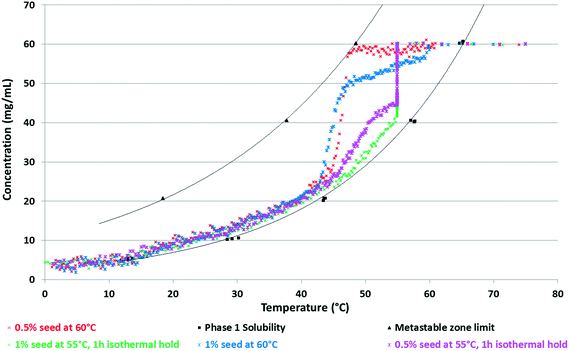 | ||
| Fig. 15 Solubility curve and metastable zone limit for SLT Phase 1 in 2–propanol-water 8–2 V/V mixture with overlaid concentration profiles. | ||
It was found that at this level of supersaturation (σ = 28%), a seed amount of 1% is around the critical value, which was sufficient to induce crystallisation (Fig. 15, blue curve) and the concentration profile did not reach the metastable zone limit. On the other hand, when 0.5% seeds are added at 55 °C, where the relative supersaturation of Phase 1 is 62.5%, the higher supersaturation and the application of a one hour isothermal hold after seeding resulted in excessive secondary nucleation (Fig. 15, pink curve). At the start of crystallisation, the surface area of crystals present in the slurry is low – meaning that nucleation can dominate over growth. The liquid concentration decreases rapidly during the isothermal hold and gradually approaches the solubility curve upon further cooling. Lower solution concentration (higher extent of nucleation) has been reached at the end of the isothermal hold when a higher seed amount of 1 w/w% was applied (Fig. 14, green curve). In this case, the concentration profile closely followed the solubility curve from the beginning of the cooling ramp, while in the case of 0.5 w/w% seeds, cooling started at a higher supersaturation value.
It is a good practice to implement an isothermal hold period after seed addition. The function of this hold period is to provide the seed with an appropriate time to properly disperse and to consume the initial solution supersaturation. With decreasing product concentration, the danger of spontaneous nucleation usually diminishes.40
There is a requirement to target a pre-defined particle size that if not met can result in additional processing costs. All SLT forms show a needle-shaped crystal habit (see the ESI†) which requires caution when interpreting the chord length distribution (CLD) measured using the FBRM probe. The CLD is the result of a convolution between the Particle Size Distribution (PSD) and the particular shape of the particles. Square-weighted CLD distribution will therefore place an emphasis on large chord length characteristics, while non-weighted values will place a similar emphasis on small chord length characteristics. In this case, the non-weighted median chord length can be associated with needle width, as the circulating laser beam predominantly passes along this dimension.46–49
Aiming to achieve the targeted PSD, sieved seeding crystals were applied. When these needle-like particles were subjected to mechanical fracture (sieving), the particles preferentially broke up along their shortest dimension. Hence, the dry application of these fractured particles led to dendritic growth and agglomeration and the resulting particle size did not meet the requirements (see details in the ESI†). The shape of the square-weighted mean CLD was used as an indicator of agglomeration, as it emphasizes the coarse end of the distribution (see the ESI†). Therefore, aging of the seeds50,51 was employed: the seeding crystals were suspended in the applied solvent media and Ostwald ripening occurred. This kind of wet seed handling facilitates the introduction to the crystalliser and results in more effective dispersion in the reactor. Seed addition followed by an isothermal hold period led to extensive nucleation which greatly consumed supersaturation in the solution (Fig. 15 and 16). At the highest supersaturation (σ = 62.5%) achieved at 55 °C, nucleation is favoured over growth and during the isothermal hold the steeply increasing chord counts became nearly constant implying that the population counts reach equilibrium. With increasing supersaturation, the time required to reach the steady state was considerably shorter. This type of rapid concentration drop is advantageous, as with decreasing product concentration the risk of concomitant crystallisation of the competing polymorph is mitigated; furthermore, it facilitates achievement of the targeted small particle size.
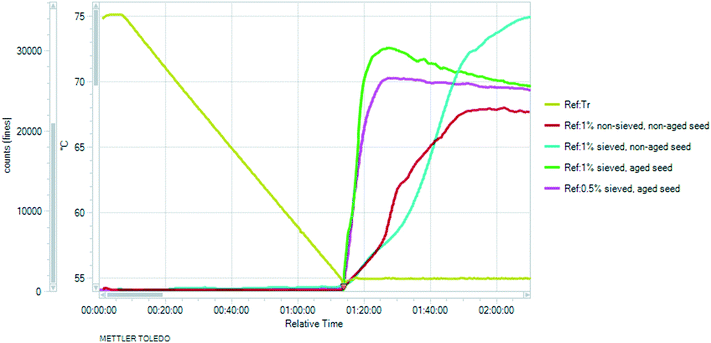
Investigating the effect of the seeding quantity and quality, the solution was cooled to 55 °C and seeded with 0.5–1 w/w% seeds. Both dry and wet seed handling and sieved and non-sieved seeding crystals were tested. The non-weighted chord length distribution <10 μm is proportional to the nucleation rate and therefore can be used as an indicator of the nucleation kinetics.40,52,53
When non-sieved, dry seeds were applied (Fig. 16, red curve), the maximum number of small chord lengths was lower and the slope was more inclined, indicating a lower nucleation rate. Dry seeding is expected to consist of agglomerated crystals.49 The nucleation rate increased with the application of sieved (fractured) seeds having higher specific surface area. Moreover, by applying sieved seeds, it is easier to ensure that the PSD of the seeding crystals is consistent, which subsequently leads to more consistent product crystals.54 The application of sieved, non-maturated seeds resulted in the highest increase in the measured counts (Fig. 16, blue curve), as they contain a larger amount of particles, including the smallest crystals which are not present in the aged seeds due to Ostwald ripening.
In the case of the non-aged seeding crystals, the curve is less steep. The dispersion of the dry seeds in the reactor and thus reaching equilibrium require more time which might correspond to the breakage of the agglomerates.
The fractured, sieved seeds generally have some propensity to aggregate, and if these aggregates are not actively dispersed, as the crystals grow, they may become fused together via solid bridge formation, resulting in agglomerates.55 The use of aged seeds is beneficial and according to Fig. 16 it results in rapid nucleation. Based on Fig. 15 and 16, 0.5% sieved, aged seeds were sufficient to induce excessive nucleation and result in a sudden concentration decrease, but agglomeration was observed in these batches (see the ESI†). Larger amounts of seeds (1 w/w% instead of 0.5 w/w%) resulted in a more significant concentration decrease, which is manifested in a higher increase in the number of particles in the system (see Fig. 16, yellow curve), thus lower supersaturation at the end of the isothermal hold (Fig. 15) which mitigated the agglomeration of the fine needles upon further cooling.
With the application of 1 w/w% sieved, aged seeds, the highest rise in the measured counts was observed, then maintained around a plateau with a slight decrease during the isothermal hold. Using these parameters, the desired distribution was obtained, as is reflected by the final product chord length distribution (Fig. 17). The target was a nucleation-dominated process which results in smaller particle size.
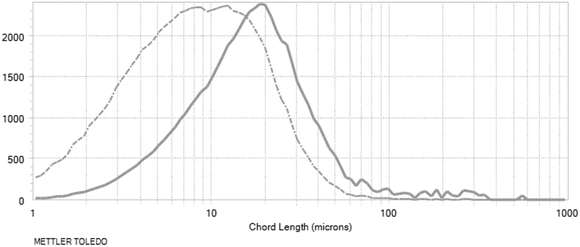 | ||
| Fig. 17 Chord length distributions at the end of the process: non-weighted distribution (dashed line), square-weighted distribution (solid line). Log distributions are shown. | ||
The impact of other process parameters including the stirring rate and cooling rate has all been studied for a comprehensive development of a robust crystallisation process. Further results about the method development will be published in a separate article.
Summary
In the current study, the polymorph and solvent selection was elaborated, followed by the development of a design space to produce the desired polymorph with suitable PSD. The polymorph selection of an API is determined by the stability of the crystal forms. It was challenging to unambiguously define the nature of the polymorphic relationship as the solvent composition was found to be one of the major factors in determining the crystal structure. The findings implied that preferential crystallization of the selected form is viable by tuning the solvent composition.Physical and chemical purity are equally important. Therefore, during solvent selection, the toxicity of the solvent, the thermodynamic stability in the applied media, the solubility as a function of temperature (the slope of the solubility curve and theoretical yield), and the influence on the product purity must be taken into consideration. The chemical purity of the API (which satisfied the requirements) is out of the scope of the current work, but all these criteria were involved in the selection process.
A systematic procedure was applied for identifying the operating conditions for a seeded, cooling crystallization process which minimizes the risk of concomitant crystallisation and provides the targeted PSD. This involved the determination of the solubility curve and metastable limit by means of a turbidity sensor, and using the metastable zone as a guide, crystallisation experiments with varying seeding protocols were conducted and monitored. The evolution of the solution concentration and chord length distribution was determined using ATR-FTIR and FBRM probes, respectively.
Selecting the appropriate seeding temperature and seeding amount was found to be crucial in ensuring the polymorphic purity. The introduction of 0.5 w/w% seeds at low supersaturation (σ = 28%) could not induce secondary nucleation and resulted in concomitant crystallisation of Phase 1 and Phase 2 upon further cooling. On the other hand, the relatively small amount of seeds (0.5 w/w%) used was sufficient to induce secondary nucleation at higher supersaturation (σ = 62.5%) and prevented the appearance of the unwanted polymorph, but agglomeration occurred as the cooling ramp started. The shape of the square-weighted mean CLD distribution was used as an indicator of agglomeration, as it emphasizes the coarse end of the distribution. However, the nucleation kinetics were similar applying 0.5 or 1 w/w% sieved, aged seeds at 55 °C (σ = 62.5%), and the resulting PSD only complied when 1% seeds were used. The doubled amount of seeds resulted in a more significant concentration decrease, thus lower supersaturation at the end of the isothermal hold, which mitigated the agglomeration of the fine needles upon further cooling.
The seed quality and quantity influenced the nucleation rate and played an important role in the final size distribution. The non-weighted linear chord counts <10 μm measured by FBRM were used as an indicator of the nucleation rate. The use of maturated, sieved seeds ensured consistent seed quality and resulted in rapid nucleation. The introduction of an isothermal hold period at the seeding temperature also influenced the concentration trajectory and thus both the polymorphic outcome and the final particle size. Excessive agitation facilitated the dispersion of the seed crystals in the reactor and aided secondary nucleation, hence a decrease in the crystal size distribution.
The experimental work described in this report demonstrates the use of FBRM and ATR-FTIR spectroscopy in the development of real-time monitoring and control of a pharmaceutical crystallisation process.
Conclusion
The investigation of four SLT hemihydrates revealed that the crystallisation and transformation behaviour of the polymorphs is strongly influenced by the solvent composition, presenting difficulties in deducing the relative relationship of the forms. The aim of this work was to select the most stable form and develop a crystallisation method in order to avoid concomitant crystallisation. Phase 1 was selected as a lead candidate, as this form possessed the highest density and melting point and had the lowest solubility in the majority of the solvents, including the dissolution media. The knowledge of the phase boundaries and the stability conditions helped in designing the crystallisation conditions. Process analytical tools were implemented to understand the crystallisation method: the concentration profile and chord length distribution were simultaneously tracked using in situ infrared and FBRM probes, which offered insights into the process and facilitated control over the desired polymorph and particle size.Acknowledgements
We would like to express our sincere acknowledgement to the Development Department, Zentiva k.s., Prague for providing the possibility to complete this research.References
- L. Yu, R. Lionberger, A. S. Raw, R. D'Costa, H. Wu and A. Hussain, Applications of process analytical technology to crystallization processes, Adv. Drug Delivery Rev., 2004, 56, 349–369 CrossRef CAS PubMed.
- M. Fujiwara, Z. K. Nagy, J. W. Chew and R. D. Braatz, First-principles and direct design approaches for the control of pharmaceutical crystallisation, J. Process Control, 2005, 15(5), 493–504 CrossRef CAS.
- M. Becker, Crystallisation–Understanding and developing the process, 2011, http://www.solvias.com/docs/download/en/004_Publications/Whitepaper_Crystallisation.pdf Search PubMed, accessed on 11. Nov. 2016.
- D. E. Braun, T. Gelbrich, V. Kahlenberg and U. J. Griesser, Insights into Hydrate Formation and Stability of Morphinanes from a Combination of Experimental and Computational Approaches, Mol. Pharmaceutics, 2014, 11(9), 3145–3163 CrossRef CAS PubMed.
- E. Tieger, V. Kiss, G. Pokol, Z. Finta, M. Dušek, J. Rohlíček and E. Skořepová, Studies on the crystal structure and arrangement of water in sitagliptin L-tartrate hydrates, CrystEngComm, 2016, 18, 3819–3831 RSC.
- R. K. Khankari and D. J. W. Grant, Pharmaceutical hydrates, Thermochim. Acta, 1995, 248, 61–79 CrossRef CAS.
- H. G. Brittain, Polymorphism in Pharmaceutical Solids, Taylor & Francis, 2nd edn, 2009 Search PubMed.
- J. Richter, P. Lehnert, K. Jarrach, O. Dammer and L. Krejcík, A stable polymorph (Form Z1) of the salt of (2R)-4-oxo-4-[3-(trifluoromethyl)-5,6-dihydro [152,4]triazolo[4,3-]pyrazin-7(8H)-yl]-1-(2s4,5-trifluorophenyl)butan-2-amine (sitagliptin) with L-tartaric acid, WO2015062562 A1, 01.11., 2013.
- J. Richter, K. Jarrach, V. Kiss, E. Tieger, J. Havlícek and O. Dammer, Crystalline modification 2 of (3r)-3-amino-l-[3-(trifluoromethyl)-6,8-dihydro-5h- [l1,2,4]triazolol[4,3-]pyrazin-7-yl]-4-(2,4,5-trifluorophenyl)butan-1-one l-tartrate, WO2016112879, 13.01., 2015.
- J. Richter, K. Jarrach, V. Kiss, E. Tieger, J. Havlícek and O. Dammer, Crystalline modification 3 of (3r)-3-amino-l-[3-(trifluoromethyl)-6,8-dihydro-5h- [l1,2,4]triazolol[4,3-]pyrazin-7-yl]-4-(2,4,5-trifluorophenyl)butan-1-one l-tartrate, WO2016112880, 13.01., 2015.
- R. Ferlita, K. Hansen, V. Vydra, C. M. Lindemann and Y. Wang, Novel crystalline salts of a dipeptidyl peptidase-iv inhibitor, WO2005072530, 11.08., 2005.
- Z. K. Nagy, J. W. Chew, M. Fujiwara and R. D. Braatz, Comparative performance of concentration and temperature controlled batch crystallisations, J. Process Control, 2008, 18(3), 399–407 CrossRef CAS.
- J. Bernstein, R. J. Davey and J. O. Henck, Concomitant Polymorphs, Angew. Chem., Int. Ed., 1999, 38(23), 3440–3461 CrossRef PubMed.
- A. Burger and R. Ramberger, On the polymorphism of pharmaceuticals and other molecular crystals. I, Microchim. Acta, 1979, 72(3), 259–271 CrossRef.
- G. Chong-Hu and D. J. W. Grant, Estimating the Relative Stability of Polymorphs and Hydrates from Heats of Solution and Solubility Data, J. Pharm. Sci., 2001, 90(9), 1277–1287 CrossRef.
- A. I. Kitaigorodskii and C. A. Beevers, Organic chemical crystallography, Acta Crystallogr., 1962, 15(6), 622–623 Search PubMed.
- A. Burger and R. Ramberger, On the polymorphism of pharmaceuticals and other molecular crystals. II, Microchim. Acta, 1979, 72(3–4), 273–316 CrossRef.
- H. G. Brittain, Polymorphism in Pharmaceutical Solids first Edition, Taylor & Francis, 1999 Search PubMed.
- L. X. Yu and G. L. Amidon, Analytical Solutions to Mass Transfer, in, Transport Processes in Pharmaceutical Systems, ed. G. L. Amidon, P. I. Lee and E. M. Topp, Marcel Dekker, Inc., 1999, pp. 23–54 Search PubMed.
- Y. Qiu, W. R. Porter, Y. Chen, G. G. Z. Zhang and L. Liu, Developing Solid Oral Dosage Forms: Pharmaceutical Theory and Practice, Academic Press, 2009 Search PubMed.
- D. J. W. Grant, H. Zhu and C. Yuen, Influence of water activity in organic solvent + water mixtures on the nature of the crystallizing drug phase. 1. Theophylline, Int. J. Pharm., 1996, 135, 151–160 CrossRef.
- C. H. Gu, V. Young Jr. and D. J. W. Grant, Polymorph Screening: Influence of Solvents on the Rate of Solvent-Mediated Polymorphic Transformation, J. Pharm. Sci., 2001, 90(11), 1878–1890 CrossRef CAS PubMed.
- W. Ostwald, Studien über die Bildung und Umwandlung fester Körper, Z. Phys. Chem., Stoechiom. Verwandtschaftsl., 1897, 22, 289–330 CAS.
- R. A. Storey and I. Ymén, Solid State Characterization of Pharmaceuticals, John Wiley & Sons, Chichester, UK, 2011 Search PubMed.
- S. Khoshkhoo and J. Anwar, Crystallisation of polymorphs: the effect of solvent, J. Phys. D: Appl. Phys., 1993, 26(8B), B90–B93 CrossRef CAS.
- S. Maruyama and H. Ooshima, Crystallisation behavior of taltirelin polymorphs in a mixture of water and methanol, J. Cryst. Growth, 2000, 212(1–2), 239–245 CrossRef CAS.
- D. Mangin, F. Puel and S. Veesler, Polymorphism in Processes of Crystallisation in Solution: A Practical Review, Org. Process Res. Dev., 2009, 13(6), 1241–1253 CrossRef CAS.
- M. Kitamura, Strategy for control of crystallisation of polymorphs, CrystEngComm, 2009, 11, 949–964 RSC.
- M. Kitamura and K. Nakamura, Effects of solvent composition and temperature on polymorphism and crystallisation behavior of thiazole-derivative, J. Cryst. Growth, 2002, 236(4), 676–686 CrossRef CAS.
- R. C. Kelly and N. Rodríguez-Hornedo, Solvent Effects on the Crystallisation and Preferential Nucleation of Carbamazepine Anhydrous Polymorphs: A Molecular Recognition Perspective, Org. Process Res. Dev., 2009, 13(6), 1291–1300 CrossRef CAS.
- E. Simone, A. N. Saleemi, N. Tonnon and Z. K. Nagy, Active Polymorphic Feedback Control of Crystallisation Processes Using a Combined Raman and ATR-UV/Vis Spectroscopy Approach, Cryst. Growth Des., 2014, 14(4), 1839–1850 CAS.
- M. Kitamura, E. Umeda and K. Miki, Mechanism of Solvent Effect in Polymorphic Crystallisation of BPT, Ind. Eng. Chem. Res., 2012, 51(39), 12814–12820 CrossRef CAS.
- H. Hao, W. Du, Q. Yin, J. Gong, Y. Bao, X. Zhang, X. Sun, S. Ding, C. Xie and M. Zhang, Effects of Solvent on Polymorph Formation and Nucleation of Prasugrel Hydrochloride, Cryst. Growth Des., 2014, 14(9), 4519–4525 Search PubMed.
- R. J. Davey, N. Blagden, S. Righini, H. Alison, M. J. Quayle and S. Fuller, Crystal Polymorphism as a Probe for Molecular Self-Assembly during Nucleation from Solutions: The Case of 2,6-Dihydroxybenzoic Acid, Cryst. Growth Des., 2001, 1(1), 59–65 CAS.
- K. Takeguchi, K. Obitsu, S. Hirasawa, R. Orii, S. Ieda, M. Okada and H. Takiyama, Effect of Temperature and Solvent of Solvent-Mediated Polymorph Transformation on ASP3026 Polymorphs and Scale-up, Org. Process Res. Dev., 2016, 20(5), 970–976 CrossRef CAS.
- C. A. Hunter, Quantifying intermolecular interactions: guidelines for the molecular recognition toolbox, Angew. Chem., Int. Ed., 2004, 43, 5310–5324 CrossRef CAS PubMed.
- G. R. Desiraju, Supramolecular synthons in crystal engineering—a new organic synthesis, Angew. Chem., Int. Ed., 2003, 34(21), 2311–2327 CrossRef.
- P. Augustijns and M. Brewster, Solvent Systems and Their Selection in Pharmaceutics and Biopharmaceutics, Springer, 2007 Search PubMed.
- M. Kitamura, Thermodynamic stability and transformation of pharmaceutical polymorphs, Pure Appl. Chem., 2005, 77(3), 581–591 CrossRef CAS.
- Recent Advances for Seeding a Crystallisation Process A Review of Modern Techniques, http://www.mt.com/dam/non-indexed/po/autochem/Seeding-A4.pdf, accessed 7, Dec 2016 Search PubMed.
- F. Tian, H. Qu, M. Louhi-Kultanen and J. Rantanen, Crystallisation of a polymorphic hydrate system, J. Pharm. Sci., 2010, 99(2), 753–763 CrossRef CAS PubMed.
- F. M. Mirabella, Internal Reflection Spectroscopy, Marcel Dekker, Inc., New York, 1993 Search PubMed.
- J. Cornel, C. Lindenberg and M. Mazzotti, Quantitative Application of in Situ ATR-FTIR and Raman Spectroscopy in Crystallisation Processes, Ind. Eng. Chem. Res., 2008, 47, 4870–4882 CrossRef CAS.
- Y. H. Luo, Y. R. Tu, J. L. Ge and B. W. Sun, Monitoring the Crystallisation Process of Methylprednisolone Hemisuccinate (MPHS) From Ethanol Solution by Combined ATR-FTIR-FBRM-PVM, Sep. Sci. Technol., 2013, 48(12), 1881–1890 CrossRef CAS.
- A. S. Myerson, Handbook of industrial crystallisation, Butterworth-Heinemann, 2011 Search PubMed.
- D. Littlejohn, P. Hamilton, A. Nordon, J. Sefcik and P. Slavinc, Validity of particle size analysis techniques for measurement of the attrition that occurs during vacuum agitated powder drying of needle-shaped particles, Analyst, 2012, 137, 118–125 RSC.
- A. Vaccaro, J. Sefcik and M. Morbidelli, Modeling Focused Beam Reflectance Measurement and its Application to Sizing of Particles of Variable Shape, Part. Part. Syst. Charact., 2007, 23, 360–373 CrossRef CAS.
- N. K. Nere, D. Ramkrishna, B. E. Parker, W. V. Bell and P. Mohan, Ind. Eng. Chem. Res., 2006, 46, 3041–3047 CrossRef.
- T. Leyssens, C. Baudry and M. L. E. Hernandez, Optimization of a Crystallisation by Online FBRM Analysis of Needle-Shaped Crystals, Org. Process Res. Dev., 2011, 15, 413–426 CrossRef CAS.
- A. Chianese and H. J. Kramer, Industrial Crystallisation Process Monitoring and Control, Wiley-VCH, 2010 Search PubMed.
- A. J. Blacker and M. T. Williams, Pharmaceutical Process Development: Current Chemical and Engineering Challenges edited by, RSC publishing, Cambridge, 2011 Search PubMed.
- Small scale crystallisation development using Lasentec® FBRM® and PVM®, http://qc-cpr.enterpriseapplicationdevelopers.com/mt_dev_7/?q=system/files/small_scale_crystallization_Lasentec_FBRM_PVM.pdf, accessed 29, Dec 2016 Search PubMed.
- Rapid crystallisation development and scale-up using in-process tools, Supplement to Chimica Oggi/CHEMISTRY TODAY vol 26 n 1 • Focus on PAT, http://www.teknoscienze.com/agro/pdf/PATo'grady.pdf, accessed 28, Nov 2016.
- L. Feng and K. A. Berglund, ATR-FTIR for Determining Optimal Cooling Curves for Batch Crystallisation of Succinic Acid, Cryst. Growth Des., 2002, 2(5), 449–452 CAS.
- A. Cote, E. Sirota and A. Moment, The pursuit of a robust approach for growing crystals directly to target size Article in American Pharmaceutical Review, 2010, vol. 13(7), pp. 46–51, http://www.americanpharmaceuticalreview.com/Featured-Articles/37057-The-Pursuit-of-a-Robust-Approach-for-Growing-Crystals-Directly-to-Target-Size/, accessed 03, Dec, 2016 Search PubMed.
Footnote |
| † Electronic supplementary information (ESI) available. See DOI: 10.1039/c7ce00041c |
| This journal is © The Royal Society of Chemistry 2017 |

