Comment on “1,4-Diazabicyclo[2.2.2]octane-based disalts showing non-centrosymmetric structures and phase transition behaviors” by X.-B. Han, P. Hu, C. Shi and W. Zhang, CrystEngComm, 2016, 18, 1563†
Marek
Szafrański
Faculty of Physics, Adam Mickiewicz University, Umultowska 85, 61-614 Poznań, Poland. E-mail: masza@amu.edu.pl
First published on 8th December 2016
Abstract
This Letter is in response to a paper by Han et al. (CrystEngComm, 2016, 18, 1563–1569) on the structures and isostructural phase transitions in (dabcoH2)(BF4)2·H2O and (dabcoH2)(ClO4)2·H2O. It is shown that the phase transitions in these compounds have a second-order character and their low-temperature phases exhibit ferroelastic properties. Thus, the transitions cannot be isostructural. The redeterminations of both crystal structures as a function of temperature evidence that at the transition points the symmetry is reduced from orthorhombic to triclinic.
In a recently published paper, Han et al.1 reported on the synthesis and characterization of two monohydrates of 1,4-diazabicyclo[2.2.2]octane (dabco). The authors have shown that at room temperature, the crystals of (dabcoH2)(BF4)2·H2O and (dabcoH2)(ClO4)2·H2O are isostructural in the space group Pca21, and they undergo phase transitions in the temperature range 230–250 K. Basing on the calorimetric and dielectric measurements, as well as on the single-crystal structural studies as a function of temperature, Han and co-workers came to the statement that “the two crystals undergo reversible structural phase transitions near room temperature without any symmetry changes”. This is an intriguing conclusion, because the isostructural transitions occur relatively rarely in solids, and moreover, they are distinguished by some exceptional features like an ending critical point in the pressure–temperature phase diagram and overcritical behaviour beyond this point.2,3 One of the immanent features of the isostructural phase transitions is also their first-order character, which implies a temperature hysteresis of the transition point between the cooling and heating runs, and a jump-wise change of the crystal volume.4,5 None of these important properties have been evidenced in the paper by Han et al.1 What is more, the shape of the DSC (differential scanning calorimetry) anomalies, presented in their work, strongly suggests that the transitions have a continuous character, although the authors suggested the presence of first-order phase transitions by marking the transition temperatures 230/234 K and 244/248 K, respectively, for (dabcoH2)(BF4)2·H2O and (dabcoH2)(ClO4)2·H2O in the cooling/heating DSC runs. However, these temperatures correspond to the peaks of the thermal anomalies, whereas for a second-order phase transition, the transition temperature is defined by the onset and peak of the anomalies, respectively, in the cooling and heating runs. A proper analysis of the calorimetric data reported in ref. 1 leads to the conclusion that both phase transitions do not exhibit thermal hysteresis. It is also worth mentioning that in the case of first-order phase transitions, the onset of the anomaly is taken as the transition temperature, both on cooling and on heating the sample.6 For this reason, there is no possibility to ascribe the thermal anomalies observed for (dabcoH2)(BF4)2·H2O and (dabcoH2)(ClO4)2·H2O in ref. 1 to first-order phase transitions.
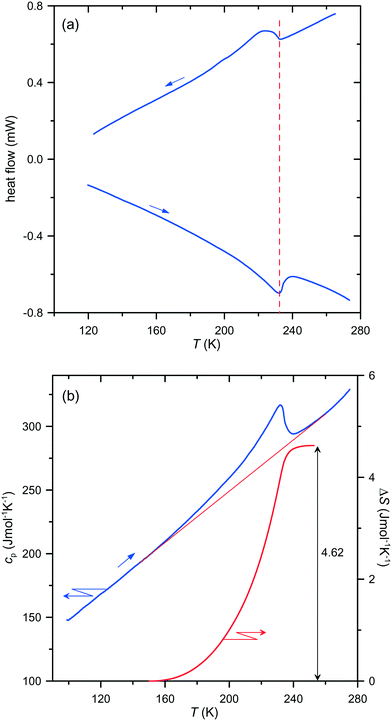
A re-investigation of the DSC runs for both compounds confirmed a lack of temperature hysteresis, a stepwise change in the specific heat at the transition point and a continuous entropy increase as a function of temperature, as illustrated in Fig. 1 for (dabcoH2)(BF4)2·H2O and in Fig. S1 (ESI†) for (dabcoH2)(ClO4)2·H2O.
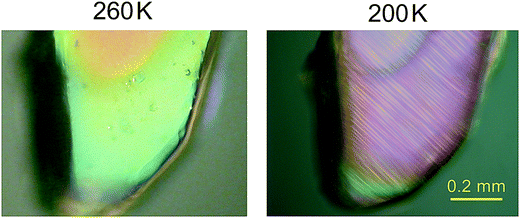
Thus, the anomalies in the specific heat and entropy of both compounds exhibit the characteristic features of second-order phase transitions. Therefore, the isostructural character of the transitions must be excluded, and consequently, a symmetry breaking must occur at the transition points, which is required for second-order phase transitions.7 Moreover, in such a case, the space groups of the high- and low-temperature phases must fulfil a group–subgroup relation.7 The space group Pca21 of the high-temperature phases of (dabcoH2)(BF4)2·H2O and (dabcoH2)(ClO4)2·H2O, confirmed by the present study (see Tables 1 and 2) implies that only four space groups for the structures of the low-temperature phases are possible, namely Pc, Pa, P21 and P1. In each case, the crystal would change the crystallographic system from orthorhombic to monoclinic or to triclinic. This means that the transition should exhibit ferroelastic properties. Indeed, the observations of the single-crystal plates of (dabcoH2)(ClO4)2·H2O under a polarizing microscope shows that a ferroelastic domain structure appears in the low-temperature phase, below the transition temperature of 246 K (see Fig. 2). Similarly, fine ferroelastic domains were observed in the low-temperature phase of (dabcoH2)(BF4)2·H2O (Fig. S2†). It is worth noticing that the spontaneous strain associated with the transition to low-temperature phase II is very subtle in both compounds, as indicated by the lattice angles, all close to 90° (see Table 1). In such a case, the orientation states, characteristic of a ferroelastic phase,8 differ by a very tiny distortion. As a consequence, in polarized light, the contrast between the different states separated by domain walls is weak. Nevertheless, the optical observations clearly evidence that the orientation states arise on cooling the crystals below the transition points, and the domains disappear when the crystals come back to phase I.
| This work | Ref. 1 | |||||
|---|---|---|---|---|---|---|
| a The model calculated for the data collected by Han et al.1 | ||||||
| Empirical formula | C6H16B2F8N2O | C6H16B2F8N2O | C6H16B2F8N2O | C6H16B2F8N2O | C6H16B2F8N2O | C6H16B2F8N2O |
| Phase | I | II | II | IIa | I | II |
| T/K | 250.0(1) | 220.0(1) | 150.0(1) | 203(2) | 296(2) | 203(2) |
| Crystal system | Orthorhombic | Triclinic | Triclinic | Triclinic | Orthorhombic | Orthorhombic |
| Space group | Pca21 | P1 | P1 | P1 | Pca21 | Pca21 |
| Z | 4 | 4 | 4 | 4 | 4 | 4 |
| a/Å | 13.1253(2) | 7.8457(2) | 7.8089(2) | 7.8370(2) | 13.2311(7) | 13.0629(4) |
| b/Å | 7.86257(13) | 11.6885(2) | 11.6361(2) | 11.6838(2) | 7.8834(4) | 7.8370(2) |
| c/Å | 11.71964(16) | 13.0792(3) | 12.9991(3) | 13.0629(4) | 11.7859(7) | 11.6838(2) |
| α/° | 90 | 90.0075(18) | 90.003(2) | 90 | 90 | 90 |
| β/° | 90 | 89.998(2) | 89.991(2) | 90 | 90 | 90 |
| γ/° | 90 | 90.0165(19) | 90.009(2) | 90 | 90 | 90 |
| V/Å3 | 1209.45(3) | 1199.42(5) | 1181.17(4) | 1196.12(6) | 1229.34(12) | 1196.12(6) |
| ρ calc/g cm−3 | 1.680 | 1.694 | 1.720 | 1.698 | 1.653 | 1.698 |
| μ/mm−1 | 0.190 | 0.192 | 0.195 | 1.761 | 1.714 | 1.761 |
| θ range/° | 2.59–30.26 | 2.337–30.175 | 2.35–30.20 | 5.645–68.269 | 6.536–68.188 | 5.645–68.269 |
| Refl. coll./unique | 29![[thin space (1/6-em)]](https://www.rsc.org/images/entities/char_2009.gif) 590/3449 590/3449 |
31![[thin space (1/6-em)]](https://www.rsc.org/images/entities/char_2009.gif) 216/12 216/12![[thin space (1/6-em)]](https://www.rsc.org/images/entities/char_2009.gif) 966 966 |
30![[thin space (1/6-em)]](https://www.rsc.org/images/entities/char_2009.gif) 695/12 695/12![[thin space (1/6-em)]](https://www.rsc.org/images/entities/char_2009.gif) 773 773 |
8888/5120 | 7954/2255 | 8326/1813 |
| R int | 0.0227 | 0.0191 | 0.0194 | 0.0239 | 0.0195 | 0.0378 |
| R 1/wR2 (I > 2σI) | 0.0407/0.1101 | 0.0360/0.0901 | 0.0235/0.0577 | 0.0286/0.0704 | 0.0427/0.1301 | 0.0873/0.2236 |
| R 1/wR2 (all data) | 0.0446/0.1135 | 0.0415/0/0940 | 0.0246/0.0584 | 0.0313/0.0721 | 0.0435/0.1312 | 0.0884/0.2244 |
| GOF | 1.053 | 1.028 | 1.071 | 1.051 | 1.008 | 0.979 |
| Flack parameter | 0.01(11) | −0.33(10) | 0.52(8) | 0.47(8) | 0.06(5) | 0.2(7) |
| Peak/hole (e Å−3) | 0.253/−0.212 | 0.283/−0.174 | 0.206/−0.144 | 0.181/−0.151 | 0.208/−0.159 | 0.372/−0.486 |
| This work | Ref. 1 | ||||
|---|---|---|---|---|---|
| Empirical formula | C6H16Cl2N2O9 | C6H16Cl2N2O9 | C6H16Cl2N2O9 | C6H16Cl2N2O9 | C6H16Cl2N2O9 |
| Phase | I | II | II | I | II |
| T/K | 260.0(1) | 200.0(1) | 150.0(1) | 293(2) | 233(2) |
| Crystal system | Orthorhombic | Triclinic | Triclinic | Orthorhombic | Orthorhombic |
| Space group | Pca21 | P1 | P1 | Pca21 | Pca21 |
| Z | 4 | 4 | 4 | 4 | 4 |
| a/Å | 13.3063(2) | 8.02169(15) | 7.9990(2) | 13.357(10) | 13.296(10) |
| b/Å | 8.0603(1) | 11.7137(2) | 11.6844(3) | 8.073(7) | 8.069(6) |
| c/Å | 11.7787(1) | 13.2529(2) | 13.2191(2) | 11.836(10) | 11.772(9) |
| α/° | 90 | 89.9946(15) | 89.992(2) | 90 | 90 |
| β/° | 90 | 90.0068(15) | 90.022(2) | 90 | 90 |
| γ/° | 90 | 89.9829(15) | 90.008(2) | 90 | 90 |
| V/Å3 | 1263.30(3) | 1245.29(4) | 1235.51(4) | 1276.3(18) | 1263.0(16) |
| ρ calc/g cm−3 | 1.741 | 1.766 | 1.780 | 1.723 | 1.741 |
| μ/mm−1 | 0.559 | 0.567 | 0.572 | 0.554 | 0.560 |
| θ range/° | 2.53–30.27 | 2.320–30.329 | 2.33–30.23 | 2.95–27.45 | 3.46–27.45 |
| Refl. coll./unique | 25![[thin space (1/6-em)]](https://www.rsc.org/images/entities/char_2009.gif) 025/3604 025/3604 |
32![[thin space (1/6-em)]](https://www.rsc.org/images/entities/char_2009.gif) 542/13 542/13![[thin space (1/6-em)]](https://www.rsc.org/images/entities/char_2009.gif) 523 523 |
32![[thin space (1/6-em)]](https://www.rsc.org/images/entities/char_2009.gif) 604/13 604/13![[thin space (1/6-em)]](https://www.rsc.org/images/entities/char_2009.gif) 404 404 |
8696/2917 | 8501/2222 |
| R int | 0.0243 | 0.0192 | 0.0343 | 0.0421 | 0.0712 |
| R 1/wR2 (I > 2σI) | 0.0249/0.0658 | 0.0205/0.0547 | 0.0239/0.0585 | 0.0337/0.0818 | 0.0553/0.1263 |
| R 1/wR2 (all data) | 0.0265/0.0668 | 0.0212/0.0552 | 0.0247/0.0591 | 0.0375/0.0841 | 0.0564/0.1270 |
| GOF | 1.071 | 1.066 | 1.038 | 1.026 | 1.173 |
| Flack parameter | −0.023(11) | 0.479(8) | −0.210(14) | 0.02(4) | 0.15(7) |
| Peak/hole (e Å−3) | 0.241/−0.233 | 0.276/−0.228 | 0.263/−0.239 | 0.232/−0.294 | 0.352/−0.360 |
The re-examination of the low-temperature structures of both compounds by single-crystal X-ray diffraction evidenced that despite the unit cells with all angles close to 90° satisfying the orthorhombic system, the symmetry of the crystals is lowered to the triclinic space group P1 (Tables 1 and 2). The solution and refinements of these structures in the higher-symmetric monoclinic space groups Pc and P21 resulted in models with much higher reliability R-factors, and with the cations disordered even at 150 K, where both crystals should be well-ordered, according to the calorimetric data (see Fig. 1 and S1†). It is noteworthy that a similar incorrect model of the low-temperature structure of (dabcoH2)(BF4)2·H2O in phase II, with strongly disordered cations at 203 K, i.e., about 30 K below the transition point, was obtained by Han et al.1 for the wrongly assigned space group Pca21. Their model is clearly disconnected from the postulated order–disorder transition mechanism. As shown in Fig. 1, the total entropy change associated with the transition in (dabcoH2)(BF4)2·H2O is close to R![[thin space (1/6-em)]](https://www.rsc.org/images/entities/char_2009.gif) ln
ln![[thin space (1/6-em)]](https://www.rsc.org/images/entities/char_2009.gif) 2 (R is the gas constant), so the low-temperature structure should be ordered in a case where a two-site disorder is observed in the high-temperature phase. The two-site disorder of one of the two BF4− anions occupying different sites in the crystal lattice was confirmed by the structure determination at 250 K (Table 1). However, the model of disorder differs from that proposed earlier,1 where all fluorine atoms of BF4− occupy splitted sites. In our case, one of the fluorine atoms is ordered, whereas the remaining three perform rotations between the two sites, around the pseudo-threefold axis aligned along the ordered B–F bond. The refinement of the structure gave the site occupancy factors (SOFs) 0.55 and 0.45 for the two alternative sites. A similar model of disorder of one of the ClO4− anions was derived from the data collected at 260 K for (dabcoH2)(ClO4)2·H2O, but with SOFs of 0.62 and 0.38. The larger difference between the SOFs in the latter case indicates that the disorder in (dabcoH2)(BF4)2·H2O may by higher than that in its perchlorate counterpart. This conclusion is consistent with the entropy changes of 4.62 and 2.83 J mol−1 K−1, associated with the transitions in (dabcoH2)(BF4)2·H2O and (dabcoH2)(ClO4)2·H2O, respectively. The refinements of the 150 K structures of both compounds do not indicate any trace of disorder, which fully agrees with the calorimetric results. The data collected for (dabcoH2)(ClO4)2·H2O at 200 K show that even at a much higher temperature this structure is practically ordered, and it can be well refined in the space group P1 without a splitting of the oxygen atoms (Table 2). For the tetrafluoroborate crystal, the structural measurements performed in close proximity to the transition point, at 220 K, confirmed the triclinic symmetry of phase II (Table 1). However, in this case the enhanced thermal ellipsoids of some fluorine atoms point to a residual disorder at this temperature.
2 (R is the gas constant), so the low-temperature structure should be ordered in a case where a two-site disorder is observed in the high-temperature phase. The two-site disorder of one of the two BF4− anions occupying different sites in the crystal lattice was confirmed by the structure determination at 250 K (Table 1). However, the model of disorder differs from that proposed earlier,1 where all fluorine atoms of BF4− occupy splitted sites. In our case, one of the fluorine atoms is ordered, whereas the remaining three perform rotations between the two sites, around the pseudo-threefold axis aligned along the ordered B–F bond. The refinement of the structure gave the site occupancy factors (SOFs) 0.55 and 0.45 for the two alternative sites. A similar model of disorder of one of the ClO4− anions was derived from the data collected at 260 K for (dabcoH2)(ClO4)2·H2O, but with SOFs of 0.62 and 0.38. The larger difference between the SOFs in the latter case indicates that the disorder in (dabcoH2)(BF4)2·H2O may by higher than that in its perchlorate counterpart. This conclusion is consistent with the entropy changes of 4.62 and 2.83 J mol−1 K−1, associated with the transitions in (dabcoH2)(BF4)2·H2O and (dabcoH2)(ClO4)2·H2O, respectively. The refinements of the 150 K structures of both compounds do not indicate any trace of disorder, which fully agrees with the calorimetric results. The data collected for (dabcoH2)(ClO4)2·H2O at 200 K show that even at a much higher temperature this structure is practically ordered, and it can be well refined in the space group P1 without a splitting of the oxygen atoms (Table 2). For the tetrafluoroborate crystal, the structural measurements performed in close proximity to the transition point, at 220 K, confirmed the triclinic symmetry of phase II (Table 1). However, in this case the enhanced thermal ellipsoids of some fluorine atoms point to a residual disorder at this temperature.
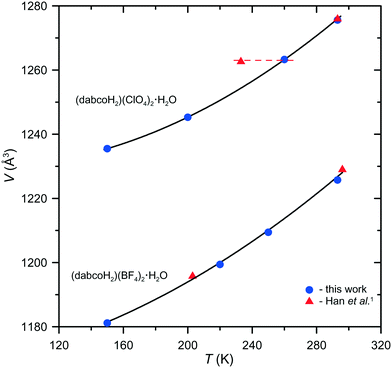
The triclinic model of phase II was applied to the data collected by Han et al.1 The details of the refinement of the (dabcoH2)(BF4)2·H2O structure at 203 K, listed in Table 1, are definitely in favour of the space group P1. It is worth stressing that this model does not involve any splitting of the atoms, as opposed to the orthorhombic model by Han et al.1 Similar calculations performed for (dabcoH2)(ClO4)2·H2O on the data collected by Han et al.1 at 233 K have totally failed. To explain this surprising result, we plotted the unit-cell volume of both crystals as a function of temperature (Fig. 3) using our data and those measured by Han et al.1 As seen from these plots for (dabcoH2)(BF4)2·H2O, all the measurements are consistent, whereas for (dabcoH2)(ClO4)2·H2O, only the crystal volume measured in ref. 1 at 293 K is in accordance with the V(T) dependence, while that measured at 233 K clearly diverges. This crystal volume corresponds to a temperature of about 260 K, as indicated by the horizontal dashed line in Fig. 3. Thus, it is highly probable that the “low-temperature” structure was in fact measured in the high-temperature phase.
 | ||
| Fig. 3 Temperature dependence of the unit-cell volume of (dabcoH2)(BF4)2·H2O and (dabcoH2)(ClO4)2·H2O. | ||
In conclusion, this study clearly shows that the crystals of (dabcoH2)(BF4)2·H2O and (dabcoH2)(ClO4)2·H2O exhibit a pseudo-orthorhombic symmetry in their low-temperature phases II, but their real symmetry is lowered to triclinic of space group P1. Thus, the postulated isostructural character of the transitions observed in these substances must be excluded.
References
- X.-B. Han, P. Hu, C. Shi and W. Zhang, CrystEngComm, 2016, 18, 1563–1569 RSC.
- K. Gesi, Phase Transitions, 1992, 40, 187–215 CrossRef CAS.
- A. Jeżowski, R. Poprawski and J. Mróz, J. Korean Phys. Soc., 1998, 32, S210–S211 Search PubMed.
- J. F. Scott, Adv. Mater., 2010, 22, 2106–2107 CrossRef CAS PubMed.
- V. E. Schneider and E. E. Tornau, Phys. Status Solidi B, 1982, 111, 565–574 CrossRef CAS.
- G. W. H. Höhne, W. F. Hemminger and H.-J. Flammersheim, Differential Scanning Calorimetry, Springer-Verlag, Berlin Heidelberg, Germany, 2003 Search PubMed.
- L. D. Landau and E. M. Lifshitz, Statistical Physics, Pergamon Press, Oxford, U. K., 1980 Search PubMed.
- J. Sapriel, Phys. Rev. B: Solid State, 1975, 12, 5128–5140 CrossRef CAS.
Footnote |
| † Electronic supplementary information (ESI) available. CCDC 1488023–1488026, 1502095, 1502096. For ESI and crystallographic data in CIF or other electronic format see DOI: 10.1039/c6ce01469k |
| This journal is © The Royal Society of Chemistry 2017 |


