
 Open Access Article
 This Open Access Article is licensed under a Creative Commons Attribution-Non Commercial 3.0 Unported Licence
A membrane-anchored aptamer sensor for probing IFNγ secretion by single cells†
Liping
Qiu
ab,
Florian
Wimmers
 b,
Jorieke
Weiden
b,
Hans A.
Heus
c,
Jurjen
Tel‡
*bde and
Carl G.
Figdor‡
*b
b,
Jorieke
Weiden
b,
Hans A.
Heus
c,
Jurjen
Tel‡
*bde and
Carl G.
Figdor‡
*b
aMolecular Science and Biomedicine Laboratory, State Key Laboratory of Chemo/Biosensing and Chemometrics, College of Chemistry and Chemical Engineering, Hunan University, Changsha 410082, China
bDepartment of Tumor Immunology, Institute for Molecular Life Sciences, Radboud University Medical Center, Nijmegen, The Netherlands. E-mail: Carl.Figdor@radboudumc.nl
cInstitute for Molecules and Materials, Radboud University, Nijmegen, The Netherlands
dDepartment of Biomedical Engineering, Laboratory of Immunoengineering, Eindhoven University of Technology, Eindhoven, The Netherlands. E-mail: J.Tel@tue.nl
eInstitute for Complex Molecular Systems, Eindhoven University of Technology, Eindhoven, The Netherlands
First published on 26th June 2017
Abstract
Insight into the behavior of individual immune cells, in particular cytokine secretion, will contribute to a more fundamental understanding of the immune system. In this work, we have developed a cell membrane-anchored sensor for the detection of cytokines secreted by single cells using a combination of aptamer-based sensors and droplet microfluidics.
Cellular heterogeneity is considered a hallmark of biological systems and has significant impact on various cellular processes especially in the immune system.1,2 Key immunological functions such as the activation of NF-κB3 or the induction of anti-viral immunity4 emerge as heterogeneous processes and can display digital behaviour. Insight into immune cell behaviour, and in particular cytokine secretion, at the single-cell level is important to define cell-to-cell variation and to get a better understanding of how individual immune cells can contribute to and control global immune responses.5 So far, most experimental approaches, e.g. enzyme-linked immunosorbent assay (ELISA), only yield the global outcome of the bulk population, potentially blending and masking the unique contributions of individual cells.6,7 This problem is particularly pronounced in immunology where the outputs of immune responses are often combined behaviours of highly heterogeneous ensembles of cells. Although antibody-based flow cytometry assays are able to perform single cell cytokine readouts, they are designed as end-point assays and cannot be used to monitor cytokine production with high spatiotemporal resolution.
Microfluidics enable the generation of picolitre water-in-oil droplets which serve as a versatile platform for the development of low-cost and high-throughput single-cell analysis tools.8–10 While microfluidic systems have been successfully used to compartmentalize individual cells dating back to the 1950s, the lack of easy-to-handle detection techniques with on-line implementation, high sensitivity, high selectivity and a “signal-on” reporting mechanism has hampered the development of droplet-based single cell research.11 These challenges may be addressed by exploiting aptamers as biosensors. Aptamers are artificial nucleic acids generated through an in vitro selection method based on their specific binding with target molecules.12,13 In addition to their high binding affinity and high specificity, aptamers have the intrinsic advantages of flexible design, simple synthesis and convenient modification, making them promising molecular tools for the development of novel biological assays.14,15 Meanwhile, cytokine secretion by immune cells is a transient biological process with rapid fluctuation.16 Cell membrane-anchored aptamer sensors, which directly measure cytokines produced by a cell, have a high potential for accurate real-time monitoring of cellular functions.17,18
In this work, we developed a cell membrane-anchored fluorescent aptamer sensor and combined it with a droplet-microfluidic platform to detect cytokine secretion at the single-cell level (Scheme 1). As a proof of concept, the type II interferon (IFNγ),19 a cytokine that is critical for both innate and adaptive immunity against a broad range of threats, was used as the target cytokine. An IFNγ-specific aptamer20 was used as the recognition unit. The 3′ end of the IFNγ aptamer was extended with a short DNA sequence (9 mer, termed as cDNA1) which was complementary to the 5′-end section of the aptamer. This extended aptamer could self-hybridize into a hairpin structure. For fluorescence signalling, its two ends were separately labelled with a ROX fluorophore and a TAO quencher. At the initiation stage, ROX and TAO were kept in close proximity due to the formation of the hairpin structure, resulting in quenched fluorescence. Upon binding with IFNγ, the aptamer probe (AP) will switch into a specific tertiary structure, separating the fluorophore from the quencher, thus leading to restoration of the fluorescence. To engineer a cell-surface aptamer sensor, the 5′-end of AP was linked to a cholesterol tail. Based on hydrophobic interaction between the cholesterol tail and the cellular phospholipid layer, the AP can be efficiently anchored onto the membrane.21 This cell membrane-anchored AP can directly probe the extracellular microenvironment, thus enabling the detection of cytokine secretion by immune cells. Finally, single aptamer-decorated T cells were encapsulated in droplets (65 pL) and stimulated, which allowed us to probe the cytokine production of single cells with high throughput.
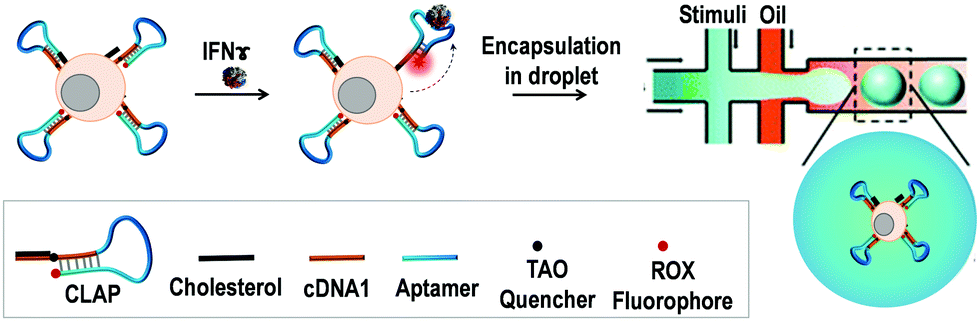 | ||
| Scheme 1 Schematic illustration of a T cell-surface aptamer sensor for measuring cytokine secretion at the single-cell level. The cholesterol-linked aptamer probe (CLAP) can efficiently anchor onto the cell surface based on the hydrophobic interaction between the cholesterol tail and the cellular phospholipid layer. Upon binding of the secreted target cytokine, the fluorescence of the aptamer probe will be turned on. By using the microfluidic chip system, the aptamer-decorated T cells could be individually encapsulated into droplets, thus enabling the detection of the cytokine secretion at the single-cell level. | ||
The specific response of the cholesterol-linked aptamer probe (CLAP) to IFNγ was first evaluated in a buffer solution by fluorescence spectroscopy. As shown in Fig. 1A, the ROX fluorescence intensity (at 605 nm) enhanced gradually when increasing the IFNγ concentration from 17.2 nM to 550.0 nM. The detection limit was approximately 10.0 nM (equal to 14.5 ng mL−1), which correlated well with previously reported results,20 indicating that the linkage of a cholesterol tail to the end of the aptamer sequence is not sterically hindering and as such has no negative impact on the sensing performance of the AP. Since the extracellular microenvironment of activated immune cells usually contains various cytokines, it was necessary to test the specificity of this CLAP. For all tested non-target cytokines, including a type I IFN (IFNα), we observed only very weak fluorescence signals which hardly exceeded background levels (Fig. 1B), verifying excellent detection selectivity of this aptamer probe.
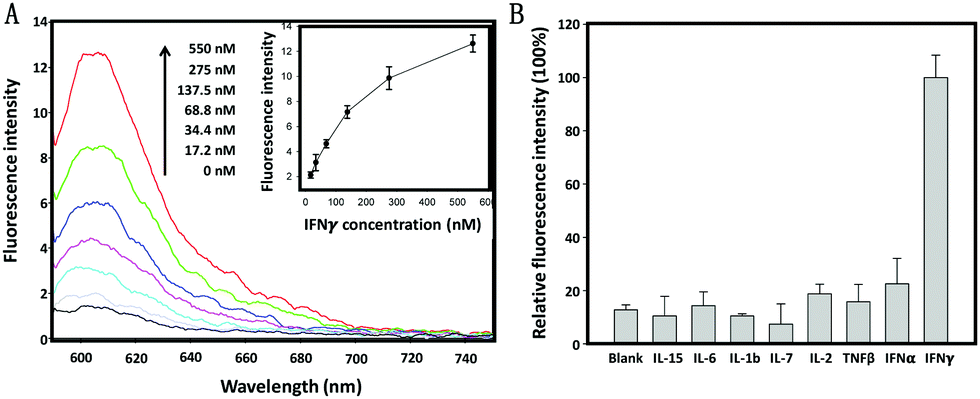 | ||
| Fig. 1 Fluorescence spectra of the aptamer probe (200 nM) with the addition of IFNγ at different concentrations; inset: plot of peak fluorescence intensity at 605 nm versus the IFNγ concentration. (B) Selectivity of the aptamer probe. The concentrations of IFNγ and other competing cytokines were all 400 nM. The fluorescence signal in response to IFNγ was defined as 100%, while those in response to other cytokines were calculated accordingly. Error bars represent the standard deviation of three independent experiments. | ||
Next, we evaluated the membrane anchor efficiency of the CLAP. Primary T cells isolated from human peripheral blood mononuclear cells (PBMCs) were used as a model cell type. In order to detect a fluorescence signal that indicates successful membrane anchoring of CLAP, a fully complementary DNA (termed as cDNA2) of the AP was added to separate the fluorophore and the quencher through the formation of a CLAP/cDNA hybrid. To optimize the membrane anchor process, the T cells were incubated with the CLAP/cDNA hybrid at different concentrations at room temperature (RT) for 10 min, washed and subsequently analysed by flow cytometry. As shown in Fig. 2A, a significant dose-dependent fluorescence increment was observed, and the fluorescence enhancement gradually plateaued after the probe concentration exceeded 0.5 μM. Next, we studied the incubation time of the cells with the CLAP/cDNA hybrid. The fluorescence signal reached saturation after 2.5 min, indicating an extremely efficient cell membrane anchor efficiency of CLAP (Fig. 2B). To guarantee consistent cell surface modification, a CLAP concentration of 1 μM and an incubation time of 10 min were used in all subsequent experiments. The surface density of the probe was measured using fluorescence spectrometry (data not shown), and a density of ∼0.62 × 10⁶ probes per cell was obtained corresponding to a cell surface coverage of 5.1% (the surface coverage was calculated by assuming a cell diameter of 7 μm and a DNA probe diameter of 2 nm). The cellular location of CLAP was visualized by confocal microscopy.
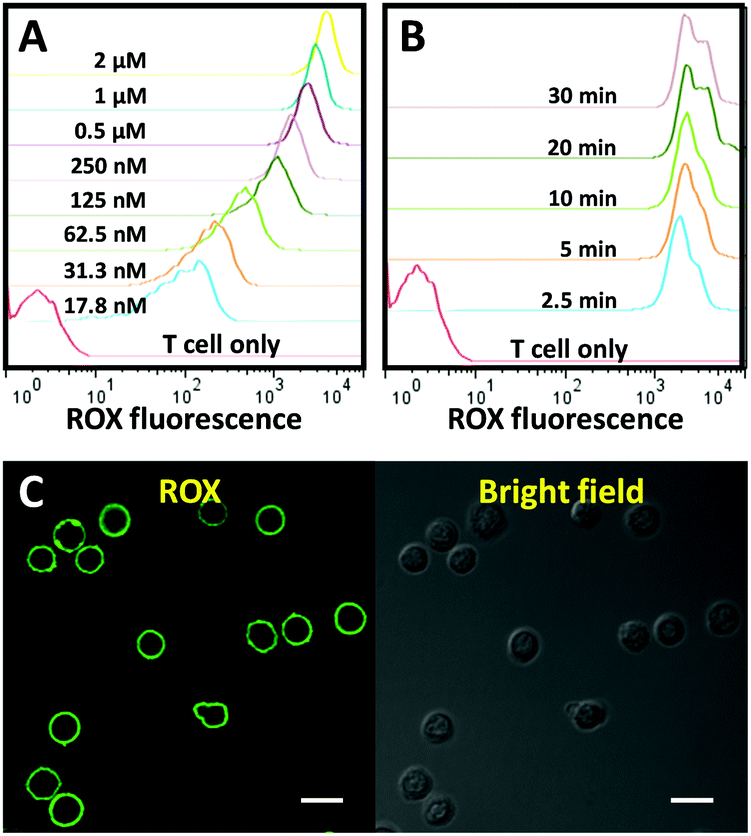 | ||
| Fig. 2 (A) Flow cytometry assay of T cells incubated with the CLAP/cDNA hybrid of different concentrations at RT for 10 min. (B) Flow cytometry assay of T cells after incubation with the CLAP/cDNA hybrid (1 μM) at RT for different time spans. (C) Confocal microscopy images of T cells after incubation with the CLAP/cDNA hybrid (1 μM) at RT for 10 min. Scale bar represents 10 μm. | ||
Fig. 2C shows a significant and uniform fluorescence signal on the cell membrane, providing additional proof for the successful fabrication and surface integration of the cell membrane-anchored aptamer probe.
Having successfully engineered a membrane-anchored AP, we proceeded to evaluate its ability to detect IFNγ in the extracellular microenvironment by confocal microscopy. For that purpose, non-activated T cells were decorated with CLAP and resuspended in the culture medium. After the addition of soluble recombinant IFNγ (600 nM), the membrane of T cells lighted up instantly, whereas little fluorescence was detected in the absence of IFNγ (Fig. 3A). To further confirm IFNγ-dependent fluorescence as measured by confocal microscopy, we exploited flow cytometry which allows high-throughput analysis of a large number of cells. A clear peak shift in the fluorescence intensity was observed in the presence of IFNγ, confirming that CLAP is a powerful and reliable molecular tool for the online detection of IFNγ (Fig. 3B).
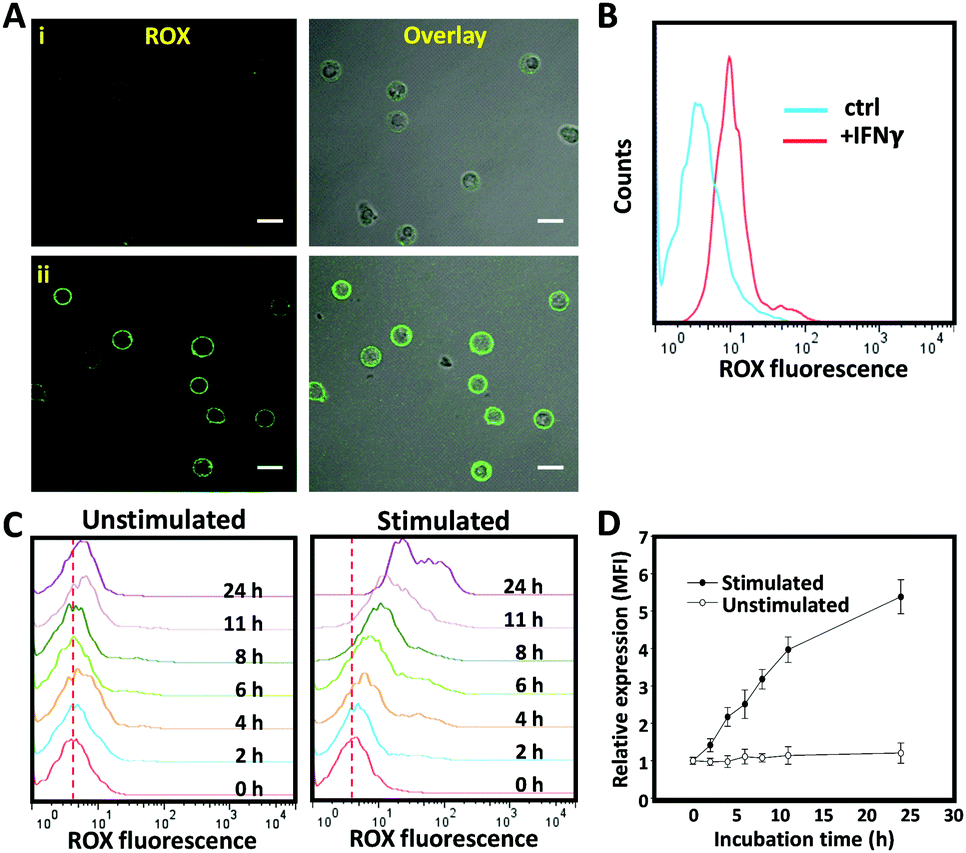 | ||
| Fig. 3 Potential of a T cell membrane-anchored biosensor for IFNγ detection. (A) Confocal microscopy images of T cells modified with the aptamer probe and then treated with 600 nM IFNγ (ii), or buffer only as a control (i). Scale bar represents 10 μm. (B) Flow cytometry assay of T cells modified with the aptamer probe after the addition of 600 nM IFNγ, or buffer only as a control. (C) Flow cytometry assay of aptamer decorated-T cells with (left) or without (right) stimulation of PMA/ionomycin for different time periods. (D) Corresponding kinetic flow cytometry assay of T cells stimulated with PMA/ionomycin at different time intervals. Error bars represent the standard deviation of three independent experiments. | ||
To challenge whether this cell membrane-anchored AP can be used to monitor IFNγ secretion, T cells were activated by phorbol myristate acetate (PMA, 0.05 μg mL−1) and ionomycin (1 μg mL−1) in order to stimulate cytokine secretion.22 The AP was anchored onto the T cell membrane, and the fluorescence intensity was measured using flow cytometry at different time points after stimulation. Strikingly, the fluorescence signal enhanced gradually upon immune stimulation (Fig. 3C). In contrast, negligible fluorescence changes were observed in the unstimulated (control) T cell samples. As confirmed by ELISA, T cells started to secret IFNγ two hours after stimulation and the secretion gradually increased when extending the stimulation time (Fig. S1, ESI†). The results obtained by the current cell membrane-anchored aptamer probe were comparable with those obtained by the commercial ELISA kit, indicating reliable analysis and performance of this aptamer-based sensing system (Fig. 3D). To control the spontaneous activation of the CLAP, we used an immortalized mouse dendritic cell, JAWS II, which was unable to secret human IFNγ (as demonstrated by ELISA, data not shown). As expected, no fluorescence change of the aptamer-decorated JAWS II cells was observed after stimulation (Fig. S2, ESI†). Together, these results demonstrate that the current cell membrane-anchored AP is able to specifically detect IFNγ secretion by activated T cells.
To test whether the developed AP would be suitable as a tool for the real-time monitoring of cytokine production by individually activated immune cells in droplets, we set up a single cell analysis platform based on droplet microfluidics. For this purpose, a microfluidic PDMS chip system composed of two aqueous-phase streams and one organic-phase stream was used. The two aqueous-phase streams separately delivered aptamer probe-anchored cells and immune stimuli, and were mixed prior to the droplet formation junction (Scheme 1). The organic-phase stream was connected directly to the droplet generator to form discrete water-in-oil droplets (Fig. S3, ESI†). To obtain the highest single-cell encapsulation efficiency, the starting cell concentration was optimized and strictly fixed at 2.6 × 10⁶ cells per mL.9 Under these conditions, approximately 15% of the droplets were loaded with only one cell, and the fraction loaded with more than one cell was less than 2%. Our previous work has demonstrated that these picolitre droplets provide a biocompatible environment and sufficient nutrients for cells to grow for more than 48 h.9 The cell-containing droplets were collected, placed on a glass slide and imaged using a fluorescence microscope. As shown in Fig. 4A, uniform and mono-disperse water-in-oil droplets were obtained; some of them encapsulated single cells (as indicated by the yellow arrow). Using a high-resolution confocal microscope (inset of Fig. 4A), we could show that the aptamer derived fluorescence signal was localized on the cell membrane, indicating the successful fabrication of a cell-surface sensor-based single cell analysis platform. To detect the cytokine secretion of individual cells, the collected droplets were incubated at 37 °C with 5% CO2 for 6 hours and then imaged by fluorescence microscopy. As shown in Fig. 4B, a stronger fluorescence signal was observed from the activated T cells, in comparison to that from the unstimulated T cells. As measured using the ImageJ software, the background-subtracted fluorescence intensity from the stimulated T cells was significantly higher than that from the unstimulated T cells (Fig. 4C). To further confirm these results, the encapsulated cells were collected by breaking the emulsion using perfluorooctanol (PFO) and then analysed by flow cytometry. In line with the microscopy results, a clear fluorescence peak shift was observed from the single stimulated T cells. Taken together, all these results demonstrate that the AP-based droplet-microfluidic assay, presented here, can be used to detect cytokine secretion at the single-cell level.
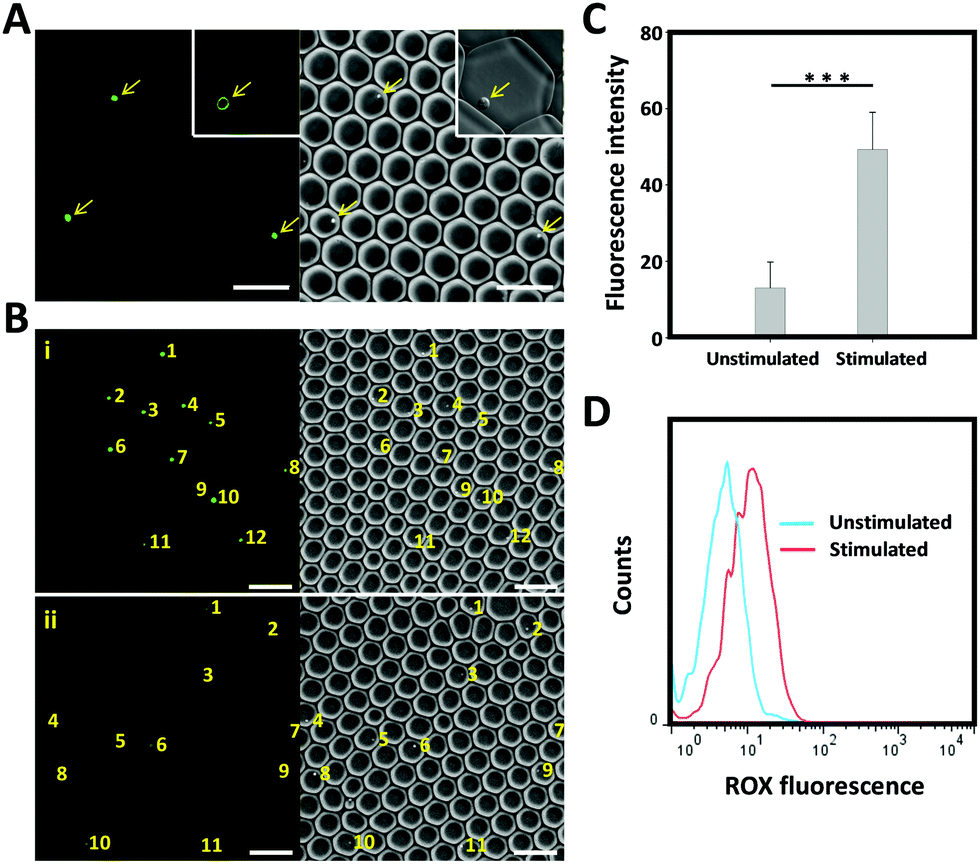 | ||
| Fig. 4 (A) Microscopy images of T cell modified with the CLAP/cDNA hybrid and then encapsulated in droplets. Arrows indicate the cells. Scale bar represents 100 μm. (B) Microscopy images of T cell modified with CLAP with (i) or without (ii) stimulation of PMA/ionomycin. The yellow numbers indicate the droplet-encapsulated single cells. (C) Background-subtracted fluorescence intensity of the droplet-encapsulated, aptamer probe-decorated T cells with or without PMA/ionomycin stimulation. (D) Flow cytometry assay of the droplet-encapsulated, aptamer probe-decorated T cells with or without PMA/ionomycin stimulation. | ||
In summary, by exploiting an aptamer as a detection unit, we developed a cell membrane-anchored sensor for detecting cytokine secretion by human immune cells in the extracellular microenvironment. Moreover, in combination with a droplet-based microfluidic system, we have successfully encapsulated single AP-decorated T cells into picoliter droplets. Taking advantage of the simple operation, high throughput, high spatiotemporal resolution and a “signal on” mechanism, this droplet-based aptamer sensing platform was able to detect cytokine secretion at the single-cell level, positioning it as a powerful addition to the armamentarium for studying immune response at the single-cell level.
We sincerely thank Dr Martijn Verdoes for useful discussions in this work, and Prof. Dr Wilhelm Huck and the physical organic chemistry group at the Institute for Molecules and Materials at Radboud University for access to their droplet-based microfluidics infrastructure. This work was supported by the National Key Scientific Program of China (Grants 21505039), a Radboudumc PhD grant and Institute of Chemical Immunology grant 024.002.009. JT is supported by the Netherlands Organization for Scientific Research (NWO) Veni Grant 863.13.024. CF is recipient of the NWO Spinoza award, ERC advanced grant PATHFINDER (269019) and KWO grant 2009-4402 of the Dutch Cancer Society.
Notes and references
- R. Satija and A. K. Shalek, Trends Immunol., 2014, 35, 219–229 CrossRef CAS PubMed.
- V. Almendro, A. Marusyk and K. Polyak, Annu. Rev. Pathol.: Mech. Dis., 2013, 8, 277–302 CrossRef CAS PubMed.
- S. Tay, J. J. Hughey, T. K. Lee, T. Lipniacki, S. R. Quake and M. W. Covert, Nature, 2010, 466, 267–271 CrossRef CAS PubMed.
- A. K. Shalek, R. Satija, X. Adiconis, R. S. Gertner, J. T. Gaublomme, R. Raychowdhury, S. Schwartz, N. Yosef, C. Malboeuf and D. Lu, Nature, 2013, 498, 236–240 CrossRef CAS PubMed.
- P. K. Chattopadhyay, T. M. Gierahn, M. Roederer and J. C. Love, Nat. Immunol., 2014, 15, 128–135 CrossRef CAS PubMed.
- D. Wang and S. Bodovitz, Trends Biotechnol., 2010, 28, 281–290 CrossRef CAS PubMed.
- A. Schmid, H. Kortmann, P. S. Dittrich and L. M. Blank, Curr. Opin. Biotechnol., 2010, 21, 12–20 CrossRef CAS PubMed.
- H. Yin and D. Marshall, Curr. Opin. Biotechnol., 2012, 23, 110–119 CrossRef CAS PubMed.
- V. Chokkalingam, J. Tel, F. Wimmers, X. Liu, S. Semenov, J. Thiele, C. G. Figdor and W. T. Huck, Lab Chip, 2013, 13, 4740–4744 RSC.
- A. R. Wheeler, W. R. Throndset, R. J. Whelan, A. M. Leach, R. N. Zare, Y. H. Liao, K. Farrell, I. D. Manger and A. Daridon, Electrophoresis, 2001, 22, 283–288 CrossRef.
- G. J. Nossal, Br. J. Exp. Pathol., 1958, 39, 544 CAS.
- C. Tuerk and L. Gold, Science, 1990, 249, 505–510 CAS.
- A. D. Ellington and J. W. Szostak, Nature, 1990, 346, 818 CrossRef CAS PubMed.
- S. Song, L. Wang, J. Li, C. Fan and J. Zhao, TrAC, Trends Anal. Chem., 2008, 27, 108–117 CrossRef CAS.
- W. Tan, M. J. Donovan and J. Jiang, Chem. Rev., 2013, 113, 2842–2862 CrossRef CAS PubMed.
- Q. Han, N. Bagheri, E. M. Bradshaw, D. A. Hafler, D. A. Lauffenburger and J. C. Love, Proc. Natl. Acad. Sci. U. S. A., 2012, 109, 1607–1612 CrossRef CAS PubMed.
- M. M. Ali, D. K. Kang, K. Tsang, M. Fu, J. M. Karp and W. Zhao, Wiley Interdiscip. Rev.: Nanomed. Nanobiotechnol., 2012, 4, 547–561 CrossRef CAS PubMed.
- L. Qiu, T. Zhang, J. Jiang, C. Wu, G. Zhu, M. You, X. Chen, L. Zhang, C. Cui and R. Yu, J. Am. Chem. Soc., 2014, 136, 13090 CrossRef CAS PubMed.
- M. A. Farrar and R. D. Schreiber, Annu. Rev. Immunol., 1993, 11, 571–611 CrossRef CAS PubMed.
- N. Tuleuova, C. N. Jones, J. Yan, E. Ramanculov, Y. Yokobayashi and A. Revzin, Anal. Chem., 2010, 82, 1851–1857 CrossRef CAS PubMed.
- M. You, Y. Lyu, D. Han, L. Qiu, Q. Liu, T. Chen, C. S. Wu, L. Peng, L. Zhang and G. Bao, Nat. Nanotechnol., 2017, 12, 453–459 CrossRef CAS PubMed.
- R. Sha'Afi, J. White, T. Molski, J. Shefcyk, M. Volpi, P. Naccache and M. Feinstein, Biochem. Biophys. Res. Commun., 1983, 114, 638–645 CrossRef.
Footnotes |
| † Electronic supplementary information (ESI) available. See DOI: 10.1039/c7cc03576d |
| ‡ Corresponding authors share senior authorship. |
| This journal is © The Royal Society of Chemistry 2017 |