
 Open Access Article
 This Open Access Article is licensed under a
 Creative Commons Attribution 3.0 Unported Licence
Precursor determined lateral size control of monolayer MoS2 nanosheets from a series of alkylammonium thiomolybdates: a reversal of trend between growth media†
J. R.
Brent‡
a,
P. D.
McNaughter‡
 b and
P.
O'Brien
*ab
b and
P.
O'Brien
*ab
aSchool of Materials, The University of Manchester, Oxford Road, Manchester, M13 9PL, UK. E-mail: paul.o'brien@manchester.ac.uk
bSchool of Chemistry, The University of Manchester, Oxford Road, Manchester, M13 9PL, UK
First published on 18th May 2017
Abstract
The growth of ligand-free MoS2 nanosheets with mean lateral sizes below 5 nm at 270 °C is reported. Nanosheets grown from a melt of tetraalkylammonium tetrathiomolybdates, [R4N]2[MoS4] (R = n-butyl, n-hexyl or n-octyl) vary in width between mean lateral sizes of 4.35 and 2.1 nm. Inclusion of the precursors into a polymer matrix shows the opposite trend in lateral dimensions with sheet widths ranging from 3.5 to 4.8 nm.
Control over the lateral dimensions and degree of stacking is a significant challenge in the production of two dimensional materials. The synthesis of high edge to face ratio material, i.e. sheets with small lateral dimensions, is of interest for use in catalysis due to the higher proportion of reactive edge sites. We have investigated the use of tetraalkylammonium thiomolybdates for the “bottom-up” synthesis of ligand-free monolayer MoS2 nanosheets by decomposition within a melt and a polymer.
A wealth of “top-down” routes to layered transition metal dichalcogenide nanosheets exploit the relative weakness of interlayer van der Waals forces, allowing isolation by cleavage along the basal plane by a range of exfoliation methods.1–6 Top-down approaches are synthetically simple but offer limited opportunity for scaling upwards and little reproducible control over thickness, lateral dimensions and size dispersity. “Bottom-up” syntheses have demonstrated greater monodispersity in both the lateral and vertical dimensions than exfoliation.7–10 The most investigated bottom-up techniques use gas-phase chemical or physical vapor deposition;11 with solution-based techniques being less explored.12
Ammonium tetrathiomolybdate, [NH4]2[MoS4], has received some attention as a precursor for MoS2 but its poor solubility in organic solvents limits processing options.12 Lin et al. have recently made spherical MoS2 nanoparticles 4.5 nm and larger from [NH4]2[MoS4], however size control relies on insulating, organic capping ligands which may hinder catalytic performance.13 Tetraalkylammonium tetrathiomolybdates, [R4N]2[MoS4], offer improved solubility in organic solvents with increasing alkyl chain length allowing compatibility with solution processing techniques which is not possible with the water soluble [NH4]2[MoS4].14
Thermolysis of precursor melts is a potentially scalable route to nanomaterials.15 Viable compounds have volatile byproducts, often resulting in ligand free nanomaterials. Polymers such as polystyrene and the semiconducting poly(3-hexylthiophene-2,5-diyl) (P3HT) have been shown to be effective as an medium for the in situ growth of nanocrystals.16–19 Recently nanocrystal size control within polystyrene was achieved by variation of the chain length of the lead(II) xanthate decomposed.20 The in situ growth of MoS2 is potentially a route to hybrid photovoltaic devices that avoids the harsh conditions of gas phase syntheses and also provides intimate contact between the ligand free MoS2 and the polymer.
In this work, size controlled, sub-10 nm monolayer, MoS2 nanosheets were synthesized by the decomposition of [R4N]2[MoS4] (R = n-butyl, n-hexyl or n-octyl), both in a melt reaction and within polystyrene, Scheme 1. The ability to tune the lateral size of the MoS2 sheets by modifying the alkyl chain length of the alkylammonium counter ion is demonstrated.
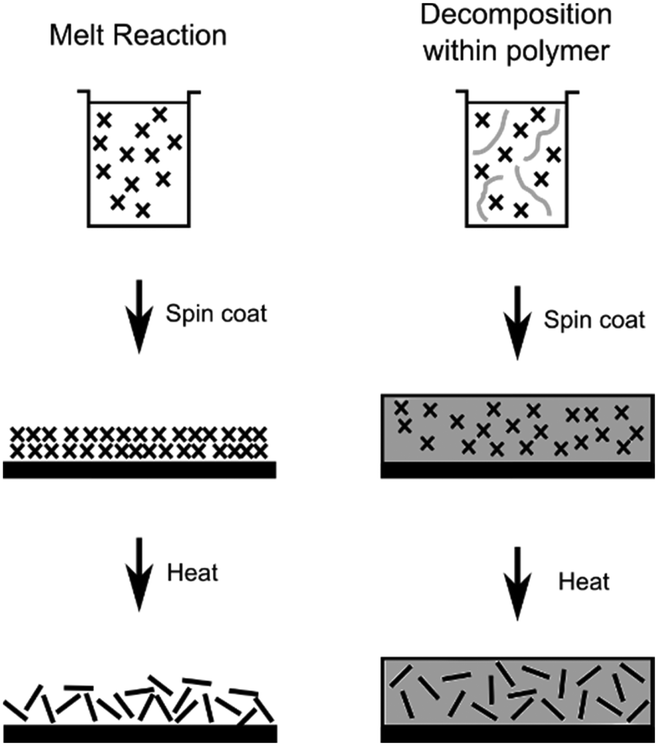 | ||
| Scheme 1 The two routes used for formation of MoS2 nanosheets from [R4N]2[MoS4] (crosses) with (left) the decomposition from a melt of precursor and (right) decomposition within polystyrene. | ||
The salts [R4N]2[MoS4] (R = Bu, Hex and Oct) are soluble in chloroform and dichloromethane which are compatible with polymers used for solution processing. Thermogravimetric analysis (TGA) showed the onset of decomposition occurs above 60 °C and the final decomposition step begins below 200 °C for all compounds, Fig. S1 (ESI†), allowing processing below the decomposition temperature of polystyrene (300 °C).20
In a typical reaction polystyrene was dissolved in dichloromethane at 52 mg ml−1 (0.5 mmol ml−1 monomer concentration) and added to a solution of precursor [R4N]2[MoS4] (R = butyl, hexyl or octyl) to give a 5![[thin space (1/6-em)]](https://www.rsc.org/images/entities/char_2009.gif) :1 styrene:precursor molar ratio. 200 μl of each solution was spin-coated at 2000 rpm. onto glass substrates (15 × 20 mm) to produce precursor–polymer films. The films were heated under N2 from r.t. to 270 °C at 10 °C min−1 and were held at 270 °C for 20 min before being cooled to room temperature. The melt reactions followed the same procedure except polystyrene was not used. Further experimental details can be found in the ESI.†
:1 styrene:precursor molar ratio. 200 μl of each solution was spin-coated at 2000 rpm. onto glass substrates (15 × 20 mm) to produce precursor–polymer films. The films were heated under N2 from r.t. to 270 °C at 10 °C min−1 and were held at 270 °C for 20 min before being cooled to room temperature. The melt reactions followed the same procedure except polystyrene was not used. Further experimental details can be found in the ESI.†
The transmission electron microscope (TEM) micrographs of exfoliated nanosheet films show micron-scale flocculates, caused by the TEM sample preparation in N-methyl-2-pyrrolidone or dichloromethane for melt and polymer reaction produced films respectively (see ESI† for further details), containing thousands of randomly orientated and predominately monolayer MoS2 nanosheets, Fig. 1 and 2. Size measurements assume the sheets are heavily truncated and are pseudo circular, just as PbS QDs are pseudo spherical and not cubes beneath a certain size. If the sheets are rectangular, the lateral measurements still have meaning as described in the ESI.†
 | ||
| Fig. 1 TEM images and corresponding sheet size histograms from the decomposition of precursor melts of [R4N]2[MoS4] (R = Bu (top), Hex (middle) and Oct (bottom)). | ||
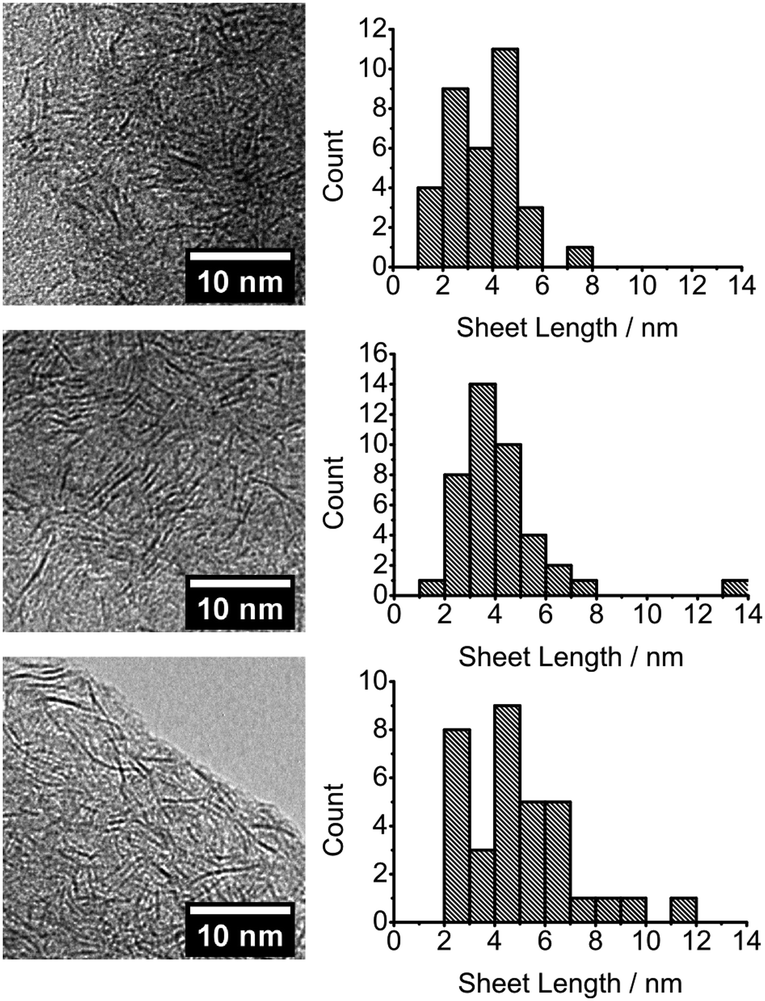 | ||
| Fig. 2 TEM images and corresponding sheet size histograms from the decomposition within a polystyrene of [R4N]2[MoS4] where R = Bu (top), Hex (middle) and Oct (bottom). | ||
The films formed from reactive melts show an inverse relationship between the length of precursor alkyl chain and the nanosheet lateral size, Fig. 1, with the mean lateral size decreasing from 4.4 nm (butyl), to 4.0 nm (hexyl) and 2.2 nm (octyl). A cut-off in the size distribution of particles <1 nm in length is evident for the octyl precursor, Fig. 1. Overall, there is reduction in mean nanosheet width by approx. 50% between butyl and octyl melts and an average decrease of 1.1 nm for every CH2 added to the precursor. The products from the octyl compound have a mean diameter of 6–7 Mo–Mo interatomic distances and for the butyl analogue, 12–13 Mo–Mo separations.21
When decomposition is performed within polystyrene, a reversal in the dependence of nanosheet lateral size on alkyl chain length is observed, Fig. 2. An increase in mean nanosheet length of 0.7 nm for every CH2 added to the precursor is observed from a mean diameter of 3.5 nm (butyl) to 4.8 nm (octyl) which is approximately 11 and 15 Mo–Mo separations respectively. An increase in monodispersity for nanosheets grown within the polystyrene matrix is seen when compared to films from reactive melts. The differences in sizes between the melt and within polystyrene are compared in Fig. 3.
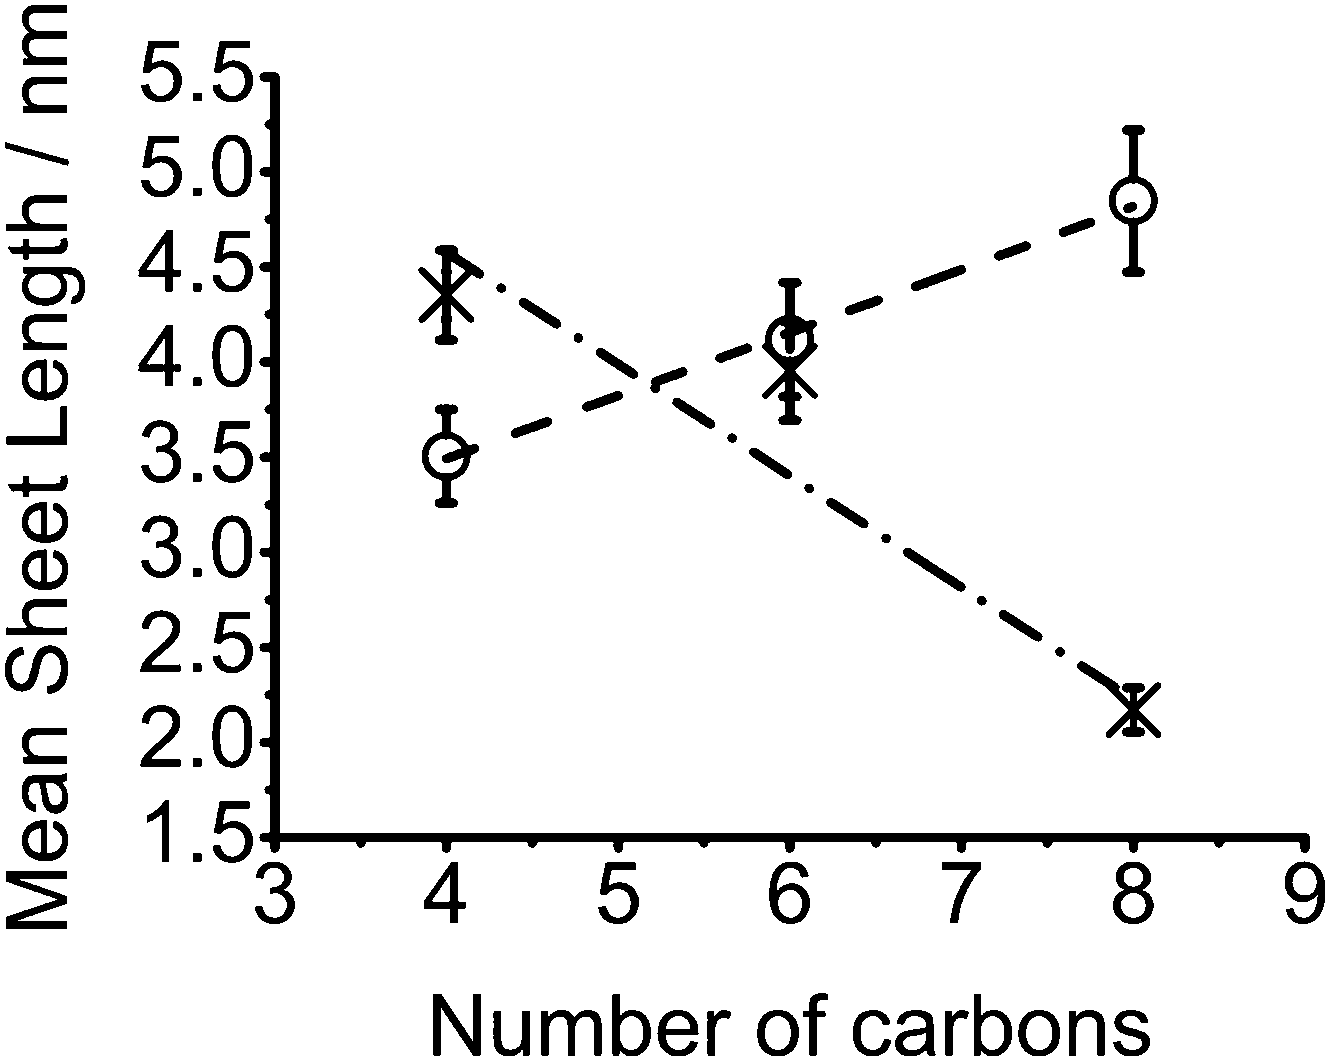 | ||
| Fig. 3 Mean MoS2 lateral sheet width in films from melt reactions (crosses) and polymer films (circles) against number of carbons in [R4N]2[MoS4] alkyl chains. | ||
Raman spectroscopy was used to confirm the presence of MoS2 in all of the films. A temperature of at least 270 °C is required to form crystalline MoS2 from [Bu4N]2[MoS4] as indicated by the emergence of clearly defined bands at ∼381 cm−1 (E12g) and ∼407 cm−1 (A1g), Fig. 4. Decomposition of all three compounds both in a melt and in polystyrene were found to give films with well-defined Raman modes Fig. S2 and S3 (ESI†). The in-plane and out-of-plane Raman modes are known to converge with decreasing number of MoS2 layers and the measured band separations are consistent with the formation of monolayer MoS2.22 The A1g band displays no variation in position with regard to precursor. The E21g band displays very minor softening with increasing precursor molecular weight, decreasing from 381 cm−1 from compound [Bu4N]2[MoS4] to 380 cm−1 and 378 cm−1 in samples prepared from [Hex4N]2[MoS4] and [Oct4N]2[MoS4] respectively. Such changes are indicative of decreasing lateral dimensions.23 No other modes were present in the 200 to 900 cm−1 range, indicating little or no formation of molybdenum oxides.24 The Raman spectra of hybrid films showed weaker Raman bands, due to reduced MoS2 content and the influence of the polystyrene filler, Fig. S3 (ESI†).
 | ||
| Fig. 4 Raman spectra and selected area electron diffraction patterns for the sheets formed from the decomposition [Bu4N]2[MoS4] at 270 °C in (a) a melt reaction and (b) within polystyrene. | ||
The small size of the nanosheets and the strong broad signal from amorphous polystyrene meant that the powder X-ray diffraction showed no obvious reflections for MoS2, Fig. S4 (ESI†). Selected area electron diffraction (SAED) patterns showed all samples to be polycrystalline with reflections that can be assigned to that of the MoS2 (100), (106) and (211) (ICCD 00-024-0513). The (002) reflection was absent in all cases, which suggests the nanosheets exist as monolayers, Fig. 4 and Fig. S5 (ESI†). The SAED patterns support the finding of the TEM size analysis, with the butyl melt and octyl in polymer reactions displaying fewer and more diffuse rings as compared to chain lengths that result in longer sheets.
UV-Vis spectra of unreacted films show two absorption bands at 472 nm and 392 nm which we assign to S–Mo charge transfer within the thiomolybdate ion, Fig. S6 (ESI†).25 These bands are absent in reacted films; indicating complete thermolysis of the precursor.
Scanning electron microscope (SEM) images of the MoS2-polymer films showed elliptical structures tens of micrometers in diameter Fig. 5. Both molybdenum and carbon are widely distributed in the films as evidenced by EDX mapping. However, carbon is more prevalent between the elliptical structures and molybdenum lies predominantly at the edges of the ellipses. Micrographs of unreacted films show a similar structure, Fig. S7b–d (ESI†), implying the segregation of the organic and inorganic components does not occur during MoS2 formation and the precursor–polymer mixture may exist as an emulsion prior to spin coating. This is further supported by the influence of precursor hydrophobicity on droplet size, Fig. S8 (ESI†). To investigate the elliptical structures further the surface profile of the reacted films was obtained, Fig. S9 (ESI†), finding that the elliptical domains were hollow and the film thickness within a domain was at most 7% of the film between domains, Table S2 (ESI†). The change in film thickness agrees with the variation in Mo and C signals by EDX mapping. The thickness of the films was found to decrease with increasing precursor alkyl chain length and the decrease in size of ellipse size agreed with SEM, Fig. S10 and S11 (ESI†). We hypothesize that the precursor solubility in polystyrene may influence the nucleation and growth of the MoS2 sheets. SEM micrographs of melt films are largely featureless, Fig. S12 (ESI†).
 | ||
| Fig. 5 Secondary electron images of (a) butyl (b) hexyl and (c) octyl derivatives of [R4N]2[MoS4] decomposed in polymer with accompanying EDX maps for (middle) carbon and (right) molybdenum. | ||
The size trend observed in the melt reactions can be rationalized with the increasing tetraalkylammonium cation volume increasing causing an effective lowering of the tetrathiomolybdate concentration. The reversal in the trend in when decomposition is performed in polystyrene is complex due to the partitioning observed and interactions with the polymer at various stages of growth. The domain size of the elliptical structures decreases with increasing alkyl chain length, Fig. S9 (ESI†). This is expected to be due to the increased solubility of the tetrathiomolybdate precursor in polystyrene and may be linked to the linear relationship in lateral size observed when decomposed in polymer.
We have demonstrated the synthesis of ligand-free, monolayer MoS2 nanosheets with lateral size control below 10 nm. This control is affected by the nature of the tetra-alkyl substituent in the ammonium counter ion, (R = n-butyl, n-hexyl or n-octyl) and the medium used for growth. Lateral dimensions in a melt reaction decrease from 4.4 to 2.2 nm with increasing chain length. An opposite trend is observed in polymer, with the nanosheets increasing in size from 3.5 to 4.8 nm. This work allows control over the proportion of reactive edge sites for catalysis by tuning the surface to edge ratio of the sheets.
POB and PDM acknowledge funding from EPSRC UK grants # EP/K010298/1 and EP/K039547/1.
Notes and references
- K. S. Novoselov, A. K. Geim, S. V. Morozov, D. Jiang, Y. Zhang, S. V. Dubonos, I. V. Grigorieva and A. A. Firsov, Science, 2004, 306, 666–669 CrossRef CAS PubMed.
- K. S. Novoselov, D. Jiang, F. Schedin, T. J. Booth, V. V. Khotkevich, S. V. Morozov and A. K. Geim, Proc. Natl. Acad. Sci. U. S. A., 2005, 102, 10451–10453 CrossRef CAS PubMed.
- A. Castellanos-Gomez, N. Agraït and G. Rubio-Bollinger, Appl. Phys. Lett., 2010, 96, 213116 CrossRef.
- A. Castellanos-Gomez, E. Navarro-Moratalla, G. Mokry, J. Quereda, E. Pinilla-Cienfuegos, N. Agraït, H. S. J. van der Zant, E. Coronado, G. A. Steele and G. Rubio-Bollinger, Nano Res., 2013, 6, 191–199 CrossRef CAS.
- C. Backes, R. J. Smith, N. McEvoy, N. C. Berner, D. McCloskey, H. C. Nerl, A. O’Neill, P. J. King, T. Higgins, D. Hanlon, N. Scheuschner, J. Maultzsch, L. Houben, G. S. Duesberg, J. F. Donegan, V. Nicolosi and J. N. Coleman, Nat. Commun., 2014, 5, 4576 CAS.
- T. Fujita, Y. Ito, Y. Tan, H. Yamaguchi, D. Hojo, A. Hirata, D. Voiry, M. Chhowalla and M. Chen, Nanoscale, 2014, 6, 12458–12462 RSC.
- Q. Feng, Y. Zhu, J. Hong, M. Zhang, W. Duan, N. Mao, J. Wu, H. Xu, F. Dong, F. Lin, C. Jin, C. Wang, J. Zhang and L. Xie, Adv. Mater., 2014, 26, 2763 CrossRef.
- Y. Jung, J. Shen, Y. Liu, J. M. Woods, Y. Sun and J. J. Cha, Nano Lett., 2014, 14, 6842–6849 CrossRef CAS PubMed.
- K.-C. Chiu, X.-Q. Zhang, X. Liu, V. M. Menon, Y.-F. Chen, J.-M. Wu and Y.-H. Lee, IEEE J. Quantum Electron., 2015, 51, 1–10 CrossRef.
- Y. Huang, J. Guo, Y. Kang, Y. Ai and C. M. Li, Nanoscale, 2015, 7, 19358–19376 RSC.
- M. Bosi, RSC Adv., 2015, 5, 75500–75518 RSC.
- K.-K. Liu, W. Zhang, Y.-H. Lee, Y.-C. Lin, M.-T. Chang, C.-Y. Su, C.-S. Chang, H. Li, Y. Shi, H. Zhang, C.-S. Lai and L.-J. Li, Nano Lett., 2012, 12, 1538–1544 CrossRef CAS PubMed.
- H. Lin, C. Wang, J. Wu, Z. Xu, Y. Huang and C. Zhang, New J. Chem., 2015, 39, 8492–8497 RSC.
- M. Poisot, C. Näther and W. Bensch, Z. Naturforsch., B: Chem. Sci., 2014, 62, 209–214 Search PubMed.
- E. Lewis, S. Haigh and P. O’Brien, J. Mater. Chem. A, 2013, 2, 570–580 Search PubMed.
- T. Rath and G. Trimmel, Hybrid Mater., 2014, 1, 2299–3940 Search PubMed.
- A. J. MacLachlan, T. Rath, U. B. Cappel, S. A. Dowland, H. Amenitsch, A.-C. Knall, C. Buchmaier, G. Trimmel, J. Nelson and S. A. Haque, Adv. Funct. Mater., 2015, 25, 409–420 CrossRef CAS PubMed.
- S. Dowland, T. Lutz, A. Ward, S. P. King, A. Sudlow, M. S. Hill, K. C. Molloy and S. A. Haque, Adv. Mater., 2011, 23, 2739–2744 CrossRef CAS PubMed.
- C. Fradler, T. Rath, S. Dunst, I. Letofsky-Papst, R. Saf, B. Kunert, F. Hofer, R. Resel and G. Trimmel, Sol. Energy Mater. Sol. Cells, 2014, 124, 117–125 CrossRef CAS.
- E. A. Lewis, P. D. McNaughter, Z. Yin, Y. Chen, J. R. Brent, S. A. Saah, J. Raftery, J. A. M. Awudza, M. A. Malik, P. O'Brien and S. J. Haigh, Chem. Mater., 2015, 27, 2127–2136 CrossRef CAS.
- X. Chen, Z. Chen and J. Li, Chin. Sci. Bull., 2013, 58, 1632–1641 CrossRef CAS.
- H. Li, Q. Zhang, C. C. R. Yap, B. K. Tay, T. H. T. Edwin, A. Olivier and D. Baillargeat, Adv. Funct. Mater., 2012, 22, 1385–1390 CrossRef CAS.
- G. L. Frey, R. Tenne, M. J. Matthews, M. S. Dresselhaus and G. Dresselhaus, Phys. Rev. B: Condens. Matter Mater. Phys., 1999, 60, 2883–2892 CrossRef CAS.
- M. Dieterle and G. Mestl, Phys. Chem. Chem. Phys., 2002, 4, 822–826 RSC.
- S. Pokhrel, K. S. Nagaraja and B. Varghese, J. Struct. Chem., 2003, 44, 689–694 CrossRef CAS.
Footnotes |
| † Electronic supplementary information (ESI) available. See DOI: 10.1039/c7cc01641g |
| ‡ Authors contributed equally. |
| This journal is © The Royal Society of Chemistry 2017 |