
 Open Access Article
 This Open Access Article is licensed under a
 Creative Commons Attribution 3.0 Unported Licence
Acid deprotonation driven by cation migration at biased graphene nanoflake electrodes†
M. M.
Lounasvuori
and
K. B.
Holt
 *
*
Department of Chemistry, University College London, 20, Gordon St., London, WC1H 0AJ, UK. E-mail: k.b.holt@ucl.ac.uk
First published on 31st January 2017
Abstract
In situ IR spectroscopy is used to monitor electrolyte composition and acid protonation state at the interface of graphene nanoflake electrodes. Deprotonation of both electrode-immobilised and solution acids is driven by a local increase in cation activity at the electrode surface on application of a negative electrode potential.
Degree of acid dissociation (pKa) is a function of solution composition1–3 and identity of neighbouring charged species.4,5 For example, it is common for acid groups within enzymes to have pKa values that vary as a function of local charge in the active site.4 Carboxylic acid terminated SAMs have pKa values differing by several units from the solution species and values are highly dependent on interactions between neighbouring groups.5 Solution composition profoundly alters the pKa of Langmuir monolayers of NH2-terminated lipids at the air–water interface, with pKa strongly dependent on the ionic strength of the water phase, ranging from 5.1 to 10.5 as the ionic strength increased from 0 to 0.1.1 Protonation states of electrode-immobilized acids are also found to vary with applied potential.2,3,6,7 Some studies find that acid association takes place on application of a negative potential and have proposed that protonation is driven by the applied electric field.6,7 This electrochemically driven reversible acid protonation reaction has been exploited to fabricate a fast charge–discharge supercapacitor from 3,4,9,10-perylene tetracarboxylic acid adsorbed on graphene layers.8 Conversely, other studies have found that deprotonation takes place when a negative potential is applied and is driven by a local increase in cation activity at the electrode interface that lowers the effective pKa of the acid groups.2,3 pKa is defined in terms of acid dissociation but neglects the effect of concomitant interaction of the conjugate base with solution cations. The resulting apparent pKa (pKa(app)) can be shown2 (S1, ESI†) to depend on monovalent cation activity aM+ and Kas, the equilibrium constant for the association between conjugate base and solution cations, as shown in eqn (1):
| pKa(app) = pKa + pKas − log(aM+) | (1) |
Here we show, using in situ infra-red (IR) spectroelectrochemistry, that a negative electrode potential results in deprotonation of graphene electrode carboxylic acid edge groups. We also observe deprotonation of solution H3PO4, H2PO4− and HSO4− close to the electrode on application of −0.5 V. We attribute both findings to a decrease in the apparent pKa(app) of the acids, in response to a local increase in cation activity at the electrode at negative potential. This observation is important as it implies that speciation of acids near a biased electrode surface can differ significantly from bulk solution and this can be driven purely by cation migration in the absence of adsorption, redox chemistry or pH change.
Graphene nanoflakes (GNF) are ca. 30 nm diameter flakes of graphene with a high density of carboxylic acid edge groups (Fig. 1a and Fig. S3, ESI†).11 GNF are highly soluble in water, but addition of Ca2+ results in formation of an insoluble precipitate (GNF-Ca) through complexation of Ca2+ between –COO− groups of neighbouring flakes. IR spectroscopy shows about 20–50% of the acid groups remain non-complexed (Fig. S3 and Fig. S17, ESI†). A high surface area electrode was constructed by drop-coating GNF-Ca onto a boron-doped diamond (BDD) electrode (S2, ESI†). This modified electrode was located above the diamond internal reflectance element of an attenuated total reflectance (ATR) IR spectrometer (Fig. 1b). The distance between the unmodified BDD electrode and prism was determined as ca. 17 μm (S4, ESI†). On immersion in electrolyte the GNF-Ca layer swells (S14, ESI†), thus the GNF-Ca layer is in direct contact with both prism and electrode. Penetration depth of the IR evanescent wave is <2 μm (S5, ESI†) hence only the region of GNF-Ca layer furthest from the BDD surface is probed. The high surface area conductive GNF-Ca electrode allows measurement of potential-induced changes in protonation state of the non-complexed acid edge groups of the GNF-Ca, simultaneously with changes in speciation in the solution at the electrode surface, using in situ IR spectroscopy. Potentials of +1.0 V and −0.5 V were used, being the limits of electrolyte stability (S9 and S15, ESI†). All spectra reported are difference spectra. The GNF-Ca layer is intact at the end of experiments, indicating that bound Ca2+ is not perturbed by potential, as migration of Ca2+ would result in loss of the layer due to solubility of the non-complexed GNF.
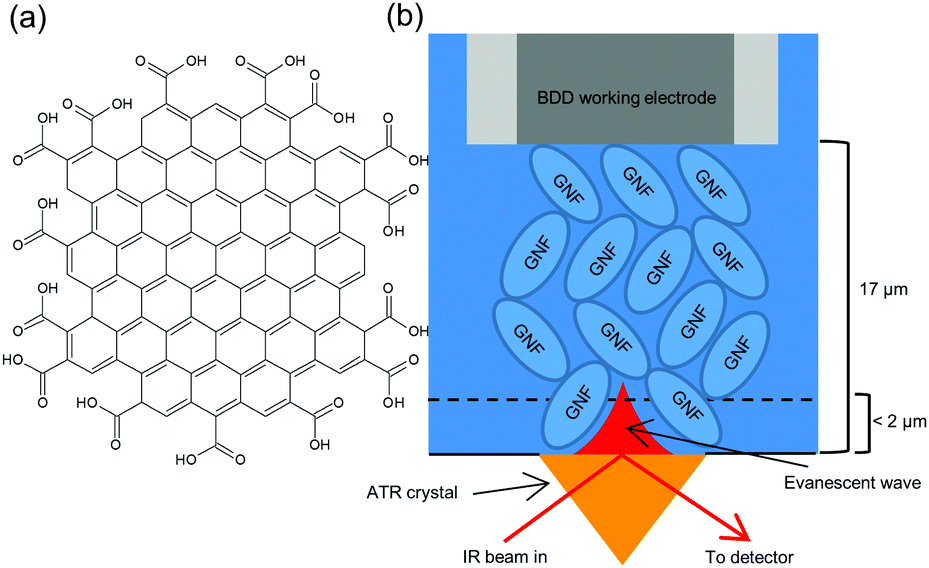 | ||
| Fig. 1 (a) Cartoon (not to scale) of carboxylic acid edged graphene nanoflake (GNF) used for high surface area electrode; (b) schematic of interfacial region of modified electrode used for in situ IR spectroelectrochemistry. | ||
In 0.1 M NaCl at pH 7 initial application of +1.0 V results in little change in the spectrum relative to a background spectrum recorded without potential (S7, ESI†); however, subsequent application of −0.5 V (Fig. 2, blue) results in decrease in absorbance (losses) at 1755 cm−1 and 1635 cm−1 corresponding to the acid carbonyl (C![[double bond, length as m-dash]](https://www.rsc.org/images/entities/char_e001.gif) O) stretch and a water bending mode respectively.12 Concomitant increases in absorption (gains) are noted at 1570 cm−1 for the carboxylate asymmetric stretch and 1430 cm−1 and 1340 cm−1 for the carboxylate symmetric stretch. The presence of two bands for the symmetric carboxylate stretch is predicted computationally when carboxylate groups occupy different environments within a molecule.13 Using the +0.5 V spectrum as a background before applying +1.0 V results in a mirror image spectral response (Fig. 2, orange); loss of carboxylate stretches at 1570 cm−1, 1430 cm−1 and 1340 cm−1 and gain of the CO band and water mode at 1755 cm−1 and 1635 cm−1. Clearly a negative electrode potential induces deprotonation of acids and positive potential results in their re-protonation.
O) stretch and a water bending mode respectively.12 Concomitant increases in absorption (gains) are noted at 1570 cm−1 for the carboxylate asymmetric stretch and 1430 cm−1 and 1340 cm−1 for the carboxylate symmetric stretch. The presence of two bands for the symmetric carboxylate stretch is predicted computationally when carboxylate groups occupy different environments within a molecule.13 Using the +0.5 V spectrum as a background before applying +1.0 V results in a mirror image spectral response (Fig. 2, orange); loss of carboxylate stretches at 1570 cm−1, 1430 cm−1 and 1340 cm−1 and gain of the CO band and water mode at 1755 cm−1 and 1635 cm−1. Clearly a negative electrode potential induces deprotonation of acids and positive potential results in their re-protonation.
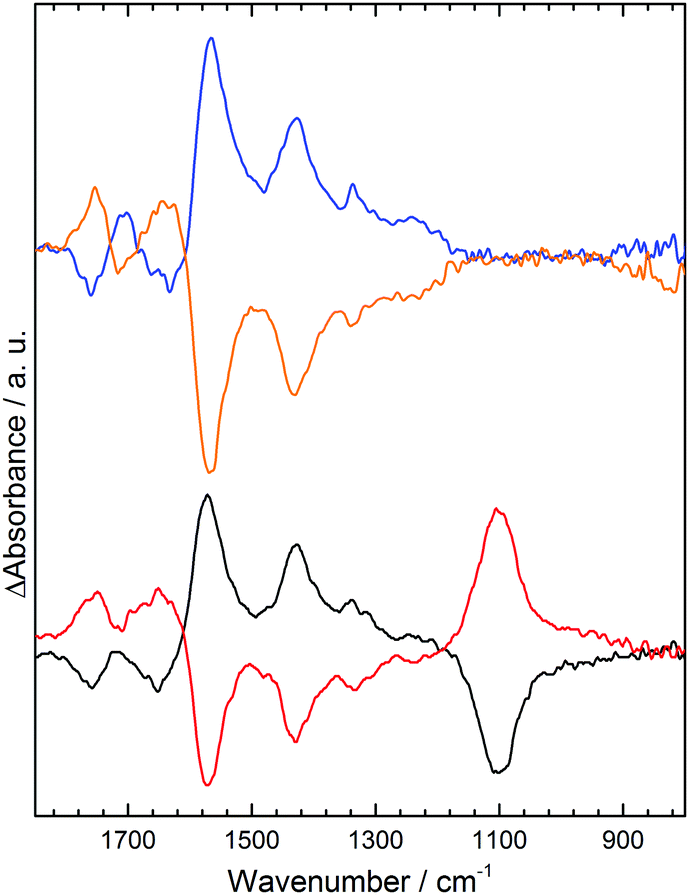 | ||
| Fig. 2 ATR IR difference spectra of the GNF-Ca modified electrode in pH 7 solutions: 0.1 M NaCl, −0.5 V (blue), +1.0 V (orange); 0.1 M Na2SO4, −0.5 V (black), +1.0 V (red). | ||
Deprotonation of electrode-immobilized acids has been reported to be induced by applied electric field;6,7 however, such a mechanism would result in the opposite trend to that seen here (S8, ESI†). An increase in interfacial pH at −0.5 V would also induce deprotonation; this could arise through O2, H+ or water reduction. However, we find identical spectral changes in deoxygenated solution (S6, ESI†), discounting a pH change due to O2 reduction. In contrast, spectral changes are completely suppressed when the ionic strength of the electrolyte is lowered while the pH held constant (S9 and S10, ESI†). This strong dependence on ion activity is consistent with protonation being due to a negative shift in pKa(app) of the acids when local cation activity is increased at the electrode interface at negative potentials,2,3 as predicted by eqn (1). This results in deprotonation of some acid groups that would usually remain protonated at pH 7.
Previous titration studies9 have shown that the GNF–COOH groups exhibit a wide range of pKa values. Despite all edge acids being chemically identical, they occupy different sites and their pKa values are strongly influenced by neighboring groups. Below pH 3 most acid edge groups are protonated and above pH 9 they are mostly deprotonated. At intermediate pH 7 some groups are deprotonated while others are not, hence a small negative shift in pKa(app) at −0.5 V results in the deprotonation of some of these acids, as we observe. Evidence for changes in local ion activity comes from the difference spectra in pH 7 Na2SO4 (Fig. 2, black, red). Near identical changes to the spectra of the acid CO and carboxylate region in NaCl are observed, but additionally the asymmetric stretch for the solution sulphate anion14 is seen at 1100 cm−1. The anion is repelled from the electrode surface when −0.5 V is applied (black) and hence a decrease in absorbance is observed. This demonstrates that a measurable change in local activity of electrolyte ions takes place in response to the electric field at the electrode. Although not detectable with IR, the Na+ cation activity must be similarly perturbed, moving in the opposite direction to the sulphate anion. Identical spectral changes are obtained in 0.1 M pH 7 K2SO4 (S11, ESI†), indicating both cations undergo similar increases in activity at −0.5 V.
Calibration with known concentrations of K2SO4 allows us to estimate that the intensity loss of the sulphate band at −0.5 V corresponds to a decrease in SO42− concentration of 3.5 × 10⁻³ mol dm−3 (S12, ESI†). We therefore infer from stoichiometry an increase in aK+ of 7 × 10⁻³ at −0.5 V (assuming activity coefficients as unity and similar anion and cation mobility). Only negative potentials perturb aSO42− from equilibrium values and application of +1.0 V does not result in an increase in aSO42− (S13, ESI†). This is due to pre-concentration of 7 × 10⁻³ mol dm−3 of sulphate within the GNF-Ca electrode structure during initial equilibration in electrolyte (S14, ESI†), as observed from the IR spectrum of the equilibrated electrode. Thus migration of sulphate towards the electrode at +1.0 V must take place against a concentration gradient and is disfavoured. Migration of sulphate away from the electrode is found to be dependent on the magnitude of negative potential applied (S15, ESI†).
Repetition of experiments at pH 3.5 (Fig. 3) shows that in KCl and K2SO4 changes to the electrode acid group spectra are almost identical to those in NaCl and Na2SO4 at pH 7. This is consistent with GNF acid groups having pKa values of 3 to 9 and hence some being able to undergo deprotonation at pH 3.5 in response to increased aK+. In K2SO4 the sulphate band also shows the same response to applied potential as at pH 7, although the absorbance changes are weaker and broader. At pH 3 (Fig. 3 black, red) spectral changes for GNF acid groups and solution sulphate are much lower in intensity. For the acid groups this is unsurprising, as only a small number of the most acidic groups can undergo deprotonation at this pH as few have a pKa of 3 or below. Spectral changes in the sulphate region can be rationalized by predicting trends in interfacial activities of solution species in response to changes in aM+ at the electrode. Using the value for ΔaK+ of 7 × 10⁻³ at −0.5 V, determined above, eqn (1) can be used to calculate pKa(app) for HSO4− with no applied potential and at −0.5 V, as shown in Table 1. Changes in sulphate and HSO4− activity resulting from the change in pKa(app), have been calculated at different pH using the Henderson–Hasselbalch equation (S16, ESI†). At pH 7, SO42− activity is unperturbed by any change in pKa(app), hence the spectral changes to the sulphate band result only from migration of the anion away from the electrode at −0.5 V.
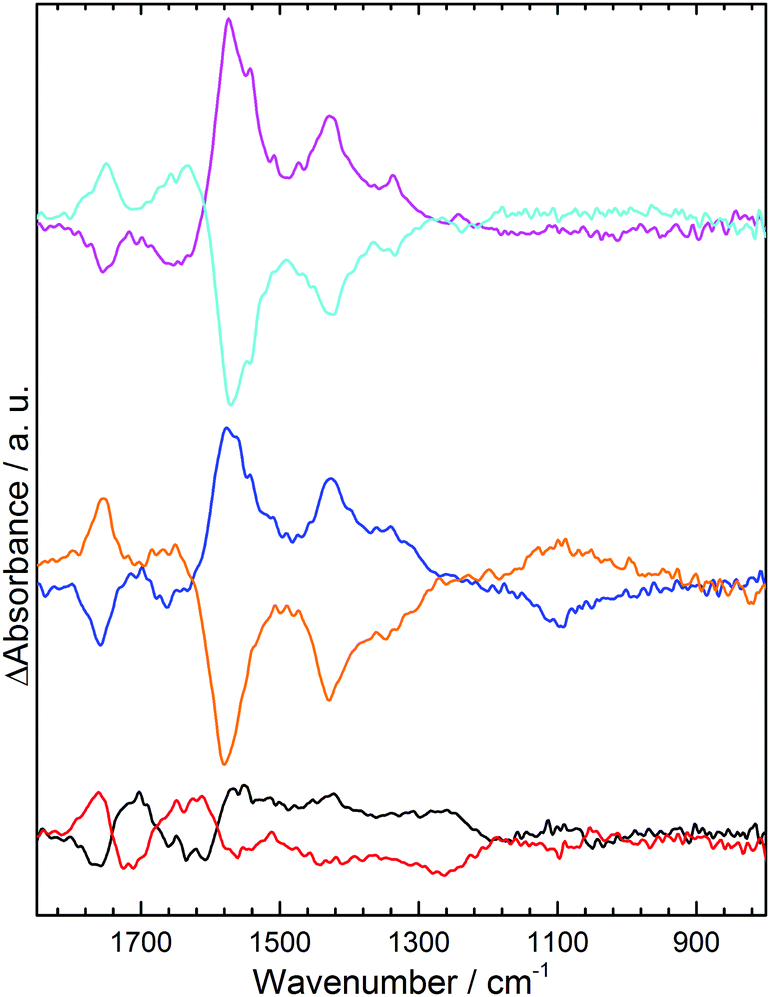 | ||
| Fig. 3 ATR IR difference spectra of the GNF-Ca modified electrode interface in: 0.1 M pH 3.5 KCl, −0.5 V (pink), +1.0 V (light blue); 0.1 M pH 3.5 K2SO4, −0.5 V (blue), +1.0 V (orange); 0.1 M pH 3 K2SO4, −0.5 V (black), +1.0 V (red). | ||
| pH | E/V |
a
K+![[thin space (1/6-em)]](https://www.rsc.org/images/entities/char_2009.gif) a a |
pKa(app) HSO4−b |
ΔaHSO4−/10−3c |
ΔaSO42−/10−3c |
|---|---|---|---|---|---|
| a See S16 (ESI) for calculation of aK+. b From eqn (1) with pKa(HSO4−) = 1.92, pKas = 0. c From pKa(app) and Henderson–Hasselbalch eq. | |||||
| 7 | — | 0.200 | 2.619 | 0 | 0 |
| 7 | −0.5 | 0.207 | 2.604 | 0 | 0 |
| 3.5 | — | 0.198 | 2.623 | 0 | 0 |
| 3.5 | −0.5 | 0.205 | 2.608 | −0.4 | +0.4 |
| 3 | — | 0.192 | 2.637 | 0 | 0 |
| 3 | −0.5 | 0.199 | 2.621 | −0.8 | +0.8 |
At pH 3.5, as the solution pH is closer to pKa(app) values, deprotonation of 0.4 × 10⁻³ mol dm−3 of HSO4− is predicted at −0.5 V. Spectral bands for HSO4− span ca. 850–1250 cm−1, hence a decrease in intensity is predicted over this spectral range;14 however, this will be concomitant with an increase in intensity centered at 1100 cm−1 as the sulphate activity is increased. Overall spectral changes in the sulphate region are therefore predicted to be very weak at pH 3.5, due to the simultaneous increase and decrease in absorbance over this wavenumber range, and broader than at pH 7 due to the contribution from HSO4− which exhibits bands over a wider range than SO42−. This analysis broadly fits with experimental results (Fig. 3 blue), where a weaker and broader band is observed in this region compared to pH 7 (Fig. 2 black). An overall loss in intensity is still observed for both species, as the above analysis ignores the electrostatic migration of anionic species away from the electrode. This results in a larger observed loss in spectral intensity for both species than predicted by Table 1. The effect of the shift in pKa(app) for HSO4− at −0.5 V is seen more strongly at pH 3, where the gain in SO42− and loss of HSO4− is predicted to be greater (Table 1). Although the spectral bands in the sulphate region (Fig. 3 black) are almost non-existent, due to cancelling of the increase in SO42− by the decrease in HSO4− at similar wavenumbers, we do now observe a small gain of sulphate at 1100 cm−1 along with a small loss of HSO4− at 1050 cm−1, in line with predicted trends.
The same analysis (S16, ESI†) can be carried out to predict spectral changes in 0.1 M phosphate solutions at −0.5 V, as shown in Table 2 for calculated changes in activities for H3PO4, H2PO4− and HPO42− at pH 3, 7 and 9. The experimental spectra obtained under these conditions are shown in Fig. 4. At pH 3 Table 2 predicts significant losses in spectral intensity for H3PO4 species15 at 1172, 1005 and 889 cm−1 with gains at 1159, 1077, 940 and 875 cm−1 for H2PO4−. This is broadly observed in the experimental spectrum (Fig. 4 black), where a particularly strong absorption loss is seen at 1005 cm−1 for H3PO4, along with a gain at 1077 cm−1 for H2PO4−, although as some gain bands are in similar positions to losses they cancel each other out. At both pH 7 and 9 H2PO4− is predicted to undergo deprotonation to give HPO42−. Experimentally, at pH 7 and 9 clear gains are observed at 1078 and 990 cm−1 corresponding to increased HPO42−. The apparent splitting of the 1078 cm−1 band is due to simultaneous decrease in absorbance at 1077 cm−1, which along with losses at 940 and 1155 cm−1 indicates concomitant loss of H2PO4−, exactly as predicted.
| pH | E/V | ΔaH3PO4/10−3 | ΔaH2PO4−/10−3 | ΔaHPO42−/10−3 |
|---|---|---|---|---|
| 3 | −0.5 | −2.0 | +2.0 | 0 |
| 7 | −0.5 | 0 | −0.4 | +0.4 |
| 9 | −0.5 | 0 | −0.2 | +0.2 |
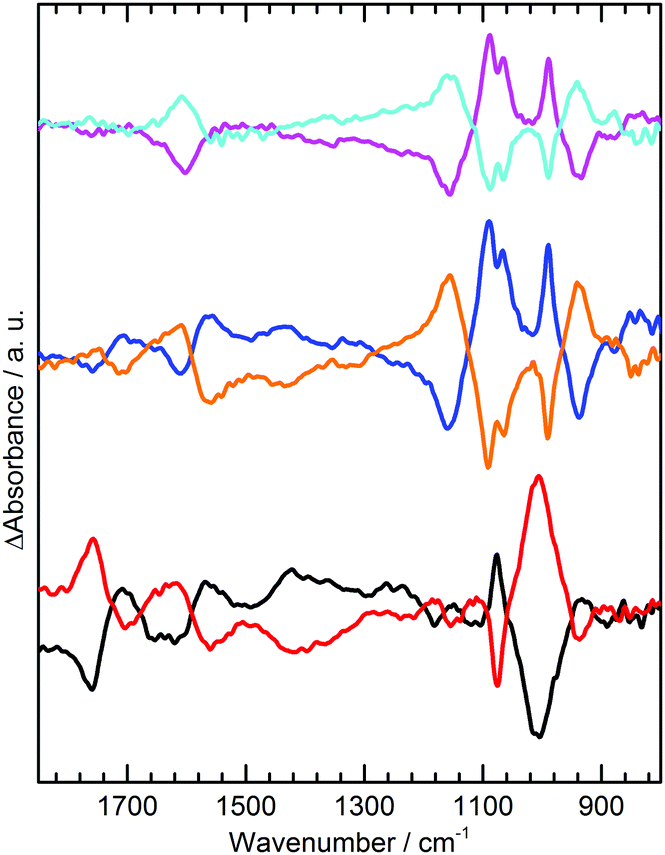 | ||
| Fig. 4 ATR IR difference spectra of the GNF-Ca modified electrode interface in: 0.1 M pH 3 H3PO4/KH2PO4, −0.5 V (black), +1.0 V (red); 0.1 M pH 7 KH2PO4/K2HPO4, −0.5 V (blue), +1.0 V (orange); 0.1 M pH 9.2 K2HPO4, −0.5 V (pink), +1.0 V (light blue). | ||
However, comparison of the predicted changes in Table 2 with Fig. 4 show that the experimental phosphate difference bands are significantly more intense than predicted at pH 7 and 9. The intense phosphate bands are in contrast to anomalously weak acid carbonyl and carboxylate bands under the same conditions. In NaCl and Na2SO4 at pH 7 the acid spectral changes are prominent and of a similar magnitude to those at pH 3.5. This anomalous behavior is attributed to suppression of COOH deprotonation in response to changes in phosphate speciation. With a local increase in cation activity, the pKa(app) of H2PO4− is lowered and deprotonation takes place:
| H2PO4− → HPO42− + H+ | (2) |
| GNF–COO− + H+ → GNF–COOH | (3) |
The ubiquity of acid moieties at electrode interfaces, as defect sites on carbon electrodes and as polymer electrolytes of solid supercapacitors, makes understanding their response to applied electrode potential an essential area of study. Here we have shown using in situ IR spectroscopy that both electrode-immobilized and solution acids undergo deprotonation in response to increased cation activity at a negatively biased electrode. This observation will allow design of electrodes with specific potential-dependent protonation behaviour, which can be tuned by matching with appropriate electrolyte species.
We thank C. G. Salzmann for GNF samples and EPSRC EP/J010006/1 for funding.
Notes and references
- K. Ariga, T. Nakanishi, J. P. Hill, M. Shirai, M. Okuno, T. Abe and J. Kikuchi, J. Am. Chem. Soc., 2005, 127, 12074 CrossRef CAS PubMed.
- K. Sugahara, K. Shimazu and K. Uosaki, Langmuir, 2000, 16, 7101 CrossRef.
- A. M. Luque, A. Cuestra, J. J. Calvente and R. Andreu, Electrochem. Commun., 2014, 45, 13 CrossRef CAS.
- J. H. Bradbury and J. A. Carver, Biochemistry, 1984, 23, 4905 CrossRef CAS PubMed.
- O. Gershevitz and C. N. Sukenik, J. Am. Chem. Soc., 2004, 126, 482 CrossRef CAS PubMed.
- C. P. Smith and H. S. White, Langmuir, 1993, 9, 1 CrossRef CAS.
- I. Burgess, B. Seivewright and R. B. Lennox, Langmuir, 2006, 22, 4420 CrossRef CAS PubMed.
- S. Gan, L. Zhong, L. Gao, D. Han and L. Niu, J. Am. Chem. Soc., 2016, 138, 1490 CrossRef CAS PubMed.
- M. M. Lounasvuori, M. Rosillo-Lopez, C. G. Salzmann, D. J. Caruana and K. B. Holt, Faraday Discuss., 2014, 172, 293 RSC.
- L. A. Hutton, J. G. Iacobini, E. Bitzion, R. B. Channon, M. E. Newton and J. V. Macpherson, Anal. Chem., 2013, 85, 7230 CrossRef CAS PubMed.
- M. Rosillo-Lopez, T. J. Lee, M. Bella, M. Hart and C. G. Salzmann, RSC Adv., 2015, 5, 104198 RSC.
- G. Socrates, Infrared and Raman Characterisation Frequencies, John Wiley and Sons, 2001 Search PubMed.
- T. Kar, S. Scheiner, U. Adhikari and A. K. Roy, J. Phys. Chem. C, 2013, 117, 18206 CAS.
- K. L. Nash, J. Sully and A. B. Horn, Phys. Chem. Chem. Phys., 2000, 2, 4933 RSC.
- E. J. Elzinga and D. L. Sparks, J. Colloid Interface Sci., 2007, 308, 53 CrossRef CAS PubMed.
Footnote |
| † Electronic supplementary information (ESI) available: S1–S17: derivation of eqn (1), calculations for Tables 1 and 2, discussion of field induced deprotonation, migration at +1.0 V, characterization of GNF, GNF-Ca and spectroelectrochemistry cell, spectra in deoxygenated solution and on initial application of +1.0 V, determination of ΔaSO42−. See DOI: 10.1039/c6cc09418j |
| This journal is © The Royal Society of Chemistry 2017 |