 Open Access Article
Creative Commons Attribution 3.0 Unported Licence
A red-NIR fluorescent dye detecting nuclear DNA G-quadruplexes: in vitro analysis and cell imaging†
F.
Doria‡
 a,
M.
Nadai‡
 b,
M.
Zuffo
a,
R.
Perrone
 b,
M.
Freccero
 *a and
S. N.
Richter
*b
aDept. of Chemistry, University of Pavia, V.le Taramelli 10, 27100 Pavia, Italy. E-mail: mauro.freccero@unipv.it
bDept. of Molecular Medicine, University of Padua, via Gabelli 63, 35121 Padua, Italy. E-mail: sara.richter@unipd.it
First published on 23rd January 2017
Abstract
Aggregation, red-NIR emission and light-up upon nucleic acid G-quadruplex binding have been investigated for a prototype core-extended naphthalene diimide, which is capable of fast cellular entry and nucleolar localization. Both high-level colocalization with an anti-G-quadruplex antibody and nucleolin displacement reveal that the compound targets and thus makes visible nuclear DNA G-quadruplexes.
G-quadruplexes (G4s) are unique four-stranded nucleic acid structures formed by guanine-rich sequences. Based on mutual strand orientation, they can adopt three main topologies, i.e. parallel, antiparallel and hybrid-type. G4s were shown to be involved in key regulatory and pathological roles both in eukaryotes and in microorganisms, including transcriptional regulation of gene promoters and enhancers, translation, chromatin epigenetic regulation, and DNA recombination.1–5 Formation of G4s in vivo has been substantiated by the discovery of cellular proteins that specifically recognize G4s6,7 and development of G4 specific antibodies.8,9
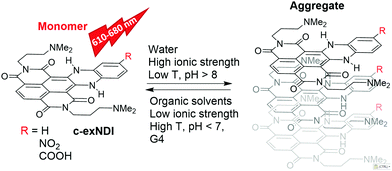
Given the biological significance of G4s, extensive efforts by many groups have resulted in a large number of G4-stabilizing ligands as potential inhibitors of pathological processes, such as cancer cell growth,10,11 bacterial and viral infections12–18 and neurological degeneration.19 In line with these potential applications, G4 tracking by small molecule probes, such as fluorescent ligands, has become an equally important research field. In this direction, a number of compounds fluorescing upon G4 binding have been developed.20–22 Some of them were able to preferentially recognize definite G4 topologies.23–25 A major limitation to their use in vivo, however, is their cellular and subcellular permeability. For example, compounds that do not or poorly enter the nucleus are available only for cytoplasmic RNA G4 probing.26,27 In addition, compounds must be selective for G4 nucleic acids. For example, Thioflavin T,28 which also binds amyloid aggregates, cannot be used for in vivo imaging.29 Tri- and tetra-substituted naphthalene diimides (NDIs) are potent and reversible ligands,30,31 as well as alkylating agents targeting guanine-rich nucleic acids (NAs) folded into G4s.32,33 Their performance as cellular fluorescent probes has been implemented by loss of structural planarity,34 conjugation to a second NDI unit35 or to a coumarin absorbing antenna,36 and extension of the aromatic core.37 Core-extended NDIs (c-exNDIs, Scheme 1) are potent G4 binders, displaying anti-HIV-1 activity due to their ability to bind viral G4s with higher affinity than the cellular G4s.12 Nonetheless, because of the high potency of c-exNDIs, cellular G4s are also bound with good efficiency.12 In addition, the extended aromatic system confers high absorptivity and emission in the red-NIR region to the c-exNDIs. These features prompted us to characterise the fluorescence behaviour of the unsubstituted c-exNDI (R![[double bond, length as m-dash]](https://www.rsc.org/images/entities/char_e001.gif) H) both in solution and when bound to G4s.
H) both in solution and when bound to G4s.
The UV-vis spectra of c-exNDI in organic solvents (Fig. S1, ESI†) including THF (Fig. 1) showed three absorption bands with the highest peak at 578 nm, indicating the presence of non-aggregated c-exNDI monomers. In contrast, the spectrum in water showed two broader peaks at 555 and 605 nm, with a tail up to 700 nm (Fig. 1). c-exNDI mirrors the absorbance behaviour of perylene bisimides (PDIs), which has been associated with aggregation.38 Increasing water in the THF/mixtures, we observed the progressive formation of a c-exNDI aggregate (Fig. S2, ESI†). It is known that PDI aggregation in water causes significant fluorescence quenching. As expected, the fluorescence intensity of c-exNDI (5 × 10⁻⁶ M) in water was only about 8% of that in THF. Temperature and pH effects on both absorption and emission spectra further corroborated the aggregation evidence (Fig. S3 and S4, ESI†).
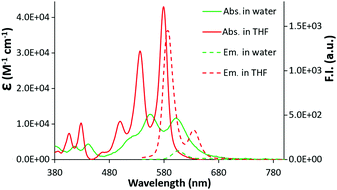 | ||
| Fig. 1 Absorption (2 × 10⁻⁵ M) and emission (5 × 10⁻⁶ M, λexc = 500 nm) spectra of a solution of c-exNDI in water (green line) and in THF (red line). | ||
To assess whether c-exNDI aggregation was also effective in physiological conditions (10 mM Tris–HCl pH 7.4, 100 mM KCl), we measured the compound absorption spectra at increasing concentrations (1.5 × 10⁻⁵– 3 × 10⁻⁴ M, Fig. S5, ESI†). Molar absorptivity was found to isodesmically depend on the concentration (K−d = 1.1 ± 0.3 × 10⁵ M−1). To clarify the difference in the emission properties of the free vs. aggregated c-exNDI, absorption and excitation spectra were measured in THF and water solution. The spectra were superimposable in THF, while remarkably different in water, with the excitation spectrum exhibiting a profile more similar to that recorded in THF than to that of the absorption spectrum (Fig. S6, ESI†). This suggests that the monomeric form is the only emitting species. We thus decided to investigate whether G4 binding induced disaggregation and consequent light-up. We titrated diluted solutions of c-exNDI (5 × 10⁻⁶ M) with a small NA library (Table S1, ESI†) composed of three anti-parallel G4s (HRAS, hTel22 in Na+ and TBA), a hybrid G4 (hTel22 in K+), three parallel G4s (c-kit1, c-kit2 and c-myc) and controls (ssDNA and dsDNA). Titrations were performed in both absorption and emission modes. Titration of c-exNDI with hTel22 in K+ solution induced a red shift in both absorption (15 nm) and emission (12 nm) and signal intensity enhancement (Fig. 2a and b). hTel22 in K+ yielded the most intense fluorescence enhancement. With the other NAs, after an initial quenching, we observed a moderate and differential light-up (Fig. 2c). The one exception was dsDNA, with which we measured a progressive quenching of the emission. The fluorescence quantum yields (Φf) of c-exNDI in the presence of one equivalent of each NA (Table S2, ESI†) increased differently (i.e., from Φf = 24% with hTel22 in K+, to Φf = 14% with c-myc) with respect to c-exNDI alone (8%), indicating an increase in the monomer content of the solution upon G4 binding. Fitting of fluorescence and absorption data for the different c-exNDI/G4 mixtures (Fig. S7, ESI†) allowed us to determine the best complexation models and the apparent binding constants (Table S3, ESI†). These span from 3.43 ± 0.3 × 10⁷ M−1 (c-myc) to 1.2 ± 0.5 × 10⁵ M−1 (TBA) in the best fitting 1![[thin space (1/6-em)]](https://www.rsc.org/images/entities/char_2009.gif) :
:![[thin space (1/6-em)]](https://www.rsc.org/images/entities/char_2009.gif) 1 model. hTel22 in Na+ and HRAS yielded 3.0 ± 0.3 × 10¹¹ and 3.0 ± 0.3 × 10¹⁰ M−2 values, respectively, in the 2
1 model. hTel22 in Na+ and HRAS yielded 3.0 ± 0.3 × 10¹¹ and 3.0 ± 0.3 × 10¹⁰ M−2 values, respectively, in the 2![[thin space (1/6-em)]](https://www.rsc.org/images/entities/char_2009.gif) :
:![[thin space (1/6-em)]](https://www.rsc.org/images/entities/char_2009.gif) 1 (c-exNDI
1 (c-exNDI![[thin space (1/6-em)]](https://www.rsc.org/images/entities/char_2009.gif) :
:![[thin space (1/6-em)]](https://www.rsc.org/images/entities/char_2009.gif) NA) model. c-exNDI
NA) model. c-exNDI![[thin space (1/6-em)]](https://www.rsc.org/images/entities/char_2009.gif) :
:![[thin space (1/6-em)]](https://www.rsc.org/images/entities/char_2009.gif) NA stoichiometries were confirmed by Job plot analysis of emission data (for hTel22 see the inset of Fig. 2b and for other NAs see Fig. S8, ESI†). Interestingly, we measured an apparent binding constant of 7.41 ± 0.03 × 10³ M−1 for dsDNA, in the 1
NA stoichiometries were confirmed by Job plot analysis of emission data (for hTel22 see the inset of Fig. 2b and for other NAs see Fig. S8, ESI†). Interestingly, we measured an apparent binding constant of 7.41 ± 0.03 × 10³ M−1 for dsDNA, in the 1![[thin space (1/6-em)]](https://www.rsc.org/images/entities/char_2009.gif) :
:![[thin space (1/6-em)]](https://www.rsc.org/images/entities/char_2009.gif) 1 model, confirming c-exNDI selectivity for the G4 conformation. The ssDNA binding constant (2.85 ± 0.01 × 10⁵ M−1, 1
1 model, confirming c-exNDI selectivity for the G4 conformation. The ssDNA binding constant (2.85 ± 0.01 × 10⁵ M−1, 1![[thin space (1/6-em)]](https://www.rsc.org/images/entities/char_2009.gif) :
:![[thin space (1/6-em)]](https://www.rsc.org/images/entities/char_2009.gif) 1 model), being much lower than those measured for c-myc and hTel22 in K+ (120 and 20 fold, respectively), did not limit the probe applicability.
1 model), being much lower than those measured for c-myc and hTel22 in K+ (120 and 20 fold, respectively), did not limit the probe applicability.
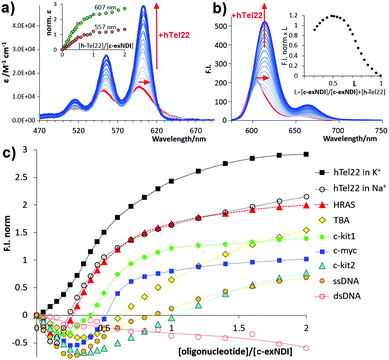 | ||
| Fig. 2 (a) Titration absorption spectra of a 5.0 × 10⁻⁶ M c-exNDI solution (1 × 10⁻¹ M KCl, 1 × 10⁻² M Tris–HCl, pH 7.4) upon addition of hTel22 G4 (2.5 × 10⁻⁷–1.0 × 10⁻⁵ M); inset: molar absorptivity enhancement (norm. ε = ε/ε0 − 1). (b) Titration emission spectra (λexc = 600 nm) measured under the same conditions as (a). Inset: Job plot analysis of emission data. (c) Fluorescence enhancement factors (F.I.norm = F/Fo − 1), plotted as a function of the [oligonucleotide]/[c-exNDI] ratio for the titrations of c-exNDI with the NAs in Table S1 (ESI†). | ||
Direct interaction of c-exNDI with hTel22 G4 was probed by CD and Taq polymerase stop assay analysis. When complexed with the G4, the compound acquired an induced CD (ICD) signal at wavelengths corresponding to its absorption maxima (Fig. S9A, ESI†). When added to the G4-forming template, c-exNDI inhibited Taq polymerase progression in a concentration-dependent manner (Fig. S9B and C, ESI†). These data indicate that c-exNDI directly interacts with the G4.
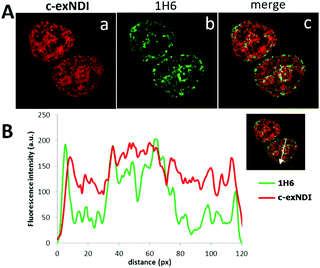
These data prompted us to investigate the ability of c-exNDI to enter into cells (293T, human embryonic kidney cell line) by UV/vis absorption and fluorescence microscopy. Interestingly, when c-exNDI-treated cells were imaged for fluorescence, most of the signal was concentrated in the cell nucleus, with peaks in subnuclear compartments. In contrast, no significant fluorescence was observed in the cytoplasm (Fig. S10A, panels c and d, ESI†). Comparing cells incubated with c-exNDI for different time intervals, the fluorescence signal was found to be appreciable in the nucleus only after 2.5 min, demonstrating a very fast cellular and nuclear entry (Fig. S10B, ESI†). This indicates a remarkably different cellular entry and distribution of c-exNDI in comparison with recently described fluorogenic probes effectively targeting cellular G4s.26,39 To characterize the nuclear localization of c-exNDI, treated cells were visualized using confocal microscopy. The compound appeared clustered in discrete foci all over the nucleus, with enhanced assemblage around and inside subnuclear organelles (Fig. S11, panel a, ESI†). Following the in vitro observation of c-exNDI’s high selectivity for G4 DNA12 and effective light-up when bound to human telomeric hTel22 G4, we treated cells with either DNase or RNase to confirm the nature of the main binding target of the compound. RNase treatment did not modify c-exNDI nuclear staining/localization (Fig. S11, panel b, ESI†), while the use of DNase profoundly affected the c-exNDI signal, largely decreasing it in the nucleoplasm (Fig. S11, panel c, ESI†). Subnuclear localization was maintained, though at lower intensity (Fig. S11, panel c, ESI†), probably due to the inability of DNase to reach the subnuclear organelles. These data indicate that c-exNDI in cells mainly binds DNA and that disruption of the c-exNDI/DNA complex highly impairs compound fluorescence. To check whether DNA G4s were the preferred targets not only in vitro but also in cells, cells were incubated with c-exNDI, washed, fixed and treated with the 1H6 antibody,8 specifically selected to recognize DNA G4 structures in vitro and in cells.8,40 Indeed, we observed a good colocalization of c-exNDI and 1H6 (Fig. 3A), further confirmed by the intensity profiles acquired in the 2D single-cell along an ideal arrow entirely sectioning the cell nucleus (inset in Fig. 3B): c-exNDI and 1H6 signals displayed partial overlapping profiles (red and green lines, respectively, Fig. 3B). The overlap coefficient41 was 0.77 out of 1.00 (Fig. 3B). The compound also showed signal peaks not colocalizing with 1H6. However, this behaviour is compatible with the intrinsically different nature of c-exNDI and 1H6. The former, being a small molecule of 540.6 Da, has a wider distribution than the latter, a protein of about 150 kDa, likely more hindered in its cellular distribution. Since we showed that G4 binding induced a red-shift in the emission maximum of c-exNDIin vitro, we checked whether this effect was detectable also in cells: thus emission signals at 601–609 nm and 609–617 nm were collected and compared. A fluorescence increase of 10.0 ± 0.6% at the emission interval 609–617 nm compared to that at 601–609 nm was observed (Fig. S12, ESI†). It is important to note that, in the absence of red shift, lower fluorescence intensity at 609–617 nm would be expected since the emission spectra of the free c-exNDI rapidly decreases at this wavelength interval by roughly 30%. The observed behaviour is consistent with the red shift and increase in emission upon c-exNDI binding to G4s obtained in vitro.
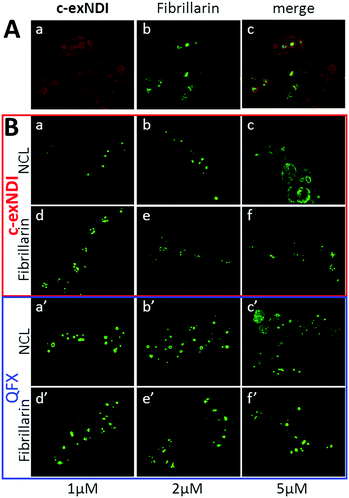
c-exNDI was mainly clustered in subnuclear organelles, whose appearance was compatible with that of nucleoli. To confirm the identity of these subnuclear compartments, fibrillarin, a component of nucleolar snRNPs, was used as a marker along with c-exNDI. Fibrillarin stained the same subnuclear bodies as c-exNDI, confirming the preferential nucleolar localization of the compound (Fig. 4A). Nucleolin (NCL) is a G4-binding protein, which is mainly localized in the nucleolus.42 It has been previously shown that treatment with quarfloxin (QFX), a potent G4 ligand, induced displacement of NCL, without affecting fibrillarin.43 We thus compared the ability of c-exNDI and QFX to displace NCL from the nucleoli. At 5 μM both c-exNDI and QFX induced a relocalization of NCL to the nucleoplasm outside the nucleoli (Fig. 4B, panels c and c′). In contrast, neither of them affected fibrillarin distribution (Fig. 4B, panels d–f and d′–f′).
In conclusion, we proved that aggregated non-emitting c-exNDI becomes selectively monomeric and fluorescent when bound to G4s. In particular, in vitro evaluation highlighted a maximal emission enhancement in the presence of hTel22 G4 in K+ solution and complexation constants confirmed a preferential binding to G4s with respect to dsDNA. In cells, c-exNDI rapidly and preferentially localized in the nuclei, showing co-localization with the 1H6 G4-specific antibody. Formation of the G4–c-exNDI complex in cells was also supported by the typical red-shifted emission observed in vitro. Not only specific localization at the nucleoli, but also binding to nucleolar G4s was confirmed by comparative nucleolin displacement assays. These collective results may be the first steps to achieve in situ detection of spots of selected DNA G4s in cell nuclei by a small fluorescent dye.
We thank Prof. P. M. Lansdorp for providing the 1H6 antibody and Prof L. H. Hurley for the gift of quarfloxin. This work was supported by the European Research Council (ERC Consolidator grant 615879) to S. N. R. and M. F., the Bill and Melinda Gates Foundation (GCE grants OPP1035881, OPP1097238) to S. N. R, and the Italian Association for Cancer Research [AIRC grant 14708] to M. F.
Notes and references
- D. Rhodes and H. J. Lipps, Nucleic Acids Res., 2015, 43, 8627–8637 CrossRef CAS PubMed.
- B. Zhou, C. Liu, Y. Geng and G. Zhu, Sci. Rep., 2015, 5, 16673 CrossRef PubMed.
- R. Perrone, M. Nadai, I. Frasson, J. A. Poe, E. Butovskaya, T. E. Smithgall, M. Palumbo, G. Palu and S. N. Richter, J. Med. Chem., 2013, 56, 6521–6530 CrossRef CAS PubMed.
- I. T. Holder and J. S. Hartig, Chem. Biol., 2014, 21, 1511–1521 CrossRef CAS PubMed.
- N. Maizels, EMBO Rep., 2015, 16, 910–922 CrossRef CAS PubMed.
- E. Tosoni, I. Frasson, M. Scalabrin, R. Perrone, E. Butovskaya, M. Nadai, G. Palu, D. Fabris and S. N. Richter, Nucleic Acids Res., 2015, 43, 8884–8897 CrossRef CAS PubMed.
- J. Qiu, M. Wang, Y. Zhang, P. Zeng, T. M. Ou, J. H. Tan, S. L. Huang, L. K. An, H. Wang, L. Q. Gu, Z. S. Huang and D. Li, Curr. Top. Med. Chem., 2015, 15, 1971–1987 CrossRef CAS PubMed.
- A. Henderson, Y. Wu, Y. C. Huang, E. A. Chavez, J. Platt, F. B. Johnson, R. M. Brosh, Jr., D. Sen and P. M. Lansdorp, Nucleic Acids Res., 2014, 42, 860–869 CrossRef CAS PubMed.
- G. Biffi, D. Tannahill, J. McCafferty and S. Balasubramanian, Nat. Chem., 2013, 5, 182–186 CrossRef CAS PubMed.
- T. M. Ou, Y. J. Lu, J. H. Tan, Z. S. Huang, K. Y. Wong and L. Q. Gu, ChemMedChem, 2008, 3, 690–713 CrossRef CAS PubMed.
- M. Folini, L. Venturini, G. Cimino-Reale and N. Zaffaroni, Expert Opin. Ther. Targets, 2011, 15, 579–593 CrossRef CAS PubMed.
- R. Perrone, F. Doria, E. Butovskaya, I. Frasson, S. Botti, M. Scalabrin, S. Lago, V. Grande, M. Nadai, M. Freccero and S. N. Richter, J. Med. Chem., 2015, 58, 9639–9652 CrossRef CAS PubMed.
- S. Artusi, M. Nadai, R. Perrone, M. A. Biasolo, G. Palu, L. Flamand, A. Calistri and S. N. Richter, Antiviral Res., 2015, 118, 123–131 CrossRef CAS PubMed.
- R. Perrone, E. Butovskaya, D. Daelemans, G. Palu, C. Pannecouque and S. N. Richter, J. Antimicrob. Chemother., 2014, 69, 3248–3258 CrossRef CAS PubMed.
- R. Perrone, M. Nadai, J. A. Poe, I. Frasson, M. Palumbo, G. Palu, T. E. Smithgall and S. N. Richter, PLoS One, 2013, 8, e73121 CAS.
- S. R. Wang, Y. Q. Min, J. Q. Wang, C. X. Liu, B. S. Fu, F. Wu, L. Y. Wu, Z. X. Qiao, Y. Y. Song, G. H. Xu, Z. G. Wu, G. Huang, N. F. Peng, R. Huang, W. X. Mao, S. Peng, Y. Q. Chen, Y. Zhu, T. Tian, X. L. Zhang and X. Zhou, Sci. Adv., 2016, 2, e1501535 Search PubMed.
- P. Murat, J. Zhong, L. Lekieffre, N. P. Cowieson, J. L. Clancy, T. Preiss, S. Balasubramanian, R. Khanna and J. Tellam, Nat. Chem. Biol., 2014, 10, 358–364 CrossRef CAS PubMed.
- A. Madireddy, P. Purushothaman, C. P. Loosbroock, E. S. Robertson, C. L. Schildkraut and S. C. Verma, Nucleic Acids Res., 2016, 44, 3675–3694 CrossRef CAS PubMed.
- R. Simone, P. Fratta, S. Neidle, G. N. Parkinson and A. M. Isaacs, FEBS Lett., 2015, 589, 1653–1668 CrossRef CAS PubMed.
- A. C. Bhasikuttan and J. Mohanty, Chem. Commun., 2015, 51, 7581–7597 RSC.
- B. R. Vummidi, J. Alzeer and N. W. Luedtke, ChemBioChem, 2013, 14, 540–558 CrossRef CAS PubMed.
- E. Largy, A. Granzhan, F. Hamon, D. Verga and M. P. Teulade-Fichou, Top. Curr. Chem., 2013, 330, 111–177 CrossRef CAS PubMed.
- B. Jin, X. Zhang, W. Zheng, X. Liu, C. Qi, F. Wang and D. Shangguan, Anal. Chem., 2014, 86, 943–952 CrossRef CAS PubMed.
- S. B. Chen, W. B. Wu, M. H. Hu, T. M. Ou, L. Q. Gu, J. H. Tan and Z. S. Huang, Chem. Commun., 2014, 50, 12173–12176 RSC.
- M. H. Hu, X. Chen, S. B. Chen, T. M. Ou, M. Yao, L. Q. Gu, Z. S. Huang and J. H. Tan, Sci. Rep., 2015, 5, 17202 CrossRef CAS PubMed.
- A. Laguerre, K. Hukezalie, P. Winckler, F. Katranji, G. Chanteloup, M. Pirrotta, J. M. Perrier-Cornet, J. M. Wong and D. Monchaud, J. Am. Chem. Soc., 2015, 137, 8521–8525 CrossRef CAS PubMed.
- T. Y. Tseng, C. H. Chien, J. F. Chu, W. C. Huang, M. Y. Lin, C. C. Chang and T. C. Chang, J. Biomed. Opt., 2013, 18, 101309 CrossRef PubMed.
- J. Mohanty, N. Barooah, V. Dhamodharan, S. Harikrishna, P. I. Pradeepkumar and A. C. Bhasikuttan, J. Am. Chem. Soc., 2013, 135, 367–376 CrossRef CAS PubMed.
- A. Renaud de la Faverie, A. Guedin, A. Bedrat, L. A. Yatsunyk and J. L. Mergny, Nucleic Acids Res., 2014, 42, e65 CrossRef CAS PubMed.
- G. W. Collie, R. Promontorio, S. M. Hampel, M. Micco, S. Neidle and G. N. Parkinson, J. Am. Chem. Soc., 2012, 134, 2723–2731 CrossRef CAS PubMed.
- M. Micco, G. W. Collie, A. G. Dale, S. A. Ohnmacht, I. Pazitna, M. Gunaratnam, A. P. Reszka and S. Neidle, J. Med. Chem., 2013, 56, 2959–2974 CrossRef CAS PubMed.
- F. Doria, M. Nadai, M. Folini, M. Scalabrin, L. Germani, G. Sattin, M. Mella, M. Palumbo, N. Zaffaroni, D. Fabris, M. Freccero and S. N. Richter, Chem. – Eur. J., 2013, 19, 78–81 CrossRef CAS PubMed.
- M. Nadai, F. Doria, L. Germani, S. N. Richter and M. Freccero, Chem. – Eur. J., 2015, 21, 2330–2334 CrossRef CAS PubMed.
- F. Doria, M. Folini, V. Grande, G. Cimino-Reale, N. Zaffaroni and M. Freccero, Org. Biomol. Chem., 2015, 13, 570–576 CAS.
- F. Doria, A. Oppi, F. Manoli, S. Botti, N. Kandoth, V. Grande, I. Manet and M. Freccero, Chem. Commun., 2015, 51, 9105–9108 RSC.
- M. Zuffo, F. Doria, V. Spalluto, S. Ladame and M. Freccero, Chem. – Eur. J., 2015, 21, 17596–17600 CrossRef CAS PubMed.
- F. Doria, M. Nadai, G. Sattin, L. Pasotti, S. N. Richter and M. Freccero, Org. Biomol. Chem., 2012, 10, 3830–3840 CAS.
- F. Wurthner, Chem. Commun., 2004, 1564–1579 RSC.
- S. B. Chen, M. H. Hu, G. C. Liu, J. Wang, T. M. Ou, L. Q. Gu, Z. S. Huang and J. H. Tan, J. Am. Chem. Soc., 2016, 138, 10382–10385 CrossRef CAS PubMed.
- S. Artusi, R. Perrone, S. Lago, P. Raffa, E. Di Iorio, G. Palù and S. N. Richter, Nucleic Acids Res., 2016, 44, 10343–10353 Search PubMed.
- E. M. M. Manders, F. J. Verbeek and J. A. Aten, J. Microsc., 1993, 3, 375–382 CrossRef.
- B. Bugler, M. Caizergues-Ferrer, G. Bouche, H. Bourbon and F. Amalric, FEBS J., 1982, 2–3, 475–480 Search PubMed.
- D. Drygin, A. Siddiqui-Jain, S. O'Brien, M. Schwaebe, A. Lin, J. Bliesath, C. B. Ho, C. Proffitt, K. Trent, J. P. Whitten, J. K. Lim, D. Von Hoff, K. Anderes and W. G. Rice, Cancer Res., 2009, 69, 7653–7661 CrossRef CAS PubMed.
Footnotes |
| † Electronic supplementary information (ESI) available. See DOI: 10.1039/c6cc08492c |
| ‡ These authors contributed equally to this work. |
| This journal is © The Royal Society of Chemistry 2017 |

