 Open Access Article
Creative Commons Attribution 3.0 Unported Licence
Synchronization of excitable cardiac cultures of different origin
N. N.
Agladze
a,
O. V.
Halaidych
a,
V. A.
Tsvelaya
a,
T.
Bruegmann
b,
C.
Kilgus
b,
P.
Sasse
b and
K. I.
Agladze
 *ac
*ac
aMoscow Institute of Physics and Technology, Dolgoprudny, Moscow Region, Russia. E-mail: agladze@yahoo.com
bInstitute of Physiology I, Life and Brain Center, University of Bonn, Bonn, Germany
cThe Meshalkin Research Institute of Circulation Pathology, Novosibirsk, Russia
First published on 7th June 2017
Abstract
In the present work, we investigated the synchronization of electrical activity in cultured cardiac cells of different origin put in direct contact. In the first set of experiments synchronization was studied in the primary culture cells of neonatal rats taken at different developmental ages, and in the second – in the neonatal rat cardiomyocytes and HL-1 cells. The electrical excitation of cells was recorded using the calcium transient marker Fluor-4. In the confluent cell layers created with the aid of a specially devised mask, the excitation waves and their propagation between areas occupied by cells of different origin were observed. On the level of individual cells, their contact and synchronization was monitored with the aid of scanning fluorescence microscopy. It was found that populations of cultured cells of different origin are able to synchronize, suggesting the formation of electrical coupling between them. The results obtained may be considered as a proof of concept that implanted alien grafted cells are able to create electrical coupling with the host cardiac tissue.
1. Introduction
Implants made from cultured cardiac cells play an important role in regenerative medicine of the heart.1–3 Cultured patches consisting of two to three layers of live cells4,5 or even monolayers can be used to repair the cardiac conduction system. Growing cardiac tissue for regenerative medicine purposes raises some questions and among them the important one is how will the grown parts synchronize among themselves and the host tissue? Without this synchronization, it is hard to expect an efficient working of the heart. We directly tested the ability of the different cultured cardiac cells/tissues to synchronize. Conducting patches such as those with pacemaker activity do not only have to contract, but they must be perfectly electrically coupled with the host tissue for the conduction of excitation. In other words, implants from cultured cardiac cells should eventually form a functional syncytium with the host tissue.Electrical coupling of neighboring cells is believed to rely on the formation of gap junctions, directly connecting the intercellular spaces of the cells.6 In ref. 7, using immunostaining the authors found connexin-43 complexes between cells. This serves as strong evidence for the interconnection of cells. However, the role of gap junctions in the electrical coupling of cells has been seriously questioned, and several alternative mechanisms including ephaptic coupling have also been suggested.8,9 Consequently, the absence of visible gap junctions does not imply the absence of the electrical coupling of cells.
An important piece of evidence that a cell layer forms a functional syncytium is that the transmission of excitation from cell to cell is maintained, resulting in the propagation of the excitation wave.10 The propagation of excitation, often called electrical conduction,10,11 is an important feature of cardiac tissue because it orchestrates the contraction of the heart muscle. In the present work, we investigated the formation of electrical conduction between excitable cardiac tissues of different origin at the macro and micro levels. At the macro level, we studied the propagation of excitation in two areas of cultured cardiac cells put in direct contact. The excitation waves were observed and recorded by optical mapping with fluorescent dyes.12,13 Neonatal rat cardiomyocyte tissue cultures of different ages, as well as primary rat cardiomyocyte cultures and HL-1 cardiomyocyte cultures, successfully connected and exhibited propagating waves throughout the observed area. On a micro level, synchronizations of individual cells were studied using fluorescence microscopy with calcium sensitive dyes.
2. Materials and methods
2.1 Materials
All tissue culture media and serum were purchased from Invitrogen Corporation. All chemicals were purchased from Sigma, unless indicated otherwise.2.2 PDMS-mask fabrication and surface coating
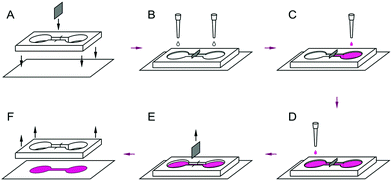
A polymerized PDMS layer (3–4 mm in width) was cut to a mask of two circular compartments (about 5 mm in diameter) connected by a thin channel (7–10 mm in length). An incision was made perpendicular to the channel, as shown in Fig. 1. The PDMS-mask was soaked in distilled water for at least 3 days, dried, and placed under ultraviolet radiation for 1–2 hours. A foil was placed at the incision to compartmentalize the channel. Both compartments and the channel were filled with a solution of human fibronectin (HF 20 μg ml−1, Human Fibronectin Thermo Fisher Scientific, Gibco cat #: 33016-015) and placed in a CO2 incubator overnight. After the solution of fibronectin was removed, the contents of the Petri dish were dried for cells patterning.2.3 Primary cultures of cardiomyocytes
All studies conformed to the Guide for the Care and Use of Laboratory Animals, published by the United States National Institutes of Health (Publication No. 85-23, revised 1996) and were approved by the Moscow Institute of Physics and Technology Life Science Center Provisional Animal Care and Research Procedures Committee, Protocol #A2-2012-09-02. In this work, we used enzymes adapted to the existing two-day protocol for the cardiac cell isolation (Worthington Isolation System) (http://www.worthingtonbiochem.com/NCIS/default.html). Rat cardiac cells were isolated from the ventricles of pups (1–5 days old), depending on the necessity for co-culturing. After isolation, the cells were maintained in 10% fetal bovine serum (FBS) in Dulbecco's modified Eagle's medium (DMEM). However, in the co-culture with HL-1 cells, all cells in the mask were maintained at 10% fetal FBS in the Claycomb medium.2.4 Generation of ChR2 expressing lentivirus
To generate a third generation ChR2-EYFP expressing lentivirus (pRRL-Ef1a-ChR2-EYFP), a ChR2-EYFP fragment from the pcDNA3.1/hChR2(H134R)-EYFP vector (kindly provided by K. Deisseroth) and an EF1α promoter fragment from pWPT-GFP (Addgene 12255) were cloned into the backbone pRRLSIN.cPPT.PGK (Addgene 12252, both kindly provided by D. Trono through Addgene). Lentiviral particles were prepared and as previously reported;14 they were kindly provided by K. Zimmermann and A. Pfeifer, Department of Pharmacology and Toxicology, University of Bonn.2.5 Cell culture and generation of a ChR2 expressing cardiomyocyte cell line
The HL-1 cardiomyocyte cell line derived from adult mouse atrial myocytes15 was kindly provided by W. C. Claycomb. The cultivation of cells was performed as previously described.15 To generate a ChR2 expressing HL-1 line, 1.2 × 10⁵ HL-1 cells were plated in a 3 cm culture dish and transduced one day later overnight with the ChR2-expressing lentivirus at an infection multiplicity of 50.2.6 Fluorescence activated cell sorting (FACS)
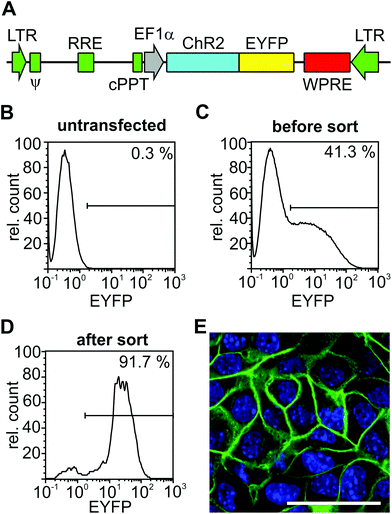
To obtain a ChR2-EYFP positive HL-1 cell line, cells were trypsinized and sorted for EYFP expression with a CyFlow space FACS machine equipped with a piezo-based CyFlow Sorter (Partec GmbH, Münster, Germany). EYFP expression was detected by excitation with a laser at 488 nm and collecting the emission through a 536/40 nm filter. Appropriate gates for sorting were chosen based on the analysis of wild-type HL-1 cells. Because the first round of FACS sorting led to only 72.5% EYFP positive cells (data not shown), a second round was performed after six passages of cells, resulting in 91.7% EYFP-positive cells (Fig. 2D).2.7 Multi-electrode array (MEA) recording and analysis
For recording local field potentials, 2.5 × 10⁵ ChR2-HL-1 cells were plated onto MEAs with 59 electrodes of 30 μm diameter and 200 μm interelectrode spacing (ThinMEA200/30iR-ITO, Multichannel Systems, Reutlingen, Germany) coated with 10 μg per ml fibronectin. After 24–48 h HL-1 cells were grown, confluent and local field potentials were recorded with an MEA amplifier and MC Rack 3.8.1 software (Multichannel Systems) at 10 kHz as reported earlier.16 The light intensity threshold for stable 1![[thin space (1/6-em)]](https://www.rsc.org/images/entities/char_2009.gif) :
:![[thin space (1/6-em)]](https://www.rsc.org/images/entities/char_2009.gif) 1 coupling was analyzed at 37 °C. For each illumination time (1, 2, 5, 10, 25, 50, and 100 ms), light intensities were increased in steps of ∼0.16 mW mm−2 consisting of 15 illumination pulses at a frequency of 2.5 Hz. The threshold for stable 1
1 coupling was analyzed at 37 °C. For each illumination time (1, 2, 5, 10, 25, 50, and 100 ms), light intensities were increased in steps of ∼0.16 mW mm−2 consisting of 15 illumination pulses at a frequency of 2.5 Hz. The threshold for stable 1![[thin space (1/6-em)]](https://www.rsc.org/images/entities/char_2009.gif) :
:![[thin space (1/6-em)]](https://www.rsc.org/images/entities/char_2009.gif) 1 coupling was defined as the lowest light intensity evoking field potentials at the 10 last pulses. Color-coded activation maps with isochronal lines were generated using a custom written program (Labview, National Instruments) by calculating the activation time of each electrode (minimum dV/dt) and interpolating electrodes with noisy signals. Isochronal lines were calculated after interpolating between electrodes.
1 coupling was defined as the lowest light intensity evoking field potentials at the 10 last pulses. Color-coded activation maps with isochronal lines were generated using a custom written program (Labview, National Instruments) by calculating the activation time of each electrode (minimum dV/dt) and interpolating electrodes with noisy signals. Isochronal lines were calculated after interpolating between electrodes.
2.8 Optical stimulation of MEAs
Local optical stimulation was performed using a microscope with a 10× objective (Axiovert 200 and Fluar 10× objective with a numerical aperture of 0.5, Zeiss) with a temperature-controlled LED module (Omicron, LEDMOD LAB 470 nm, Omicron Laserage) coupled via an optical fiber into a fluorescence condenser port (Till Photonics, Graefelfing, Germany). Stimulation triggers at various intensities were generated by a patch clamp amplifier and software (EPC10 and PatchMaster, HEKA, Lambrecht, Germany) and recorded with the MEA amplifier. The illumination area was 1.4 mm2 in this configuration. Light intensity was calibrated by measuring the power at the objective or at the MEAs (PM100 power meter and S130A sensor, Thorlabs).2.9 Cell patterning
In the experiments with cells of different origins, the cell suspension was consequently poured on the coverslips in the different sections of the PDMS mask at a density of 100 thousand cells per compartment with the time interval of 1 hour. Seeded cells were placed in a CO2 incubator. After 1–2 hours, the foil was removed. For the co-culture of cells at different ages of development, cardiomyocytes isolated from two day-old pups were seeded into different compartments with the necessary time interval and maintained in DMEM permanently.Joint cell growth without localization does not give appropriate information of the contacts between two cultures of cardiomyocytes. In this paper, for the above purpose, we developed a method based on a polydimethylsiloxane (PDMS) polymer mask. The mask has 2 apertures connected by a thin isthmus (Fig. 1). The co-culture was conducted with 3 different schemes:
1. Co-culture of neonatal rat cardiomyocytes of different ages.
2. Co-cultured neonatal rat cardiomyocytes and mouse atrial cardiomyocyte line HL-1 (NRVCM + HL-1).
3. Co-cultured neonatal rat cardiomyocytes and mouse atrial cardiomyocyte line HL-1 transfected with the light-gated ion channel channelrhodopsin-2 (NRVCM + ChR2-HL-1).
2.10 Immunofluorescence staining
Immunofluorescent staining of cardiomyocytes was performed using primary and secondary antibodies according to standard protocols. We used anti-α-actinin, anti-cardiac troponin T, and anti-connexin-43 primary antibodies for the specific labeling of cardiomyocyte and DAPI for labeling cell DNA. Photographs were taken using an inverted fluorescence microscope (Zeiss LSM 710).2.11 Optical mapping of excitation waves
The PDMS mask was removed after the cells formed a monolayer and a mechanical syncytium in the contact zone. Cells were loaded with the Ca2+-sensitive indicator Fluo-4-AM (4 μg ml−1) in 1 ml Tyrode for 35–40 minutes at room temperature in the dark.The Ca2+ signals were monitored using a high-speed imaging setup, Olympus MVX-10 fluorescent microscope equipped with high-speed EM-CCD camera (Andor 897-U). All videos were processed with ImageJ and Wolfram Mathematica using a custom-made temporal 8-term Daubechies 3 iteration wavelet shrinkage filter and Gaussian blurring for spatial de-noising (NIH, Maryland, USA, http://rsb.info.nih.gov/ij).
3. Results
3.1 Generation of cardiomyocyte cell line for optical stimulation
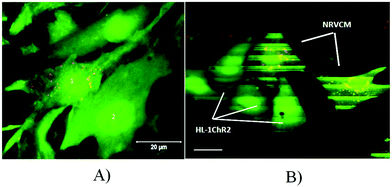
The HL-1 cell line is an immortalized cardiac muscle cell line derived from a mouse atrial cardiomyocyte tumor.15 We have chosen this cell line because of its ability to proliferate and to be passaged without losing its differentiated cardiac morphological, biochemical, and electrophysiological properties.15 Hence, monolayers of coupled cardiomyocytes can be easily generated on MEA and used to analyze the electrical activity. To be able to stimulate HL-1 cells by light, we generated a HL-1 cell line that expresses the non-selective cation channel ChR2 which opens upon illumination with blue light (470 nm). We have chosen ChR2 with the H134R mutation because of its higher current amplitudes17 and because we have previously used it to pace stem-cell derived cardiomyocytes in vitro and the hearts of transgenic mice in vivo by localized illumination.16 For the stable integration of ChR2 at high expression levels, we generated a ChR2-expressing lentivirus with the ubiquitously active promoter elongation factor 1α (EF1α) driving expression of ChR2 in fusion with EYFP (Fig. 2A). After the transduction of HL-1 cells with this lentivirus overnight, FACS analysis showed that approximately 40% of cells became EYFP positive (Fig. 2B and C). To enhance the percentage of cells expressing ChR2-EYFP, we performed two rounds of FACS with culture and expansion of sorted cells in between. This sorting strategy led to over 90% of cells with ChR2-EYFP expression (Fig. 2D) and membrane-bound EYFP signals (Fig. 2E) as expected for ChR2-EYFP.3.2 Optical pacing of ChR2-expressing cardiomyocytes on MEAs
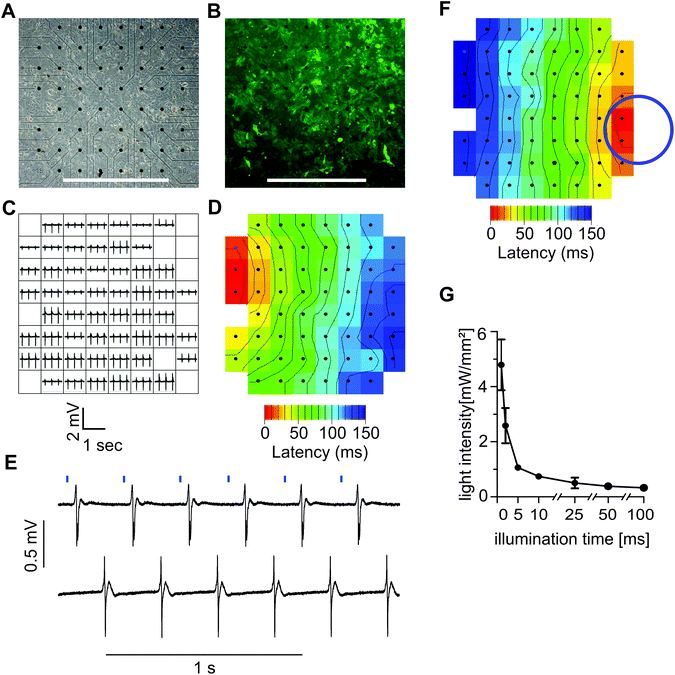
To test the function of ChR2 expressing HL-1 cells, we plated the transgenic cells on MEAs where they formed a confluent monolayer (Fig. 3A) with bright EYFP signals (Fig. 3B). Local field potentials of varying shape and size could be recorded from almost all 59 electrodes proving the ability of the monolayer to generate spontaneous electrical activity (Fig. 3C). To identify the site where spontaneous pacemaking is initiated and to analyze electrical coupling, we performed the latency analysis of the activation times of local field potentials. In a representative example, the pacemaker region was located at the upper left side and the conduction wave propagated to the right (Fig. 3D). Pulsed illumination of a confined area of the MEA with blue light (475 nm) reliably evoked field potentials at a 1![[thin space (1/6-em)]](https://www.rsc.org/images/entities/char_2009.gif) :
:![[thin space (1/6-em)]](https://www.rsc.org/images/entities/char_2009.gif) 1 coupling (Fig. 3E). The latency analysis of local activation times proved that electrical activity started at the site of illumination (Fig. 3F). To identify which combination of light intensity and light duration was effective for reliable pacing, we varied light pulse durations from 1 to 100 ms and adjusted the light intensity until a 1
1 coupling (Fig. 3E). The latency analysis of local activation times proved that electrical activity started at the site of illumination (Fig. 3F). To identify which combination of light intensity and light duration was effective for reliable pacing, we varied light pulse durations from 1 to 100 ms and adjusted the light intensity until a 1![[thin space (1/6-em)]](https://www.rsc.org/images/entities/char_2009.gif) :
:![[thin space (1/6-em)]](https://www.rsc.org/images/entities/char_2009.gif) 1 light to field potential response was observed. We found that illumination durations as short as 1 ms were sufficient for pacing when using high light intensities of 4.8 ± 0.92 mW mm−2 (n = 4) (Fig. 3G). The required intensity could be reduced when using longer light pulses, and intensities as low as 0.33 ± 0.92 mW mm−2 (n = 4) were sufficient for pacing with 100 ms pulses (Fig. 3G).
1 light to field potential response was observed. We found that illumination durations as short as 1 ms were sufficient for pacing when using high light intensities of 4.8 ± 0.92 mW mm−2 (n = 4) (Fig. 3G). The required intensity could be reduced when using longer light pulses, and intensities as low as 0.33 ± 0.92 mW mm−2 (n = 4) were sufficient for pacing with 100 ms pulses (Fig. 3G).
3.3 Formation of intercultural contact
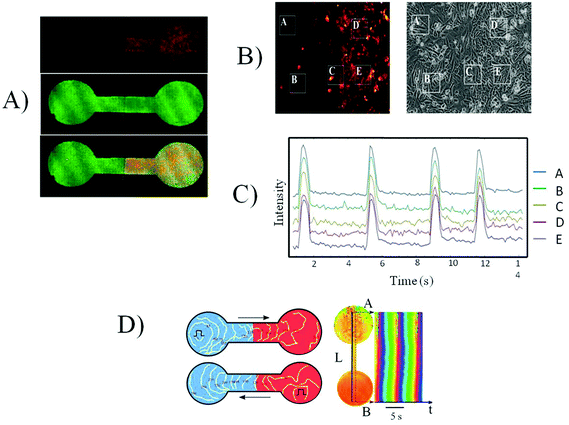
A thin partition of foil was inserted into the slot made in the channel connecting the two halves of the PDMS mask, as shown in Fig. 1. This partition provided a clear line of separation between the two cultures of cardiomyocytes, seeded on the different parts of the mask either simultaneously or with the varying time interval. After a designated period of time, the foil was removed, and the two grown cultures were put into contact. In the experiments shown in Fig. 4, the cells were seeded first at the right area of the mask and then in the left area. The cells seeded second were marked by a red fluorescent dye (Molecular Probes CellTracker Red, 577/602 nm). All cells also were stained for the cardiac-specific protein troponin T. Fig. 4A shows that in the right half of the mask no cells with the red cell tracker are present, although cardiomyocytes efficiently fill all the space in the mask (Fig. 4A). This confirms that our method allows a perfect separation of two cell cultures with a small site of close contact.3.4 Contractile merging of two cultures
The grown cultures in the separated parts of the mask usually exhibited spontaneous activity and non-correlated contractions. Immediately after removing the foil separator, the contractions in both parts of the mask continued non-coherently, and synchronized on the second day after being put in contact. Fig. 4B and C illustrates monitoring of the mechanical activity in several regions of the culture layer near the border between two kinds of cells. One can see that contractions occur synchronously in all four regions.3.5 Merging two cultures of different ages
In a series of experiments, the formation of functional contact between two cultures of different ages was studied with the aid of the system shown in Fig. 1. Isolated neonatal rat cardiomyocytes were seeded into different compartments with a delay of one, two, and three days. The cells seeded second were labeled by thered cell tracker. The foil partition was removed one day after seeding the second population of cells, and the cells were cultured for two more days before optical mapping.A stimulating electrode was placed in either part of the merged culture. The excitation wave propagated through the layer of cells and crossed the border between the two cultures of different ages as seen on the activation map (Fig. 4D). Besides the electrical stimulation, in a number of experiments, the spontaneous activity of the culture was observed and recorded. In all experiments, the excitation waves successfully passed the border between cultures from both sides (data not shown).
Fig. 4D also shows time–space plots from a video of the propagating waves. The pseudocolors correspond to the different phases of intercellular calcium release (calcium upstroke was used for monitoring the excitation). One can see that there is no discontinuity at the border between cultures.
3.6 Merging of NRVCM and HL-1 cultures
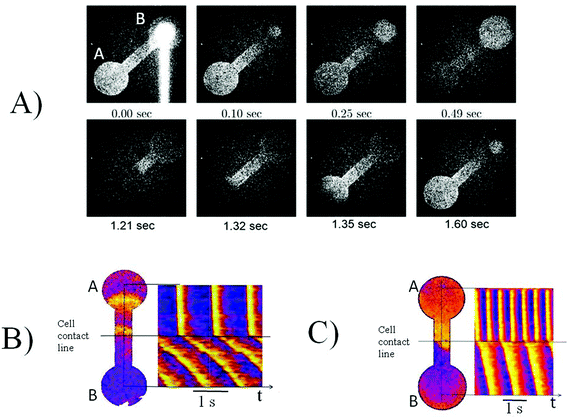
Since the cultures of the same origin merged successfully, we tested the merging of two excitable cardiac cultures from different species: neonatal rat cardiomyocytes and HL-1 cells, which are descendants of atrial mice cells. We applied the same experimental scheme as described above. Similar to the differently aged cultures, the NRVCM + HL-1 cultures merged on the second day after removing the separating wall. Fig. 5 shows the excitation conduction between two cultures on day 1 after seeding HL-1 cells to the primary culture. Excitation waves initiated either spontaneously or using the stimulating electrode, successfully propagating between two cultures (Fig. 5B). However, the propagating wave speed in the cultures differed significantly: 18 mm s−1 for the primary culture and 4.6 mm s−1 for the HL-1 cultures as seen on the time–space plot (Fig. 5B).3.7 Merging of NRVCM and ChR2-HL-1 cultures
Next we used a light-induced stimulation of the excitation to exclude possible electronic disturbances of the propagating waves by electrical pulses from the stimulating electrode. This was made possible by using the photo-sensitized HL-1 culture with transfected channelrhodopsin 2 (ChR2). The ChR2-HL-1 culture was stimulated by short (20 ms) light pulses from a blue (480 nm) photodiode. Fig. 5A illustrates the propagation of the excitation wave, initiated by light pulses between cultures.3.8. Special features of excitation propagation in the contact zone
The efficiency of the electrical connection between two different cultures was dependent on the frequency of the propagating waves. At some frequency range of stimulation, either by an electrode or by light pulses, the partial blocking of the excitation waves was observed at the border between cultures. In the frequencies ranging between 1.4 and 2.0 Hz, every second excitation wave propagating from NRVCM to HL-1 was blocked (Fig. 5C). However, in the same frequency range, waves propagated from the HL-1 side to the NRVCM side with no blockage (data not shown). In the frequency range 2.0–2.6 Hz, occasional blockage of the waves also occurred when propagating from the HL-1 to the NRVCM side and 2.6 Hz and higher frequencies were not captured by the cell culture on either side.3.9 Cell coupling: micro level
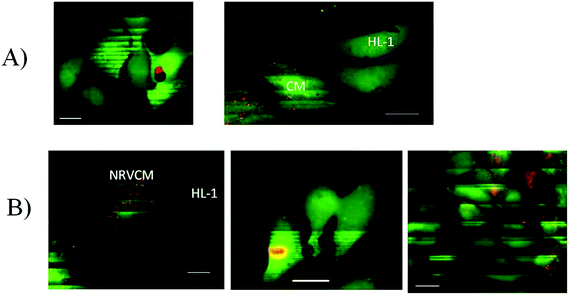
The above experiments show excitation conduction between two different populations of cardiac cells taking place in the confluent culture layers. To analyze the interaction among cells on a cellular level, the cells were seeded sparsely at about 104 per cm2, compared to normal seeding for the confluent monolayer formation, about 105 cells per cm2. In effect the majority of cells were separated from others but some cells happened to be in direct contact and the excitation conduction between these cells was analyzed. In order to distinguish between cells of different origin, the cells were marked by cell trackers (Molecular Probes) of different colors. We tested six different colors, and we found that CellTracker Red caused minimal damage. Therefore, we eventually marked one type of cell with red dots and did not mark the others (Fig. 6A).The generation of excitation was observed as described above, by loading cells with Fluo-4, which allowed recording an excitation-induced Ca2+ transient using a confocal microscope (Zeiss LSM 710). The excitation coupling between different cells was checked using slow scanning (Fig. 6B), which allowed recording several excitation-induced Ca2+ transients in the observed cells in a single captured image, and these transients were visible in the resulting slowly scanned image by horizontal stripes of bright fluorescence. The frame size in this case is 512 × 512 pixels, and the scanning speed was set to the minimum resulting in the scanning of the entire frame during 94 s. During the scanning process, cells were repeatedly excited (either spontaneously or by the external electrical stimulation). Although the entire excited cell appears visually bright for about 0.4 s, since the scanning speed was slow, only a narrow part of the cell image (exactly 512/94 × 0.5 = 2.2 lines) was scanned during the excitation-related fluorescence transient. Each excitation during the scan results in a bright stripe on the image of the excitable cell. If the cell does not excite, it has no bright stripes on the image obtained. Since the population of cells was sparse, the propagation of the excitation in the entire culture was not maintained; however, excitation spread in the clusters of contacting cells. The scanning process was performed horizontally, scan lines being added from the top to bottom with constant speed. Thus, knowing the scanning speed, one can mark the moments of time corresponding to the bright stripes, i.e. the moments of time when the cell was excited. If the vertical positions of bright stripes in different cells coincide, we conclude that the cells were excited synchronously.
Fig. 6A shows adjacent silent cells and Fig. 6B demonstrates the repeated excitation of cells due to the spontaneous activity of the culture. One can see corresponding bright stripes on the labeled NRVCM cells and on the unlabeled HL-1 cells. The vertical positions of the stripes correspond to the times of recording, and the matching positions of the stripes in different cells are the evidence of their synchronized excitation. Note that the synchronization of cell excitation was observed in 72 ± 5% (n = 186) of cell clusters, perhaps because randomly seeded cells may not always develop sufficient coupling, for example, if they initially are seeded too far from each other. Several scenarios of synchronized–non-synchronized cells are shown in Fig. 7.
4. Discussion
While there have been a few reports of significant functional improvement of contractility due to cell engraftment, for the most part these therapies have resulted in a modest (if any) improvement in systolic function.18 Because the majority of transplanted pluripotent cells die within a few weeks19 and there is no solid evidence of cardiogenic and proliferative potential, all benefits are believed to be paracrine mediated. A possible failure of grafted myocardial cells to establish a reliable electrical coupling with the host myocardium represents one of the major concerns while designing the successful regeneration procedure and repair of cardiac muscle.Our experiments show that excitation-induced Ca2+ transients in cardiomyocytes of different developmental ages and different origins can synchronize. The synchronization is confirmed in the cell populations (or tissue parts) and on the single cell level. On a “macro” level, the experiment was designed in such a way that possible artifacts due to the electrotonic effect20–22 on cell excitation are excluded. The mask used for the tissue culture allowed us to separate the main populations of different cells with a narrow and long channel. Moreover, in the experiments with primary cultures of NRVCM and ChR2 expressing HL-1 cells, stimulation by light pulses was used to initiate an excitation wave only in the light-sensitive population. On a “micro” level, spontaneous activity in the cell culture was mainly recorded, which also allowed us to rule out the possible simultaneous stimulation of different cells by the applied electric field.
The synchronization of cell excitation requires that the cells be electrically or mechanically coupled. While we cannot completely exclude mechanical coupling from our experiments, cells usually exhibited minimized contraction activity when transferred from the DMEM into the pure Tyrode solution, which was used for the observations under the confocal microscope. For that purpose, the HL-1 cells were incubated in the medium with epinephrine excluded. The absence of significant cell contractions is also evidenced by the slow scanning images which give sharp edges of the cell image, which otherwise would be fuzzy due to multiple contractions during the recording. The electrical coupling between cardiac cells is believed to be possible by the formation of gap junctions.6,8 However, an alternative explanation states that the formation of real pores between excitable cells is not obligatory for their electrical connection.9 Our experiments do not support or discourage any of the points of view above; we are proving the fact that a synchronized excitation develops in excitable cardiac cells of different origins when put in physical contact. Since the organized spread of the excitation in the cardiac tissue is a prerequisite for organized contraction of the heart, this finding might be important for regenerative medicine, as a proof of concept that grown biological implants would be able to functionally merge with the host tissue.
5. Conclusion
The problem of functionally merging graft cells with the host tissue has at least three major points:- First, are the graft cells able to electrically couple and synchronize with the host tissue yet?
- Second, what is the molecular level mechanism of the graft–host coupling?
- Third, does the border between the implanted cells and the host tissue create any arrhythmogenic effect, such as anisotropy of propagation, frequency-dependent conduction block, etc.
In the present study, we mainly deal with the first question. The second question is addressed elsewhere in numerous publications. As for the third point, we found that some particularities of the excitation wave propagation across the border between the populations of different cells may exist; however, a detailed study of these effects and their possible arrhythmogenicity is beyond the scope of the presented work and studies will be performed further.
Acknowledgements
We thank K. Deisseroth (Stanford University, USA) for providing the pcDNA3.1/hChR2(H134R)-EYFP plasmid, D. Trono, Ecole Polytechnique Federale de Lausanne, Lausanne, Switzerland for providing lentivirus plasmids through Addgene, W. C. Claycomb (New Orleans, USA) for providing the HL-1 cell line, K. Zimmermann and A. Pfeifer (Institute of Pharmacology and Toxicology, University of Bonn, Germany) for preparing the pRRL-Ef1a-ChR2-EYFP lentivirus and M. Breitbach (Institute of Physiology 1, University of Bonn) for help with the cell sorting.This work was supported by the German Research Foundation (SA 1785/5-1 and Research Training Group 1873 to P. S.) in the part related to the obtaining of HL-1 cells expressing ChR2 and their verification. The work was supported by the Russian Science Foundation grant # 16-15-10322 in the part related to the study of co-cultured tissue.
References
- M. Lux, B. Andree, T. Horvath, A. Nosko, D. Manikowski and D. Hilfiker-Kleiner, et al., In vitro maturation of large-scale cardiac patches based on a perfusable starter matrix by cyclic mechanical stimulation, Acta Biomater., 2016, 30, 177–187 CrossRef CAS PubMed.
- N. L. Tulloch and C. E. Murry, Trends in cardiovascular engineering: Organizing the human heart, Trends Cardiovasc. Med., 2013, 23, 282–286 CrossRef PubMed.
- S. K. Bhatia, Tissue engineering for clinical applications, Biotechnol. J., 2010, 5, 1309–1323 CrossRef CAS PubMed.
- E. G. Roberts, E. L. Lee, D. Backman, J. A. Buczek-Thomas, S. Emani and J. Y. Wong, Engineering Myocardial Tissue Patches with Hierarchical Structure-Function, Ann. Biomed. Eng., 2015, 43, 762–773 CrossRef PubMed.
- I. Elloumi-Hannachi, M. Yamato and T. Okano, Cell sheet engineering: a unique nanotechnology for scaffold-free tissue reconstruction with clinical applications in regenerative medicine, J. Intern. Med., 2010, 267, 54–70 CrossRef CAS PubMed.
- H. J. Jongsma and R. Wilders, Gap junctions in cardiovascular disease, Circ. Res., 2000, 86, 1193–1197 CrossRef CAS PubMed.
- R. G. Gourdie, C. R. Green, N. J. Severs and R. P. Thompson, Immunolabeling patterns of gap junction connexins in the developing and mature rat-heart, Anat. Embryol., 1992, 185, 363–378 CrossRef CAS PubMed.
- R. Veeraraghavan, R. G. Gourdie and S. Poelzing, Mechanisms of cardiac conduction: a history of revisions, Am. J. Physiol.: Heart Circ. Physiol., 2014, 306, H619–HH27 CrossRef CAS PubMed.
- N. Sperelakis, An electric field mechanism for transmission of excitation between myocardial cells, Circ. Res., 2002, 91, 985–987 CrossRef CAS PubMed.
- A. G. Kleber and Y. Rudy, Basic mechanisms of cardiac impulse propagation and associated arrhythmias, Physiol. Rev., 2004, 84, 431–488 CrossRef CAS PubMed.
- G. E. Morley, D. Vaidya, F. H. Samie, C. Lo, M. Delmar and J. Jalife, Characterization of conduction in the ventricles of normal and heterozygous Cx43 knockout mice using optical mapping, J. Cardiovasc. Electrophysiol., 1999, 10, 1361–1375 CrossRef CAS PubMed.
- I. R. Efimov, V. P. Nikolski and G. Salama, Optical imaging of the heart, Circ. Res., 2004, 95, 21–33 CrossRef CAS PubMed.
- K. Agladze, M. W. Kay, V. Krinsky and N. Sarvazyan, Interaction between spiral and paced waves in cardiac tissue, Am. J. Physiol.: Heart Circ. Physiol., 2007, 293, H503–HH13 CrossRef CAS PubMed.
- A. Hofmann, D. Wenzel, U. M. Becher, D. F. Freitag, A. M. Klein and D. Eberbeck, et al., Combined targeting of lentiviral vectors and positioning of transduced cells by magnetic nanoparticles, Proc. Natl. Acad. Sci. U. S. A., 2009, 106, 44–49 CrossRef CAS PubMed.
- W. C. Claycomb, N. A. Lanson, B. S. Stallworth, D. B. Egeland, J. B. Delcarpio and A. Bahinski, et al., HL-1 cells: A cardiac muscle cell line that contracts and retains phenotypic characteristics of the adult cardiomyocyte, Proc. Natl. Acad. Sci. U. S. A., 1998, 95, 2979–2984 CrossRef CAS.
- T. Bruegmann, D. Malan and M. Hesse, et al., Optogenetic control of heart muscle in vitro and in vivo, Nat. Methods, 2010, 7, 897–U45 CrossRef CAS PubMed.
- G. Nagel, M. Brauner, J. F. Liewald, N. Adeishvili, E. Bamberg and A. Gottschalk, Light activation of channelrhodopsin-2 in excitable cells of Caenorhabditis elegans triggers rapid Behavioral responses, Curr. Biol., 2005, 15, 2279–2284 CrossRef CAS PubMed.
- K. A. Gerbin and C. E. Murry, The winding road to regenerating the human heart, Cardiovasc. Pathol., 2015, 3, 133–140 CrossRef PubMed.
- K. Malliaras, R. R. Makkar, R. R. Smith, K. Cheng and E. Wu, et al., Intracoronary Cardiosphere-Derived Cells After Myocardial Infarction, J. Am. Coll. Cardiol., 2014, 63, 110–122 CrossRef PubMed.
- M. E. Sakson, F. F. Bukauskas, N. I. Kukushkin and V. V. Nasonova, Electrotonic distribution on the surface of cardiac structures, Biofizika, 1974, 19, 1045–1050 CAS.
- M. Tarr and N. Sperelakis, Weak electrotonic interaction between contiguous cardiac cells, Am. J. Physiol., 1964, 207, 691–700 CAS.
- N. Sperelakis, Combined electric field and gap junctions on propagation of action potentials in cardiac muscle and smooth muscle in PSpice simulation, J. Electrocardiol., 2003, 36, 279–293 CrossRef.
| This journal is © The Royal Society of Chemistry 2017 |

