Enhanced peroxidase-like activity of Mo-doped ceria nanoparticles for sensitive colorimetric detection of glucose†
Xue
Jiao
ab,
Wanyi
Liu
a,
Di
Wu
a,
Wenhao
Liu
a and
Hongjie
Song
 *b
*b
aCollege of Pharmacy, Zunyi Medical University, Zunyi, Guizhou 563000, China
bCollege of Chemistry, Sichuan University, Chengdu, 610064, China. E-mail: songhj@scu.edu.cn; Tel: +86-28-85412398
First published on 16th November 2017
Abstract
The development of highly efficient nanomaterial-based mimetic enzymes is much needed to replace natural enzymes due to their low cost, high stability and efficient catalytic ability. Herein, multiple Mo-doped CeO2 nanoparticles (Mo/CeO2 NPs) with different molar ratios of Mo were synthesized using a facile microwave-assisted method. For characterizing the as-prepared Mo/CeO2 NPs, XRD, TEM, HRTEM, BET and XPS have been performed systematically. The peroxidase-like activity of Mo/CeO2 NPs was investigated, and they exhibited enhanced peroxidase-like activity in comparison to that of pure CeO2 NPs, the best peroxidase-like activity was obtained for the Mo/CeO2 NPs when the molar ratio of Mo was 9%. On the basis of the high activity of Mo/CeO2 NPs, the reaction provides a simple, sensitive and selective method for colorimetric detection of glucose with the detection limit of 4 × 10⁻⁷ mol L−1 and in a dynamic range from 5 × 10⁻⁷ to 5 × 10⁻⁵ mol L−1. This work will pave a way for high throughput synthesis of other ultra-small doped metal oxide nanoparticles, which have bright prospects in biomedical analysis.
Introduction
Natural enzymes with high substrate specificity and efficiency under mild reaction conditions have been widely studied and applied in biotechnology, clinical diagnosis, biosensing, environmental science, the food industry, etc.1–3 In particular, horseradish peroxidase (HRP) is one of the most important natural enzymes, which can be used in the detection of H2O2 and glucose, and thus HRP has enormous potential in biomedicine or environmental monitoring.4 However, the intrinsic drawbacks of natural enzymes, such as easy denaturation and high costs in preparation and purification, have hampered their widespread applications.5,6 In order to overcome the limitations, great efforts have been devoted to exploring various artificial enzyme mimetics based on nanomaterials. Compared with natural enzymes, peroxidase-like nanomaterials exhibit many advantages such as good stability, easy preparation, low cost, great resistance to harsh chemical environments and tunable catalytic activities. Various nanomaterials have been evaluated as peroxidase-like mimetics, including ferromagnetic-based nanomaterials,7–10 noble metal nano-particles,11–13 carbon-based nanomaterials,14–17 graphene dots18 and metal oxide nanomaterials.19–26Among various peroxidase-like nanomaterials, nanoceria has been attracting particular attention due to its unique physical and chemical properties.27–32 The catalytic activity of CeO2 is mainly ascribed to the reversible switch between Ce4+ ↔ Ce3+ and the presence of associated oxygen vacancies. Therefore, there has been increasing interest focused on the wide usage of CeO2 as peroxidase mimetics and subsequent application in bioanalysis.30,33–35 In order to improve the catalytic activity of CeO2, obtaining more surface defects and adjusting the Ce4+/Ce3+ ratio via homogeneous doping with suitable heteroatoms has been developed as a feasible strategy;36–38 the improvement in catalytic activity is due to the exchange of oxygen in the oxide network by decreasing the energy barrier for oxygen migration and the existence of more surface defects.39 Multiple metal elements, such as Co,38 Mn,40 Cu,41 Fe36 and Ti42, have been used as dopants for CeO2 to change the structure and surface, which can efficiently increase the concentration of oxygen vacancies, as well as enhance peroxidase mimic activity. Particularly, several reports have proved that Mo could promote the catalytic activity and thermal stability of the catalyst.37,43 Wang et al.37 reported that Mo-doped CeO2 solid solution modified Pt catalysts exhibited remarkable catalytic activity and stability, showing superior performance compared to the commercial Pt/C-JM catalyst. Zhan et al.43 reported that CeMo (0.3) hollow microspheres exhibited much better NH3-SCR catalytic activity, stability and H2O resistance in the low-temperature region than pure CeO2 microspheres. To the best of our knowledge, there were few studies about the peroxidase mimetic catalytic properties of Mo-doped CeO2 NPs (Mo/CeO2 NPs).
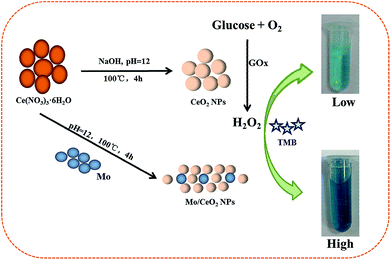
Herein, Mo/CeO2 NPs with high yield, a narrow size range and high catalytic activity are synthesized via a facile microwave-assisted synthesis route. Compared with other preparation methods, microwave-assisted methods can obtain Mo/CeO2 NP catalysts with a higher surface area and higher crystallinity44,45 at lower temperature. Besides, it was found that the Mo/CeO2 NPs possess enhanced intrinsic peroxidase-like activity in contrast to the pure CeO2 NPs without being doped with Mo. The effects of doping with Mo on the material structure, properties and catalytic performance as peroxidase mimics were discussed in detail, and reaction kinetics and mechanisms of obtained Mo/CeO2 NPs were also investigated. Based on the greatly enhanced peroxidase-like activity, a novel facile colorimetric method with a wide linear range and low detection limit for glucose is further developed (Scheme 1).
Experimental
Chemicals and materials
Cerium nitrate (Ce(NO3)3·6H2O, 99.9%), ammonium molybdate tetrahydrate (H24Mo7N6O24·4H2O, 99.9%), glucose, glucose oxidase (GOx, ≥180 U mg−1), 3,3,5,5-tetramethylbiphenyl dihydrochloride (TMB·2HCl) and horseradish peroxidase (HRP, ≥300 U mg−1) were purchased from Aladdin Chemical Reagent Co., China. Ammonium hydroxide (25–28 wt%, NH3 H2O), hydrogen peroxide (30 wt%, H2O2), acetic acid (HAc), sodium acetate (NaAc), disodium hydrogen phosphate (Na2HPO4), and sodium dihydrogen phosphate (NaH2PO4) were purchased from Kelong Reagent Co. (Chengdu, China). All chemicals were of analytical grade and used as received without further purification. Deionized water (18.25 MΩ cm) was obtained using a ULUPURE Water Purification System (NEX UP 1000) and was used to make all aqueous solutions. Human serum samples were obtained from the Affiliated Hospital of Zunyi Medical College (Zunyi, China).Synthesis of Mo/CeO2 NPs
Mo/CeO2 NPs with various contents of Mo (3, 6, 9, 12, 15 and 18%) were prepared via a microwave-assisted synthesis route; the obtained products were labeled as 3Mo/CeO2, 6Mo/CeO2, 9Mo/CeO2, 12Mo/CeO2, 15Mo/CeO2 and 18Mo/CeO2. In each experiment, the desired Mo doping atomic percentage (at%) was calculated according to the following equation:In a typical synthesis, for 6% Mo-doped CeO2 NPs, 0.7903 g of Ce(NO3)3·6H2O and 0.2224 g of H24Mo7N6O24·4H2O were dissolved in 20 mL distilled water and kept stirring for 10 minutes. Then, 0.1 mol L−1 NaOH solution was slowly added to the above solution until the pH value reached 12 and aged for 0.5 h under vigorous stirring. Afterwards, the resultant mixture was transferred into a 100 mL microwave-reactor for 4 h at 100 °C. The precipitate was collected by centrifugation, washed with distilled water and ethanol several times until neutrality. The sample was dried at 80 °C for 12 h in a vacuum oven for the following experiments and characterizations. The synthesis conditions were optimized through adjusting the reaction temperature, reaction time and reaction pH respectively. CeO2 was prepared by the same method without doping with Mo.
The dried nanoparticle powders were dispersed in ultra-pure water and then the mixture was homogenized by ultrasonication (80 W) for 30 min. The concentration of CeO2 NPs was about 0.6 mg mL−1 for the following experiments.
Characterization and instruments
The micro-wave reactor was Discover SP Installation from GEM Company. The UV-vis absorption spectra were obtained on aqueous dispersions at room temperature using a TU-1901 spectrophotometer (Persee). Powder X-ray diffraction (XRD) measurements were performed using an X'Pert Pro X-ray diffractometer (Philips) with Cu Kα radiation (λ = 1.5406 Å). The TEM, HRTEM images were obtained from a Tecnai G2F20 S-TWIN (FEI). X-ray photoelectron spectroscopy (XPS) was performed with an XSAM 800 Electron Spectrometer (Kratos) using monochromatic Mg Kα radiation. The Brunauer–Emmett–Teller (BET) surface area and the pore size distribution of the materials were determined using N2 adsorption and desorption (QUADRASORB SI, Quantachrome, USA) at 77 K over a relative pressure ranging from 0.050 to 0.99.Peroxidase-like activity of Mo/CeO2 NPs
The peroxidase-like activity of the CeO2 NPs, Mo/CeO2 NPs and HRP were evaluated in the catalysis of peroxidase substrate TMB·2HCl in the presence of H2O2. The detailed process: the mixtures including the catalyst (10 μL Mo/CeO2 NPs, 10 μL CeO2 NPs or 1.0 ng HRP) in 2.0 mL 0.2 mol L−1 acetate buffer, with 5 mM TMB·2HCl as the substrate in the presence of H2O2 with a concentration of 10 mM were incubated in a water bath for 30 min at 45 °C. The UV absorbance was recorded at 652 nm after reaction for 30 min to reach the stable state. The influences of pH or temperature on the catalytic activity of the catalyst (Mo/CeO2 NPs, CeO2 NPs, and HRP) were measured according to the above assay, except that the pH (2.0–12.0) or temperature (25–80 °C) of the reaction system was changed, respectively. The Mo/CeO2 NPs were incubated with different concentrations of H2O2 at 45 °C to determine their H2O2 concentration-related catalytic activity.The reaction kinetics measurements were carried out in time course mode by monitoring the absorbance change at 652 nm with one minute intervals using a Perkin Elmer UV spectrophotometer. The experiments were carried out at 45 °C with 10 mL 0.6 mg mL−1 Mo/CeO2 solution or 0.6 mg mL−1 CeO2 in 2.0 mL reaction buffer (0.2 mol L−1 NaAc, pH 4.0) with 5 mM TMB·2HCl as the substrate, the H2O2 concentration was 50 mM for Mo/CeO2 and CeO2 NPs. The Michaelis–Menten constant was calculated from the Lineweaver–Burk double reciprocal plot based on the equation 1/v = (Km/Vmax) × (1/[S]) + 1/Vmax, where v is the initial reaction velocity, Km is the Michaelis–Menten constant, Vmax is the maximum reaction velocity, and [S] is the concentration of the substrate.
Glucose detection using Mo/CeO2 NPs as peroxidase mimetics
Firstly, 10 μL of GOx (10 mg mL−1) and 200 μL glucose of different concentrations in 10 mM Na2HPO4 buffer (pH = 7.0) were incubated at 37 °C for 30 min; then, 10 μL of Mo/CeO2 NP stock solution (0.6 mg mL−1), 500 μL of TMB·2HCl (5 mM), and 1680 μL of acetate buffer (0.2 M, pH 4.0) were successively added to the above glucose reaction solution. Finally, the mixed solution was incubated in a 55 °C water bath for 30 min, and the absorbance was measured at 652 nm. 5 mM maltose, 5 mM D-galactose, 5 mM sucrose, 5 mM sorbose, 5 mM fructose, 5 mM dopamine and 5 mM uric acid were used instead of glucose for the selectivity experiment.Results and discussion
Characterization of the as-synthesized Mo/CeO2 NPs
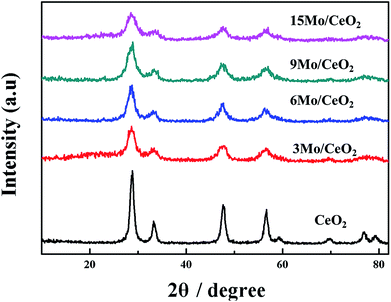
The formation of the special structure of the catalyst is strongly dependent on the preparation method. Mo/CeO2 NPs were fabricated using a simple single-step microwave method that did not employ any surfactant or stabilizer. Microwave irradiation, which could achieve rapid and homogeneous heating energy, was an excellent strategy to fabricate metal nanoparticles with narrow size distribution. Nanoparticles with high catalytic activity can be obtained by adjusting the reaction pH value and the mixing ratio of Mo (Fig. S1a and b†). The microwave temperature and time played important roles in the Mo/CeO2 NPs synthesis, which were demonstrated to optimize experiments (Fig. S1c and d†). Certainly, Mo/CeO2 NPs with high catalytic activity were synthesized under the optimum reaction conditions (pH 12, doping ratio 9%, the temperature is 100 °C for 4 h).Fig. 1 shows the XRD patterns of CeO2 and Mo-doped CeO2 samples with different Mo doping ratios (3%, 6%, 9% and 15%). Pure CeO2 NPs exhibited diffraction peaks at about 28.76°, 33.16°, 47.56°, 56.59° and 59.08° corresponding to the (111), (200), (220), (311) and (222) planes, which can be attributed to the cubic fluorite structured ceria [JCPDS file, no. 34-0394].37 All characteristic diffraction peaks of each Mo-doped CeO2 sample are indexed to the fluorite cubic structure of CeO2 which has no diffraction peaks corresponding to oxidized molybdenum species. The XRD patterns of Mo-doped CeO2 proved that Mo species were dispersed on the surface of cubic CeO2 in the form of relatively small crystallites or existed as amorphous species. The peak intensity decreased gradually and the slight increase in the peak width with increasing the Mo doping ratio, indicating that the Mo species can inhibit the particle growth of CeO2. The average diameters of the five CeO2 samples prepared, evaluated by means of the Scherrer formula,46 are about 9.3, 5.4, 5.1, 5.7 and 7.3 nm for the Mo-doped CeO2 NPs obtained with an increase in the Mo/Ce ratio from 0% to 15%, respectively. The calculated size of 15Mo/CeO2 NPs increased, which can be attributed to the agglomeration. Then we can conclude that the optimum doping rate of Mo is 9%. The 9Mo/CeO2 NPs contain smaller CeO2 crystallites than others products. All the Mo/CeO2 NPs mentioned in the following experiment are Mo/CeO2 NPs with a doping ratio of 9%, abbreviated as 9Mo/CeO2 NPs.
Moreover, the N2 adsorption–desorption performance of CeO2 NPs and 9Mo/CeO2 NPs was analyzed to observe their surface area and the pore structures (Fig. 2). The BET surface areas of CeO2 NPs and 9Mo/CeO2 NPs can be obtained as 98.95 and 89.73 m2 g−1, respectively. Doping with Mo is responsible for the slight reduction of the specific surface area of this sample. However, the average pore radius estimated from the Barrett–Joyner–Halenda (BJH) method was about 18.07 and 29.92 nm, increasing the wide pore radius of the 9Mo/CeO2 NP sample is indicative of the role played by cerium–molybdate and to its partial deposition inside the micropores creating their own pore system and thus enhancing the pore radius.47 However, the BET surface area of the Mo/CeO2 NPs is smaller than those of the CeO2 NPs. This result suggests that the surface area is not the only factor that affects the activity of Mo/CeO2 NP based catalysts for enzyme-mimic catalytic reactions; pore size and active component dispersion could also influence the enzyme-mimic catalytic activity.
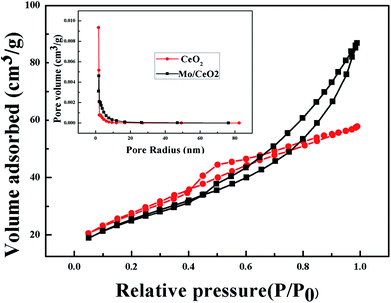 | ||
| Fig. 2 Nitrogen adsorption–desorption isotherms and pore size distributions (inset) of 9Mo/CeO2 NPs (black) and CeO2 NPs (red). | ||
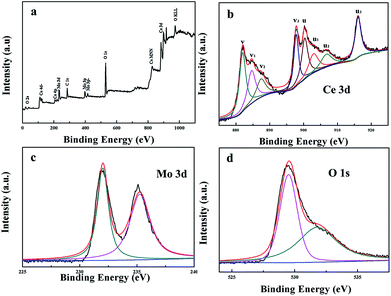
The oxidation states and compositions of the as-prepared 9Mo/CeO2 NP catalysts can be obtained using XPS technology. Fig. 3 shows the survey scan for representative 9Mo/CeO2 NPs. Ce, Mo, and O peaks are observed in Fig. 3a with the absence of any other elements. Fig. 3b is used to identify Ce 3d XPS peaks, where v and u indicate the spin–orbit coupling 3d5/2 and 3d3/2 respectively. The three pairs of peaks (v, u; v2, u2; and v3, u3) arise from the Ce 4p oxidation state. The couple (v1, u1) corresponds to the Ce 3p oxidation state. Therefore, a mixture of Ce 3p/Ce 4p oxidation states exists on the surface of the sample,48 which is crucial to the formation of oxygen vacancies, unsaturated chemical bonds and a catalysis cycle. The O 1s XPS spectra are also investigated as shown in Fig. 3c, which can be decomposed into two distinct peaks. The binding energies located at 529.5 eV can be assigned to lattice oxygen O2−; the binding energies at 531.7 eV belonging to surface active oxygen species like defect-oxide O22− or hydroxyl-like group OH−. The strong peak of the sample at about 531.7 eV manifests that they are expected to have better catalytic activity in oxidation reactions. On the other hand, more information can be obtained from the Mo 3d XPS spectra in Fig. 3d. The peak of Mo 3d for the representative 9Mo/CeO2 NPs can be decomposed into two distinct peaks, suggesting that Ce and Mo have chemical interactions.
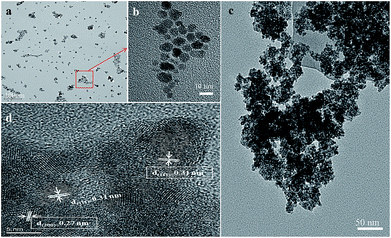
The morphology and structural features of CeO2 NPs and 9Mo/CeO2 NPs were elucidated by TEM and HRTEM analyses. A typical TEM image of CeO2 NPs shown in Fig. 4a clearly illustrates the homogeneous, well-dispersed nanoparticles, which might result from the uniform heating in the microwave synthesis method. The crystallite size of CeO2 NPs is distributed in a narrow range between 8 and 12 nm, as elucidated in the high magnification (the inset in Fig. 4b) of the approximate area part outlined in the white rectangle. When Mo is doped in CeO2 NPs, the average diameter of nanoparticles is decreased and the corresponding values are 5 nm for the 9Mo/CeO2 NPs. As can be seen from the observed TEM images (Fig. 4c), a porous structure formed by the agglomeration of the NPs. In the HRTEM image (Fig. 4d), most of the lattice fringes of 0.31 nm can be clearly observed, which was in good agreement with the crystal plane (111) of CeO2. Several lattice fringes of 0.27 nm corresponding to its (200) lattice were also marked in the HRTEM image.
Peroxidase-like catalytic activity of Mo/CeO2 NPs
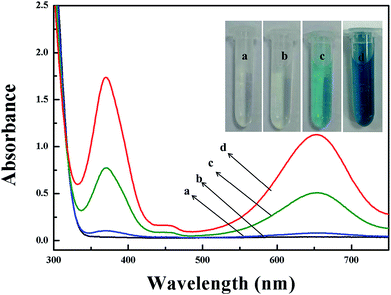
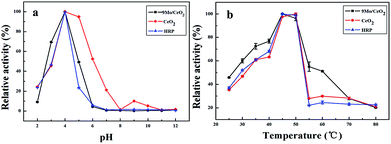
The peroxidase-like activity of CeO2 NP catalysts with different Mo doping ratios was primarily evaluated for continuous oxidation of the TMB·HCl substrate in the presence of H2O2 as shown in Fig. S1a.† The observed relative peroxidase-like activity of 9Mo/CeO2 NP catalysts was the highest of all materials, which are selected as the artificial enzyme in the next experiment. It is obvious that the catalytic activity of CeO2 NPs doped with Mo was much higher than that of pure CeO2 NPs alone, revealing that an activated sample of Mo/CeO2 NPs exhibited enhanced peroxidase-like catalytic activity under identical conditions (Fig. 5). Meanwhile the catalytic activity increases gradually as the Mo/CeO2 NP concentration increases from 0.01 mg mL−1 to 1.50 mg mL−1 (Fig. S2†). When the concentration of Mo/CeO2 NPs increases to 0.6 mg mL−1, the absorbance intensity reaches a plateau, suggesting that the optimal concentration was 0.6 mg mL−1 in following experiments.The catalytic activity of CeO2 NPs and Mo/CeO2 NPs was analogous to that of natural enzyme HRP, depending on pH and temperature. The effects of pH on the peroxidase-like activity of HRP, CeO2 NPs and Mo/CeO2 NPs were measured by varying the pH from 2.0 to 12.0 (Fig. 6a). The catalysts exhibited good catalytic activity at pH 4.0, which is consistent with the previously reported results.36 In addition, the peroxidase-like activity of CeO2 NPs, 9Mo/CeO2 NPs and HRP was investigated while varying the temperature from 25 °C to 80 °C (Fig. 6b). It can be found that the activity remains stable between 40 °C and 50 °C, and decreases dramatically when the temperature is higher than 55 °C. Finally, the optimal pH and temperature for subsequent analysis were approximately pH 4.0 and 45 °C for 9Mo/CeO2 NPs, pH 4.0 and 50 °C for CeO2 NPs, and pH 4.0 and 45 °C for HRP respectively.
Robustness of Mo/CeO2 NPs
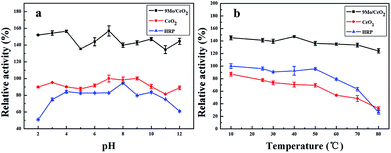
The peroxidase-like activity of CeO2 NPs, Mo/CeO2 NPs and HRP after treatment in a wide range of pH from 2.0 to 12.0 for 2 h is presented in Fig. 7a. The pH stability was also proved by observing 90% of relative catalytic enzyme activity over 9Mo/CeO2 NPs in a wide range of pH from 2.0 to 12.0. In contrast, the relative catalytic enzyme activity of HRP was indeed decreased greatly after incubating at pH lower than 4.0 or larger than 10.0. As shown in Fig. 7b, the relative catalytic enzyme activity of Mo/CeO2 NPs was indeed maintained at nearly identical values over the temperature from 10 to 80 °C. The peroxidase-like activity of HRP was decreased at treatment temperatures higher than 50 °C. Thus, it was clear that the Mo/CeO2 NPs exhibited higher relative enzyme catalytic activity and were stable at higher temperatures and wide pH.Catalytic kinetics and the proposed mechanism of Mo/CeO2 NPs
To further understand the mechanism of peroxidase-like activity, the steady-state kinetics of 9Mo/CeO2 NPs and CeO2 NPs were investigated under optimal conditions, respectively. Typical Michaelis–Menten curves were observed for both Mo/CeO2 NPs and CeO2 NPs within a suitable range of H2O2 concentrations and TMB concentrations. As shown in Fig. S3a–d,† in a certain substrate concentration, the plots of the initial rate versus TMB and H2O2 concentrations both follow typical Michaelis–Menten behavior. The Michaelis–Menten constant (Km) and the maximum initial velocity (Vmax) were obtained by using Lineweaver–Burk plots (Fig. S3e–g†) and are listed in Table 1. The apparent Km value of Mo/CeO2 NPs with H2O2 as the substrate was higher than that of CeO2 NPs, agreeing with the observation that a higher H2O2 concentration was required to achieve maximal activity for Mo/CeO2 NPs. In contrast with CeO2 NPs, 9Mo/CeO2 NPs exhibited a significantly lower Km value with TMB as the substrate, indicating that the Mo/CeO2 NPs have a higher affinity for TMB than CeO2 NPs.| Catalysts | V max [10−8 m s−1] | K m (mM) | ||
|---|---|---|---|---|
| TMB | H2O2 | TMB | H2O2 | |
| 9Mo/CeO2 NPs | 9.64 × 10⁻⁹ | 8.01 × 10⁻⁸ | 0.001 | 8.85 |
| CeO2 NPs | 1.95 × 10⁻⁸ | 6.88 × 10⁻⁹ | 0.623 | 0.067 |
It was found that 9Mo/CeO2 NPs show enhanced peroxidase-like catalytic activity, and the possible reaction mechanism is hypothesized. As is known, the ˙OH and ˙O2− radicals could be easily produced in the H2O2 containing system and play primary roles in the catalytic reaction.36,49 Fig. S2† shows that the relative activity of the peroxidase mimic was switched on upon the addition of H2O2 and 9Mo/CeO2 NPs, which enhanced with the increase of 9Mo/CeO2 NP amounts. Therefore, the mechanism of 9Mo/CeO2-catalyzed oxidation of TMB can be ascribed to the generation of ˙OH from the decomposition of H2O2. 9Mo/CeO2 NPs showed a high amount of surface defects such as Ce3+ ions and oxygen vacancies due to Mo doping that was observed from the XPS results (Fig. 3d). The highly reactive oxygen species were produced when Ce3+ ions reacted with H2O2. Thus, TMB was absorbed on the surface of 9Mo/CeO2 NPs on account of its high affinity and donates lone-pair electrons in the amino groups to 9Mo/CeO2 NPs, leading to an increase in electron density and mobility on 9Mo/CeO2 NPs, further enhancing the reaction efficiency and catalytic activity.50 In addition, as the catalytic activity of nanomaterials for many reactions is often dependent on the morphology, size, surface area and pore structures, the peroxidase-like activity of 9Mo/CeO2 NPs also exhibited a similar phenomenon compared with CeO2 NPs. It is not a surprise to observe the best performance with 9Mo/CeO2 NPs as the artificial peroxidase, which have a smaller size and a bigger pore radius (shown in the Characterization part). Furthermore, the addition of Mo can lead to the aggregation of CeO2 NPs, which may accelerate decomposition of H2O2 that triggers the oxidation of TMB. Therefore, the peroxidase-like activity enhancement of 9Mo/CeO2 NPs may be due to the possible reasons above.
Glucose detection using Mo/CeO2 NPs
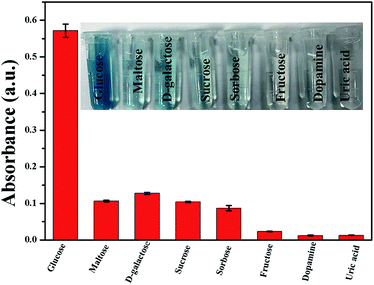
A simple colorimetric method to detect glucose contents was developed based on the efficient catalytic effect of 9Mo/CeO2 NPs under optimized conditions. Generally, glucose oxidase (GOx) is used as an oxidant to oxidise glucose to produce gluconic acid and H2O2 in the presence of oxygen.36,51 Therefore, the colorimetric detection of the converted TMB can be exploited to indirectly measure glucose content. As shown in Fig. 8, the absorbance at 652 nm was proportional to glucose concentrations, the linear detection range of glucose was from 5 × 10⁻⁷ to 5 × 10⁻⁵ mol L−1, and the detection limit was estimated to be 4 × 10⁻⁷ mol L−1. The present method has a very low detection limit compared with other colorimetric methods based on enzyme mimics for glucose detection.14,36,38 Furthermore, this method was used to detect serum with complicated components, and the selectivity of the colorimetric detection method was verified. In this work, substances including common sugars and other substances were selected as interferents. As shown in Fig. 9, the method had less response to other tested sugars such as maltose, D-galactose, sucrose and sorbose in the experiment and found that the Mo/CeO2 NP catalyst showed excellent selectivity towards glucose detection.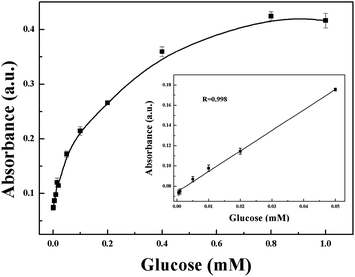 | ||
| Fig. 8 Glucose concentration response curve for glucose detection using GOx and the 9Mo/CeO2 NP catalyst (inset: linear calibration plot for glucose). | ||
In addition, the practical application of the present method was evaluated by determining the concentration of glucose in real serum samples under the optimal experimental conditions. The serum was obtained from the Affiliated hospital of Zunyi Medical College, and the results obtainedusing this method are summarized in Table 2. The concentrations of glucose examined by this colorimetric method were similar to the observed concentrations based on automatic biochemical instruments in hospitals, which indicates that this simple method can be potentially applied to the determination of glucose content in real biological samples.
Conclusions
In summary, CeO2 NPs with different Mo doping concentrations were prepared using a facile microwave-assisted synthesis method and possessed enhanced peroxidase-like activity. The TEM and XRD results confirmed that the Mo doping significantly reduced the average diameter of CeO2 NPs. The 9Mo/CeO2 NPs had a higher enzyme activity toward the H2O2-mediated TMB reaction than those of un-doped and Mo/CeO2 NPs with other molar ratios of Mo. Furthermore, the prepared 9Mo/CeO2 NPs were proven to possess peroxidase-like catalytic activity over a wide range of pH values and temperatures compared with natural enzymes and un-doped CeO2 NPs. In view of the excellent peroxidase-like catalytic performance, a simple, cheap and high sensitive method for colorimetric detection of glucose was successfully established, and the detection limit of glucose could reach as low as 0.4 μM. This study would be significant to accelerate the development of novel peroxidase mimic materials with enhanced catalytic activities.Conflicts of interest
There are no conflicts to declare.Acknowledgements
The authors acknowledge financial support from the Natural Science Foundation of China (No. 21405107) and the United Foundation of Guizhou Province (LH20147558).Notes and references
- Y. Chen, H. Cao, W. Shi, H. Liu and Y. Huang, Chem. Commun., 2013, 49, 5013–5015 RSC.
- F. Qiao, L. Chen, X. Li, L. Li and S. Ai, Sens. Actuators, B, 2014, 139, 255–262 CrossRef.
- Y. Lin, J. Ren and X. Qu, Acc. Chem. Res., 2014, 47, 1097–1105 CrossRef CAS PubMed.
- C. Ray, S. Dutta, S. Sarkar, R. Sahoo, A. Roy and T. Pal, J. Mater. Chem. B, 2014, 2, 6097–6105 RSC.
- Y.-T. Zhou, W. He, W. G. Wamer, X. Hu, X. Wu, Y. M. Lo and J.-J. Yin, Nanoscale, 2013, 5, 1583–1591 RSC.
- Z. Gao, M. Xu, L. Hou, G. Chen and D. Tang, Anal. Chim. Acta, 2013, 776, 79–86 CrossRef CAS PubMed.
- L. Gao, J. Zhuang, L. Nie, J. Zhang, Y. Zhang, N. Gu, T. Wang, J. Feng, D. Yang and S. Perrett, Nat. Nanotechnol., 2007, 2, 577–583 CrossRef CAS PubMed.
- J. Tian, Q. Liu, A. M. Asiri, A. H. Qusti, A. O. Alyoubi and X. Sun, Nanoscale, 2013, 5, 11604–11609 RSC.
- F. Cui, Q. Deng and L. Sun, RSC Adv., 2015, 5, 98215–98221 RSC.
- M. Hosseini, F. S. Sabet, H. Khabbaz, M. Aghazadeh, F. Mizani and M. R. Ganjali, Anal. Methods, 2017, 9, 3519–3524 RSC.
- Y. L. Dong, H. G. Zhang, Z. U. Rahman, L. Su, X. J. Chen, J. Hu and X. G. Chen, Nanoscale, 2012, 4, 3969–3976 RSC.
- Y. Tao, Y. Lin, Z. Huang, J. Ren and X. Qu, Adv. Mater., 2013, 25, 2594–2599 CrossRef CAS PubMed.
- W. He, Y. Liu, J. Yuan, J. J. Yin, X. Wu, X. Hu, K. Zhang, J. Liu, C. Chen and Y. Ji, Biomaterials, 2011, 32, 1139–1147 CrossRef CAS PubMed.
- Z. Sun, Q. Zhao, G. Zhang, Y. Li, G. Zhang, F. Zhang and X. Fan, J. Mater. Chem., 2011, 21, 17658–17661 RSC.
- N. S. Surgutskaya, M. E. Trusova, G. B. Slepchenko, A. S. Minin, A. G. Pershina, M. A. Uimin, A. E. Yermakov and P. S. Postnikov, Anal. Methods, 2017, 9, 2433–2439 RSC.
- R. Cui, Z. Han and J. J. Zhu, Chemistry, 2011, 17, 9377–9384 CrossRef CAS PubMed.
- Y. Long, X. Wang, D. Shen and H. Zheng, Talanta, 2016, 159, 122–126 CrossRef CAS PubMed.
- A. X. Zheng, Z. X. Cong, J. R. Wang, J. Li and H. H. Yang, Biosens. Bioelectron., 2013, 49, 519–524 CrossRef CAS PubMed.
- L. Hu, Y. Yuan, L. Zhang, J. Zhao, S. Majeed and G. Xu, Anal. Chim. Acta, 2013, 762, 83–86 CrossRef CAS PubMed.
- L. Zhang, L. Han, P. Hu, L. Wang and S. Dong, Chem. Commun., 2013, 49, 10480–10482 RSC.
- R. André, F. Natálio, M. Humanes, J. Leppin, K. Heinze, R. Wever, H. C. Schrlder, W. E. G. Müller and W. Tremel, Adv. Funct. Mater., 2011, 21, 501–509 CrossRef.
- J. Mu, Y. Wang, M. Zhao and L. Zhang, Chem. Commun., 2012, 48, 2540–2542 RSC.
- Y. Lin, C. Xu, J. Ren and X. Qu, Angew. Chem., 2012, 51, 12579–12583 CrossRef CAS PubMed.
- T. Zheng, Q. Zhang, S. Feng, J. J. Zhu, Q. Wang and H. Wang, J. Am. Chem. Soc., 2014, 136, 2288–2291 CrossRef CAS PubMed.
- M. M. Chen, Y. N. Ding, Y. Gao, X. X. Zhua, P. Wang, Z. Q. Shi and Q. Y. Liu, RSC Adv., 2017, 7, 25220–25228 RSC.
- W. Chen, J. Chen, A. L. Liu, L. M. Wang, G. W. Li and X. H. Lin, ChemCatChem, 2011, 3, 1151–1154 CrossRef CAS.
- D. M. Gu, Y. Y. Chu, Z. B. Wang, Z. Z. Jiang, G. P. Yin and Y. Liu, Appl. Catal., B, 2011, 102, 9–18 CrossRef CAS.
- Z. Zhang, J. Liu, J. Gu, L. Su and L. Cheng, Energy Environ. Sci., 2014, 7, 2535–2558 CAS.
- T. Pirmohamed, J. M. Dowding, S. Singh, B. Wasserman, E. Heckert, A. S. Karakoti, J. E. King, S. Seal and W. T. Self, Chem. Commun., 2010, 46, 2736–2738 RSC.
- S. M. Hirst, A. S. Karakoti, R. D. Tyler, N. Sriranganathan, S. Seal and C. M. Reilly, Small, 2009, 5, 2848–2856 CrossRef CAS PubMed.
- Y. Liu and Y. Lei, Sens. Actuators, B, 2013, 188, 1141–1147 CrossRef CAS.
- J. Yao, W. Feng, X. Qiu, L. Ning and Y. Su, Electrochim. Acta, 2011, 56, 5587–5592 CrossRef CAS.
- L. F. Sun, Y. Y. Ding, Y. L. Jiang, Y. N. Ding and Q. Y. Liu, Sens. Actuators, B, 2017, 239, 848–856 CrossRef CAS.
- I. Celardo, M. D. Nicola, C. Mandoli, J. Z. Pedersen, E. Traversa and L. Ghibelli, ACS Nano, 2011, 5, 4537–4549 CrossRef CAS PubMed.
- C. Walkey, S. Das, S. Seal, J. Erlichman, K. Heckman, L. Ghibelli, E. Traversa, J. F. Mcginnis and W. T. Self, Environ. Sci.: Nano, 2015, 2, 33–53 RSC.
- D. Jampaiah, T. S. Reddy, A. E. Kandjani, P. R. Selvakannan, Y. M. Sabri, V. E. Coyle, R. Shukla and S. K. Bhargava, J. Mater. Chem. B, 2016, 4, 3874–3885 RSC.
- G. Zhang, Z. Yang, W. Zhang and Y. Wang, J. Mater. Chem. A, 2016, 4, 1481–1487 Search PubMed.
- D. Jampaiah, T. S. Reddy, V. E. Coyle, A. Nafady and S. K. Bhargava, J. Mater. Chem. B, 2017, 5, 720–730 RSC.
- F. F. Deng, C. Ding, Y. Wang, W. T. Li, L. L. Liu and H. Li, Anal. Methods, 2014, 6, 9228–9233 RSC.
- S. Putla, M. H. Amin, B. M. Reddy, A. Nafady, K. A. Al Farhan and S. K. Bhargava, ACS Appl. Mater. Interfaces, 2015, 7, 16525–16535 CAS.
- N. Wang, J. Sun, L. Chen, H. Fan and S. Ai, Microchim. Acta, 2015, 182, 1733–1738 CrossRef CAS.
- Z. Hui, Y. Dong, P. J. Ping, G. L. Wang and J. Zhang, ACS Appl. Mater. Interfaces, 2015, 7, 6451–6461 Search PubMed.
- S. Zhan, Q. Shi, Y. Zhang, Y. Li and Y. Tian, RSC Adv., 2016, 6, 59185–59194 RSC.
- D. He, G. Wan, H. Hao, D. Chen, J. Lu, L. Zhang, F. Liu, L. Zhong, S. He and Y. Luo, Chem. Eng. J., 2016, 289, 161–169 CrossRef CAS.
- O. S. Bezkrovnyi, R. Lisiecki and L. Kepinski, Cryst. Res. Technol., 2016, 51, 554–560 CrossRef CAS.
- S. Enzo, S. Polizzi and A. Benedetti, Z. Kristallogr., 1985, 170, 275–288 CrossRef CAS.
- H. Nasser, Ă. Rédey, T. Yuzhakova and J. Kovács, J. Therm. Anal. Calorim., 2009, 95, 69–74 CrossRef CAS.
- X. Li, X. Li, J. Li and J. Hao, J. Hazard. Mater., 2016, 318, 615–622 CrossRef CAS PubMed.
- J. Peng, Y. Yu, W. Min, Z. Yun, D. Zhang, C. Sun and X. Han, J. Mater. Chem. B, 2016, 4, 6316–6325 RSC.
- L. Li, L. Ai, C. Zhang and J. Jiang, Nanoscale, 2014, 6, 4627–4634 RSC.
- Q. Y. Liu, P. P. Che, Z. Xu, M. M. Chen, Y. N. Ding, K. Yue and J. Xu, Sens. Actuators, B, 2017, 339–348 CrossRef.
Footnote |
| † Electronic supplementary information (ESI) available. See DOI: 10.1039/c7ay02459b |
| This journal is © The Royal Society of Chemistry 2018 |

