
 Open Access Article
 This Open Access Article is licensed under a
 Creative Commons Attribution 3.0 Unported Licence
Determination of fragrance ingredients in fish by ultrasound-assisted extraction followed by purge & trap†
Changer Long
Chen
 ,
Karin
Löfstrand
,
Margaretha
Adolfsson-Erici
and
Matthew
MacLeod
*
,
Karin
Löfstrand
,
Margaretha
Adolfsson-Erici
and
Matthew
MacLeod
*
Department of Environmental Science and Analytical Chemistry (ACES), Stockholm University, SE-106 91, Stockholm, Sweden. E-mail: matthew.macleod@aces.su.se; Tel: +46 8674 7168
First published on 23rd March 2017
Abstract
Fragrance materials are widely used in household and personal care products in applications that can lead to emissions into the aquatic environment. Assessing the potential of fragrance materials to bioaccumulate in fish in in vivo laboratory studies requires a reliable analytical method for determining the concentrations of chemical substances in fish tissue. Here, we present an analytical method for simultaneously measuring a group of model chemicals that are representative of chemicals found in fragrance materials in rainbow trout. This method involves ultrasound-assisted extraction (UAE) followed by enrichment of the fragrance ingredients using a purge & trap system. Nine fragrance ingredients including semi-volatile and volatile compounds were selected as model substances for method development. Homogenised whole rainbow trout subsamples were spiked with these nine model fragrance ingredients, hexachlorobenzene (HCB) and 2,2′,5,5′-tetrachlorobiphenyl (PCB52). The targeted chemicals were extracted from the fish tissue using acetonitrile in an ultrasonic bath; after solvent exchange to hexane, they were extracted into the gas phase by heating the samples and purging with nitrogen and trapped on a solid-phase extraction (SPE) cartridge. Finally, these chemicals were eluted with hexane from the SPE column and analysed using gas chromatography-mass spectrometry (GC-MS). The proposed method has been evaluated for blanks, spiked recoveries and precision, which are all acceptable. We believe that the method presented here is generally applicable for analysis of acid-sensitive volatile and semi-volatile organic chemicals in fish and provides the basis to conduct in vivo bioaccumulation studies of fragrance materials.
1 Introduction
Fragrance ingredients are used in a wide variety of personal care and household products.1 A notable example is essential oils that are obtained by steam distillation of plant materials. Essential oils have the characteristic fragrance of the plant2 and have been used for flavouring foods and beverages, as aroma additives for cosmetics and household products, as masking agents for unpleasant odours, and as therapeutic agents.3,4 Chemically, essential oils are mixtures of volatile to semi-volatile organic compounds (VOCs-SVOCs) that are classified as natural complex substances (NCS) under the European chemicals regulation REACH.5,6 The chemical components of essential oils tend to be hydrophobic with log![[thin space (1/6-em)]](https://www.rsc.org/images/entities/char_2009.gif) KOW > 4 for more than half of the chemicals.7 Therefore, if they are not metabolised, they have the potential to be accumulated from water and/or diet by aquatic organisms.8–13 Fragrance ingredients are subject to regulation under REACH, which requires evaluation of their potential for bioaccumulation using a metric like the bioconcentration factor (BCF).
KOW > 4 for more than half of the chemicals.7 Therefore, if they are not metabolised, they have the potential to be accumulated from water and/or diet by aquatic organisms.8–13 Fragrance ingredients are subject to regulation under REACH, which requires evaluation of their potential for bioaccumulation using a metric like the bioconcentration factor (BCF).
In vivo studies according to the OECD 305 guideline14 are the ‘gold standard’ for determining BCF in assessments of the bioaccumulation potential of organic chemicals.15 In order to conduct in vivo bioconcentration studies, a reliable analytical method for measuring chemical concentrations in fish is required. Some studies have reported methods for musk fragrances,16–19 however, to the best of our knowledge, there has been no method published in the literature for the simultaneous analysis of fragrance ingredients with a range of volatility in biota; this is the challenge confronted in the present study.
Organic chemicals, particularly those that are hydrophobic, are usually extracted from biota associated with lipids using aggressive solvents such as hexane or dichloromethane.20,21 When analysing persistent organic chemicals, the next step is destructive clean-up using concentrated sulphuric acid (either direct or column packed) to remove the lipids.22–24
For target chemicals that are not stable in the presence of strong acids, such as fragrance ingredients, removal of lipids poses a challenge. Mild solvents such as acetonitrile are preferred over aggressive solvents to minimise the amount of lipid extracted,8,19 which might affect the following clean-up procedure. Extraction can be followed by lipid removal by non-destructive methods, such as gel permeation chromatography or dispersive solid-phase extraction with methods like Soxhlet extraction, micro-wave assisted extraction, ultrasound-solid liquid extraction, pressurised liquid extraction and the Quick, Easy, Cheap, Effective, Rugged and Safe (QuEChERS) method.16–19 All of these methods involve the use of chromatography columns to separate the lipids and concentration of samples by evaporation using a rotary evaporator or under a stream of nitrogen gas. Concentrating the samples after the chromatography step would result in the loss of volatile components of fragrance ingredient mixtures, like terpenes.
We hypothesised that the purge & trap method that has been used for the determination of volatile organochlorines25,26 and recently for analysis of volatile methylsiloxanes in wet biota tissues27 would offer a non-destructive way of simultaneously isolating acid-sensitive fragrance compounds with a range of volatility from lipid extracts. The purge & trap method is a potentially elegant solution for the non-destructive clean-up of biological samples since it does not depend on chromatography to separate the analytes from lipids.
The aim of this study was to develop a method for simultaneously measuring fragrance ingredients with a wide range of volatility in fish by combing ultrasound-assisted extraction (UAE) (to increase the extraction efficiency in a mild solvent) and purge & trap. Our motivation is to develop a method that provides a basis for laboratory bioconcentration studies of mixtures of fragrance compounds. Nine model compounds that are representative of the components of essential oil mixtures found in fragrance and personal care products and that include VOCs and SVOCs were selected to optimise and validate the extraction and clean-up method for fish samples.
2 Materials and methods
2.1 Chemicals, reagents and fish
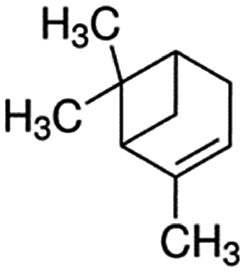
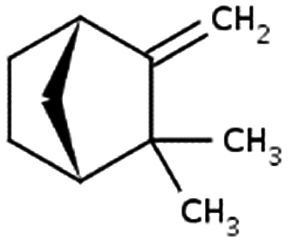
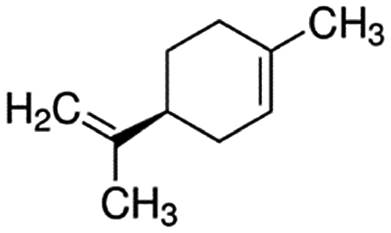
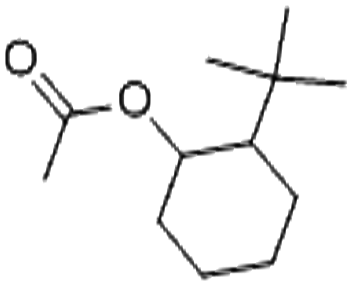
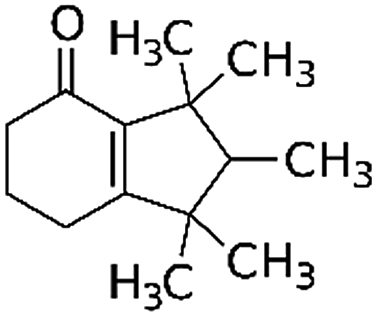
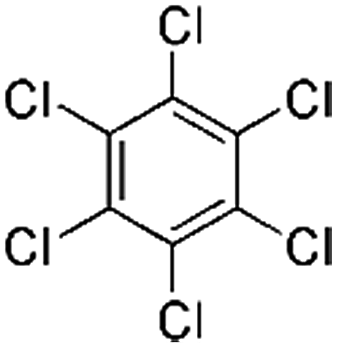
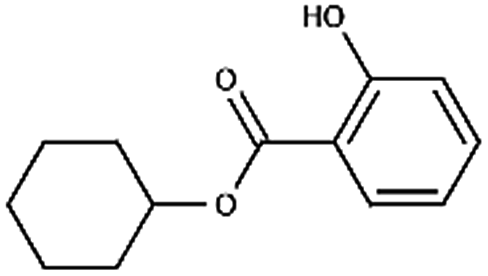
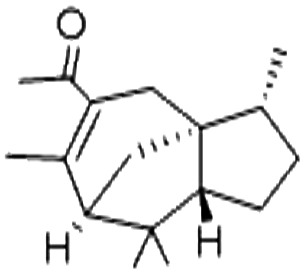
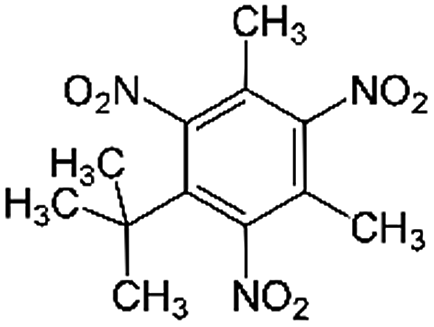
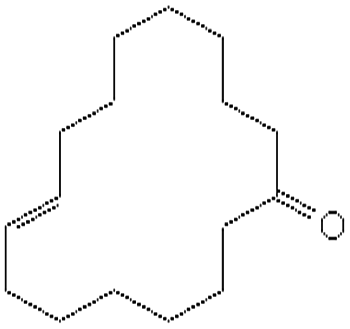
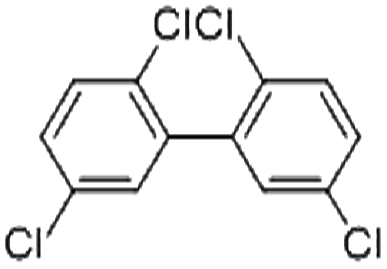
Nine compounds were selected as model substances representative of those found in fragrance materials: α-pinene, camphene, limonene, 2-t-butyl-cyclohexyl acetate (Verdox), 6,7-dihydro-1,1,2,3,3-pentamethyl-4(5H)-indanone (DPMI), cyclohexyl salicylate, acetyl cedrene, musk xylene and globanone. Two industrial chemicals, hexachlorobenzene (HCB) and 2,2′,5,5′-tetrachlorobiphenyl (PCB52), were also included as examples of potential benchmark chemicals28,29 for future in vivo fish studies. Isotopically labelled chemicals d2-limonene (LIM-d2), d4-acetyl cedrene (AC-d4), 13C6-hexachlorobenzene (HCB-C13), d15-musk xylene (MX-d15) and 13C12-2,2′,5,5′-tetrachlorobiphenyl (PCB52-C13) were used as surrogate standards, and subsequently as internal standards.30 α-Pinene, limonene and HCB were obtained from Sigma-Aldrich (Buchs, Switzerland), camphene and cyclohexyl salicylate from Givaudan (Ashford, United Kingdom), LIM-d2 from Aroma lab AG (Planegg, Germany), Verdox, DPMI and acetyl cedrene from International Flavors and Fragrances (IFF) (New Jersey, USA), HCB-C13 and PCB52-C13 from Cambridge Isotope Laboratories (Andover, USA), musk xylene and MX-d15 from Dr Ehrenstorfer (Augsburg, Germany), globanone from Symrise (Holzminden, Germany), and PCB52 from AccuStandard (New Haven, USA). AC-d4 was synthesised in-house from acetyl cedrene according to a previous study.31 All compounds had a purity of >97%. Their names, abbreviations, CAS numbers, physiochemical properties and chemical structures are given in Table 1. 2,2′,5,6′-Tetrachlorobiphenyl (PCB53) from AccuStandard was used as a volumetric standard. All standards were dissolved in toluene, for both high concentration stock solutions and lower concentration working solutions.| Name | CAS no. | Formula | Molecular weight (g mol−1) | logKOWa |
logKOAa |
Vapour pressurea (Pa) | Structure |
|---|---|---|---|---|---|---|---|
|
a From EPI Suite, reported as the average of experimental values if available and otherwise estimated from the structure, except the logKOA of musk xylene, which is from ref. 32.
|
|||||||
| α-Pinene | 80-56-8 | C10H16 | 136.24 | 4.58 | 3.36 | 633 |
|
| Camphene | 79-92-5 | C10H16 | 136.24 | 4.22 | 3.40 | 335 |
|
| Limonene | 138-86-3 | C10H16 | 136.24 | 4.38 | 4.26 | 192 |
|
| 2-t-Butylcyclo hexyl acetate (Verdox) | 88-41-5 | C12H22O2 | 198.31 | 4.42 | 5.81 | 7.1 |
|
| 6,7-Dihydro-1,1,2,3,3-pentamethyl-4(5H)-indanone (DPMI) | 33704-61-9 | C14H22O | 206.33 | 4.49 | 6.73 | 0.54 |
|
| Hexachlorobenzene (HCB) | 118-74-1 | C6Cl6 | 284.78 | 5.73 | 7.38 | 2.4 × 10⁻³ |
|
| Cyclohexyl salicylate | 25485-88-5 | C13H16O3 | 220.27 | 4.87 | 8.34 | 2.1 × 10⁻³ |
|
| Acetyl cedrene | 32388-55-9 | C17H26O | 246.40 | 5.02 | 7.24 | 7.6 × 10⁻² |
|
| Musk xylene | 81-15-2 | C12H15N3O6 | 297.26 | 4.45 | 8.9 (ref. 32) | 9.7 × 10⁻³ |
|
| Globanone | 3100-36-5 | C16H28O | 236.44 | 5.82 | 7.3 | 3.2 × 10⁻² |
|
| 2,2′,5,5′-Tetrachlorobiphenyl (PCB52) | 35693-99-3 | C12H6Cl4 | 291.99 | 6.09 | 8.47 | 1.1 × 10⁻³ |
|
High purified water (Milli-Q, MQ) was generated from a Milli-Q ultrapure water system (Milli-Q PLUS 185 from Millipore Stockholm, Sweden). Toluene, acetonitrile (HPLC grade) and n-hexane were obtained from Merck (Darmstadt, Germany). SPE cartridges (Isolute ENV+, 10 mg/1 mL) for collecting target chemicals and Isolute ENV+ (50 mg/1 mL) for cleaning the nitrogen purge gas were obtained from Biotage (Uppsala, Sweden).
Rainbow trout were purchased from the Vilstena and Näs fish farms, Sweden and were kept in accordance with the Swedish National Agriculture Board's guidance on research animals (Statens Jordbruksverks Föreskrifter och Allmänna Råd om Försöksdjur, SJVFS 2015:24). Ethical approval for the experiments was obtained from the Stockholm North Animal Experiments Ethics Board (Stockholms Norra Djurförsöksetiska Nämnd, permit N 119/14).
2.2 Instrumental analysis
Analysis was performed using a Trace 1300 Series gas chromatograph (GC) (Thermo scientific) equipped with a programmed temperature vaporising (PTV) injector and an AI 1310 Autosampler (Thermo scientific), coupled to a single quadrupole ISQ mass spectrophotometer (MS) (Thermo scientific). The PTV injector was run in splitless mode (1.5 min) and programmed with a temperature starting at 60 °C and held for 0.5 min, raised by 14.5 °C s−1 to 300 °C and held for 1 min. A Thermo TG-5SIL MS capillary column (30 m × 0.25 mm i.d. and a 0.25 μm film) was used with helium (at a constant flow of 1 mL min−1) as the carrier gas. The oven temperature program was started at 60 °C and held for 2 min, raised by 10 °C min−1 to 250 °C and then 30 °C min−1 to 300 °C, and held for 2 min. The transfer line was set to 300 °C and the ion source to 260 °C. The MS instrument was operated in electron ionisation (EI) mode (70 eV), and selective ion monitoring (SIM) mode for scanning their respective ions (Table 2) with a dwelling time of 0.01 s. Nine-point calibration standards (0.1, 0.5, 1, 5, 10, 20, 50, 100, and 200 ng mL−1 for each chemical) were prepared freshly for each batch of samples and injected into the GC-MS together with the samples. The internal standard method was used to quantify the target chemicals in all samples (Table 2).| Substance | RT, min | m/z (SIM) | Internal standard used | R 2 | IDL (pg) |
|---|---|---|---|---|---|
| a Bold, used for quantification. | |||||
| α-Pinene | 5.49 | 136 , 93 | LIM-d2 | 0.9993 | 1.12 |
| Camphene | 5.77 | 136, 93 | LIM-d2 | 0.9993 | 0.34 |
| Limonene | 7.02 | 136, 93 | LIM-d2 | 0.9993 | 0.64 |
| Verdox | 11.01 | 123, 82, 95 | HCB-C13 | 0.9984 | 0.54 |
| DPMI | 13.84 | 191, 163, 135, 206 | HCB-C13 | 0.9976 | 0.38 |
| HCB | 16.26 | 284, 286 | HCB-C13 | 0.9995 | 0.52 |
| Cyclohexyl salicylate | 16.65 | 120, 138 | HCB-C13 | 0.9996 | 0.78 |
| Acetyl cedrene | 16.99 | 231, 246 | AC-d4 | 0.9958 | 2.14 |
| Musk xylene | 17.77 | 282, 115 | MX-d15 | 0.9975 | 0.83 |
| Globanone | 18.54 | 236, 81, 95 | MX-d15 | 0.9982 | 1.21 |
| PCB52 | 18.78 | 220, 292 | PCB52-C13 | 0.9936 | 0.28 |
2.3 Method overview
Based on a literature review8,16 and experience in our laboratory,27 we proposed the following procedures for the extraction of target chemicals from fish: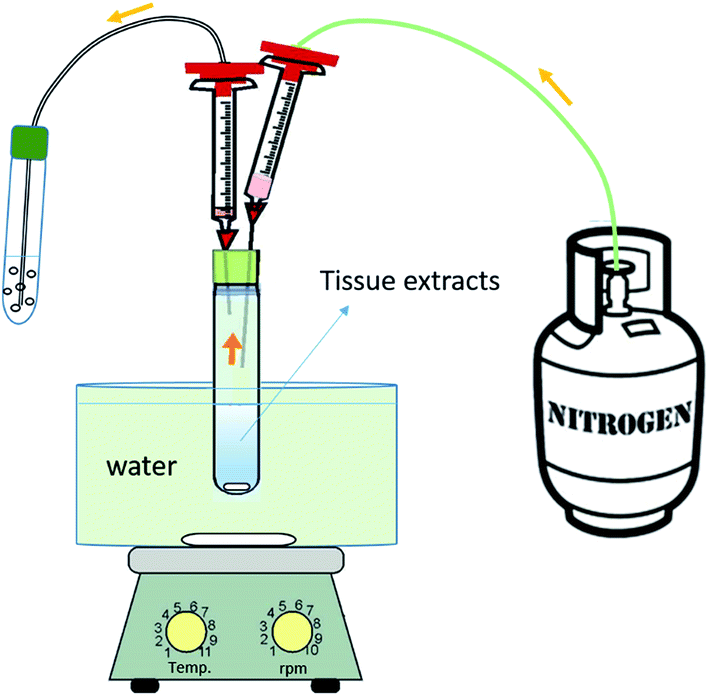 | ||
| Fig. 1 Schematic illustration of the apparatus used for the gas-phase (purge & trap) extraction of fragrance ingredients from tissue extracts. | ||
2.4 Method optimisation
Since the lipid in the extract can affect the recovery from the purge & trap step, the method was optimised for the UAE extraction and purge & trap conditions that minimise the effect of lipid on the yields. The recoveries for both steps of the proposed method were assessed by spiking target chemicals just before the tested procedure to identify which step determined losses.2.5 Method evaluation
We evaluated the optimised method in terms of blanks, LOD/LOQ, recoveries, and repeatability and reproducibility, as follows:3 Results
3.1 Instrumental analysis
The model compounds were separated in the GC-MS within 20 min. The retention time, scanned ions for quantification and identification of the target compounds as well as the internal standard used for quantification are summarised in Table 2, and an example chromatogram is given in Fig. S1 in the ESI.† The 9-point calibration curve was regressed linearly, which showed a good linearity with R2 > 0.99 (Table 2). The instrument detection limit (IDL) was calculated based on the standard concentration with a signal-to-noise ratio (S/N) > 3, and an injection volume of 1 μL, and was between 0.28 pg (PCB52) and 2.14 pg (acetyl cedrene).3.2 Blanks and LOD/LOQ
No chemical was detected in the instrumental blanks, indicating that there was no contamination from the hexane solvent or the instrumental system. In the procedural blanks (solvent), signals that correspond to some of the compounds were observed at a level higher than the IDL, but lower than the LOD.The LOD and LOQ were determined from the analyte levels in 8 method matrix blank samples analysed over a 3-week period and are given in Table 5. The mean blanks and their standard deviation (in ng) ranged from 0.18 ± 0.04 (musk xylene) to 13.8 ± 2.7 (α-pinene). Based on a 5 g fish sample, this converts to a LOD of 0.063–4.4 ng g−1 ww, and an LOQ of 0.11–8.2 ng g−1 ww (Table 5).
3.3 UAE efficiency
Using acetonitrile reduces the amount of fat extracted from fish tissue compared to more aggressive solvents and may also affect the efficiency of the extraction. Repeated extractions were carried out to find the suitable extraction times as exemplified by the data in Table 3. The first three extractions collectively yielded 66% recovery for PCB52, 80% for acetyl cedrene (relatively less volatile) and 87% for camphene (relatively more volatile), while the lipid extracted in the first three extractions accounted for 57% of the total amount extracted with 7 extractions. The extracted amount after the third extraction was progressively lower for both target chemicals and the lipid.3.4 Purge & trap optimization
The effects of the lipid content, extraction temperature and time for the purge & trap step were investigated to optimise the procedure. In all experiments, there was no breakthrough from the trap SPE column during the extraction as determined in tests using two SPE columns in series.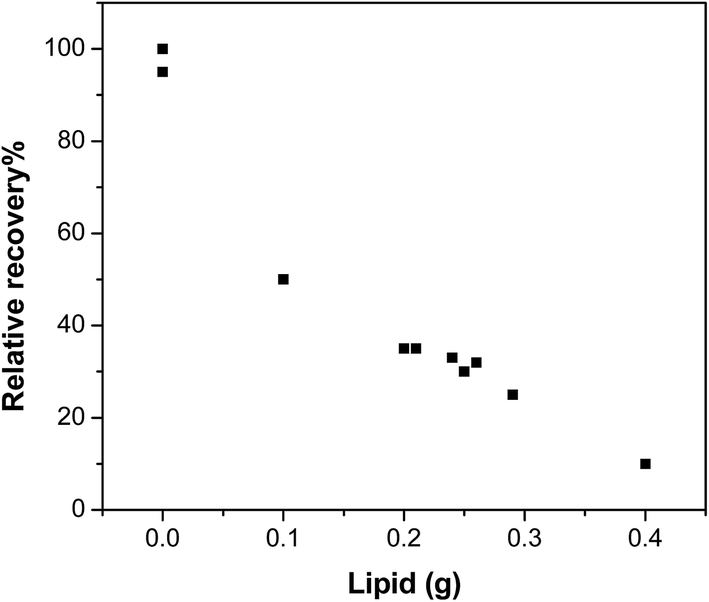 | ||
| Fig. 2 Example of the influence of the presence of lipid content in the extract on the relative recovery of musk xylene during the purge & trap (data are normalised to the recovery at 0 g of lipid). | ||
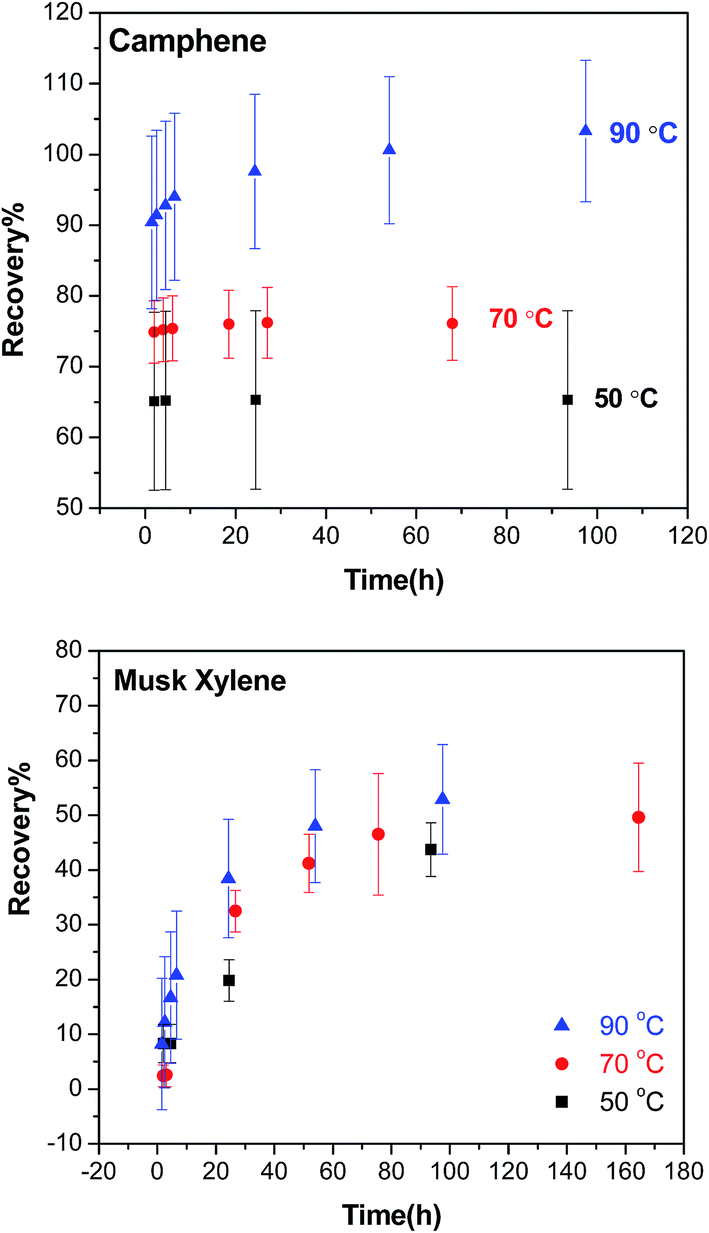 | ||
| Fig. 3 Temperature curves showing the recovery (absolute) of camphene and musk xylene in the purge & trap step at 50 °C (black square), 70 °C (red dot) and 90 °C (blue triangle) over time. | ||
In general, higher temperature resulted in higher recoveries for both compounds during the purge & trap, but the effect of temperature on recovery is more pronounced for camphene than musk xylene, and absolute recoveries that overlap 100% are achievable for the more volatile camphene (Fig. 3). For volatile compounds such as camphene, the maximum extractable fraction of the chemical reached the SPE cartridge after a short time, particularly at 50 °C and 70 °C, for which no further increase of the recovery was obtained beyond 1 h. In contrast, for musk xylene, longer extraction times did increase the recovery, and measurable amounts of musk xylene were collected in the SPE even after 100 h of extraction at 90 °C.
We expected the recoveries of target chemicals in the purge & trap step might be related to their physicochemical properties, such as the octanol/air partition coefficient (KOA) and vapour pressure (VP), retention time (RT) on GC and molecular weight (MW), therefore, the absolute recoveries at 70 °C of these chemicals were plotted against logKOA, logVP, RT and MW. Significant correlations were observed with the best correlation found between the recoveries and logKOA (Fig. 4) with others shown in Fig. S2 in the ESI.†
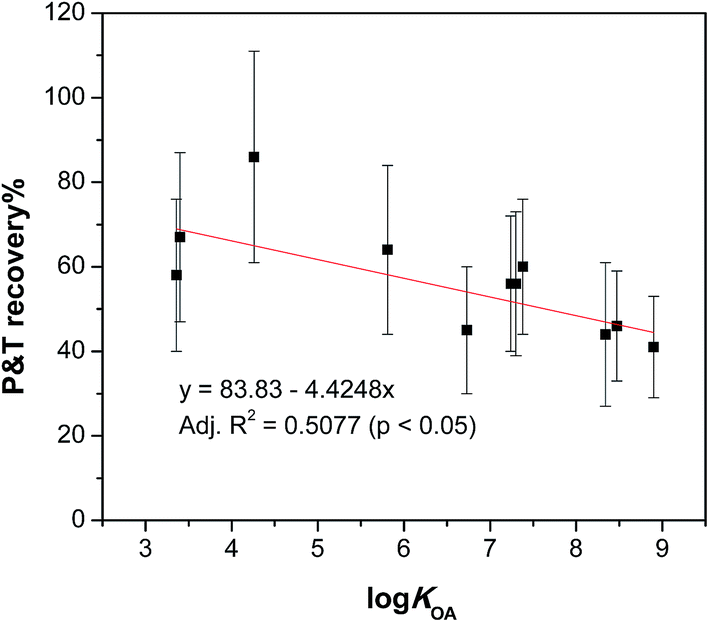 | ||
| Fig. 4 Absolute recoveries of test chemicals in the purge & trap step at 70 °C as a function of logKOA. | ||
The surrogate standards were used to correct the recovery from the purge & trap extraction.30 Two examples with musk xylene (with its isotopically labelled standard – MX-d15) and globanone (for which no isotopically labelled standard is available, so MX-d15 was used instead) are given in Fig. 5. After correction, recoveries of 76% (at 3 h)–96% (165 h) were calculated, and recoveries were 90% (musk xylene) and 92% (globanone) after 24 h, after which no remarkable changes were observed.
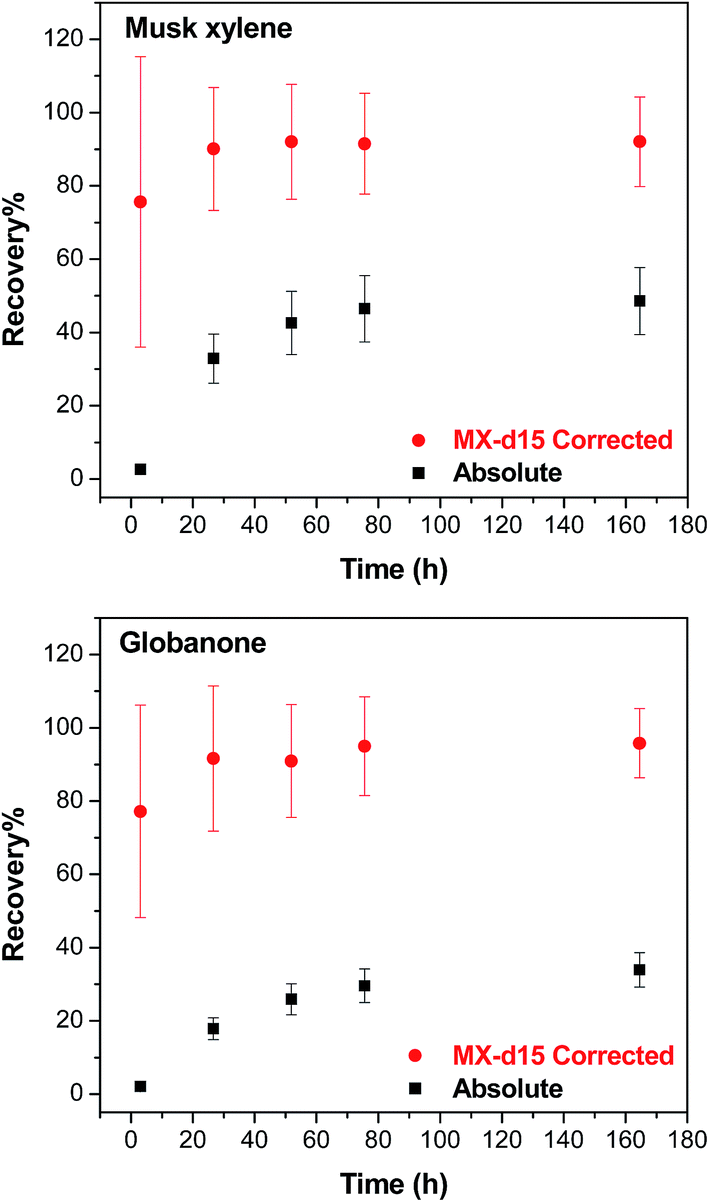 | ||
| Fig. 5 Recovery as a function of time for the purge & trap extraction at 70 °C for musk xylene and globanone presented as the absolute recovery (black square) and recovery corrected to the surrogate standard (musk xylene-d15) (red dot). | ||
3.5 Recoveries
Experimental recoveries of the individual steps (without the matrix) in our extraction procedure, i.e. UAE, solvent exchange and purge & trap, and the overall recovery with the matrix are reported in Table 4, while the overall relative recoveries after correction with surrogate standards are given in Table 5. The absolute overall recoveries for the surrogate standards are presented in Table S1 in the ESI.† Recoveries for the UAE step were from 53% (DPMI) to 93% (HCB) and were 48% (DPMI)–85% (camphene/limonene) and 41% (musk xylene)–86% (limonene) for the solvent exchange and purge & trap phases, respectively. The overall recovery with the matrix ranged from 20% (PCB52) to 88% (limonene), while the overall relative recoveries were 62% (α-pinene)–119% (limonene) and 68 (α-pinene)–124% (cyclohexyl salicylate) for those without and with the matrix, respectively (Table 5).| Substance | Stepwise recovery without the matrix | Overall recovery with the matrix | ||
|---|---|---|---|---|
| UAE | Solvent exchange | Purge & trap | ||
| α-Pinene | 89 ± 15% | 84 ± 5.1% | 58 ± 18% | 50 ± 11% |
| Camphene | 89 ± 15% | 85 ± 5.4% | 67 ± 20% | 62 ± 12% |
| Limonene | 91 ± 10% | 85 ± 5.3% | 86 ± 25% | 88 ± 17% |
| Verdox | 74 ± 1.0% | 66 ± 8.7% | 64 ± 20% | 79 ± 16% |
| DPMI | 53 ± 4.3% | 48 ± 13% | 45 ± 15% | 73 ± 24% |
| HCB | 93 ± 0.83% | 81 ± 3.3% | 60 ± 16% | 58 ± 18% |
| Cyclohexyl salicylate | 69 ± 3.5% | 65 ± 12% | 44 ± 17% | 65 ± 17% |
| Acetyl cedrene | 79 ± 2.9% | 72 ± 8.8% | 56 ± 16% | 61 ± 23% |
| Musk xylene | 56 ± 5.6% | 51 ± 15% | 41 ± 12% | 46 ± 31% |
| Globanone | 82 ± 1.8% | 76 ± 6.9% | 56 ± 17% | 36 ± 23% |
| PCB52 | 87 ± 2.2% | 79 ± 6.5% | 46 ± 13% | 20 ± 15% |
| Substance | Overall recovery | Intra RSD | Inter RSD | LOD (ng g−1, ww) | LOQ (ng g−1, ww) | |
|---|---|---|---|---|---|---|
| Without the matrix | With the matrix | |||||
| α-Pinene | 62 ± 2.1% | 68 ± 11% | 12% | 14% | 4.4 | 8.3 |
| Camphene | 118 ± 8.7% | 81 ± 5.4% | 6.7% | 6.6% | 1.9 | 3.4 |
| Limonene | 119 ± 3.2% | 86 ± 5.6% | 3.3% | 5.7% | 3.7 | 6.8 |
| Verdox | 104 ± 1.0% | 95 ± 4.2% | 4.5% | 4.3% | 1.1 | 2.1 |
| DPMI | 100 ± 3.1% | 99 ± 14% | 14% | 15% | 0.081 | 0.17 |
| HCB | 102 ± 0.30% | 98 ± 0.75% | 1.1% | 2.1% | 1.5 | 2.3 |
| Cyclohexyl salicylate | 75 ± 21% | 124 ± 10% | 21% | 28% | 0.29 | 0.69 |
| Acetyl cedrene | 90 ± 6.9% | 86 ± 4.3% | 2.3% | 3.5% | 1.2 | 3.0 |
| Musk xylene | 104 ± 3.1% | 94 ± 0.97% | 2.8% | 3.9% | 0.063 | 0.11 |
| Globanone | 95 ± 14% | 102 ± 7.7% | 7.5% | 27% | 0.87 | 1.9 |
| PCB52 | 101 ± 0.52% | 100 ± 0.44% | 1.5% | 1.5% | 0.40 | 0.63 |
4 Discussion
4.1 UAE optimisation
Lipids are usually co-extracted from biota with organic chemicals,20,21 even when a mild solvent such as acetonitrile is used. As shown in Table 3, repeated extraction with acetonitrile not only improved the analyte yields but also resulted in more lipid being extracted, particularly in the 5th and the 6th repetition of the extraction. We observed a tendency for more lipophilic compounds, such as PCB52, to require more repeated extractions to achieve yields comparable to other chemicals.The presence of lipids in the purge & trap step reduced the recoveries, as exemplified by the data shown in Fig. 2, for musk xylene. The recoveries of compounds with lower vapour pressure, such as musk xylene, were particularly sensitive to the amount of lipids extracted. Chemicals were less prone to enter the gas phase in the volatile extraction step when there was a high amount of lipids in the system, probably due to the strong association and/or sequestration within lipids.
Considering the UAE and the following purge & trap step together, it is clear that optimisation of overall recoveries require the extraction of a lower amount of lipid in the UAE than would otherwise to be optimal in that step so that recoveries in the purge & trap step are not strongly reduced. We selected 4 times extraction in the UAE with 10 mL of acetonitrile as representing a good balance of the recoveries in the two steps for further experiments.
4.2 Temperature effect on purge & trap
We expected that the target compounds would volatilize faster at higher temperatures. However, increasing the temperature did not strongly affect the rate of volatilization of the target chemicals. In some cases, it did improve the recoveries of the chemicals, as exemplified by camphene in Fig. 3. The higher recoveries at higher temperatures might reflect a lower fraction of a chemical that is sequestered or strongly bound in the lipids and thus not available for volatilization. Our optimisation experiments thus indicated that higher temperature was preferred in order to achieve higher recovery. However, raising the temperature to 90 °C did not improve the overall recoveries across all target chemicals, and it increased the background contamination we observed in our GC/MS analysis. In addition, some analytes showed a tendency to break down at 90 °C, so 70 °C was therefore selected and used in the following experiments.4.3 Time dependence of purge & trap
We expected that more chemical would volatilize with a longer time at a given temperature in the purge & trap step since the extraction rate of purge & trap depends on the partitioning of the analytes out of the sample into the air phase.27 As shown in Fig. 3, at 70 °C, the recovery increased with time up to a point where no more chemical would be extracted from the lipids. The time to reach the plateau depended on the volatility of the compound, the more volatile (higher VP or smaller KOA) the chemical is, the less time it needed to reach the plateau; camphene with a higher VP was fully extracted within 1 hour, while musk xylene which has a lower VP required days. This difference is consistent with the data shown in Fig. 4 where chemicals with higher KOA (thus a lower VP) tend to have lower recoveries, as well as expectations based on the two-film theory of diffusive transfer33 and similar to the results of cyclic volatile methylsiloxanes in the purge & trap system, where the extraction efficiency decreased from D4 to D6 as KOA increases in this order.27It is neither practical nor cost-effective to extract for days in order to get high recoveries of the less volatile compounds, and it is not necessary to wait until all of the extractable chemicals are collected from the lipids in the purge & trap system. The long extraction time can be reduced by the use of surrogate standards, which were selected based on the VP and chemical structure similarity of each target chemical if no corresponding isotopically labelled standard was available (Table 2). Using a surrogate standard as the internal standard, as in a previous study,30 the recovery could be corrected to an acceptable range for all compounds (e.g. 24 h in Tables 4 and 5) as exemplified by two less volatile compounds, musk xylene (with its isotopically labelled chemical) and globanone (without a labelled one, used MX-d15 instead) in Fig. 5. Therefore, 24 h of purge & trap was selected for further studies.
4.4 Repeatability and reproducibility
The robustness of the developed method was assessed by calculating the relative standard deviation (RSD) of repeated analyses within a batch (n = 4 or 5) and among the batches of spiked fish samples. As shown in Table 5, the RSDs for the intra-batch of samples (indicating the repeatability) were 1.1% (HCB) to 21% (cyclohexyl salicylate), with most within 14%, while the RSDs for the three batches of samples in three weeks (representing the reproducibility) were within 15%, except globanone (27%) and cyclohexyl salicylate (28%). These results suggest that the method is generally robust for our purpose of determination of these fragrance compounds in fish samples.5 Conclusions
A simple and reliable method for the determination of nine model compounds representing the constituents of fragrance ingredients with a wide range of volatility in fish was developed by combining ultrasound-assisted extraction (UAE) and purge & trap methods. Four cumulative UAEs with acetonitrile were selected to balance the extraction efficiency with the minimization of the lipid content in the samples. The lipid content in the extracts was found to reduce the efficiency of the extraction in the purge & trap approach, with more lipid resulting in lower recoveries. The purge & trap procedure was affected by the extraction temperature used and extraction time which were optimised to be 70 °C and 24 h (when using the internal standard correction), respectively. This method is generally robust and will be used for further bioaccumulation studies of essential oils in fish.Acknowledgements
Test chemicals were a kind gift from Givaudan, Ashford, United Kingdom; International Flavours and Fragrances (IFF), Hazlet and Symrise, Holzminden, Germany. This research was funded by the Research Institute for Fragrance Materials (RIFM, http://www.rifm.org/).References
- A. M. Api, D. Belsito, M. Bruze, P. Cadby, P. Calow, M. L. Dagli, W. Dekant, G. Ellis, A. D. Fryer, M. Fukayama, P. Griem, C. Hickey, L. Kromidas, J. F. Lalko, D. C. Liebler, Y. Miyachi, V. T. Politano, K. Renskers, G. Ritacco, D. Salvito, T. W. Schultz, I. G. Sipes, B. Smith, D. Vitale and D. K. Wilcox, Food Chem. Toxicol., 2015, 82, S1–S19 CrossRef CAS PubMed.
- R. Amorati, M. C. Foti and L. Valgimigli, J. Agric. Food Chem., 2013, 61, 10835–10847 CrossRef CAS PubMed.
- A. Wei and T. Shibamoto, J. Agric. Food Chem., 2007, 55, 1737–1742 CrossRef CAS PubMed.
- A. E. Edris, Phytother. Res., 2007, 21, 308–323 CrossRef CAS PubMed.
- T. Veriotti and R. Sacks, Anal. Chem., 2001, 73, 4395–4402 CrossRef CAS PubMed.
- M. Brunel, C. Vitrac, J. Costa, F. Mzali, X. Vitrac and A. Muselli, Chem. Biodiversity, 2016, 13, 299–308 CAS.
- H. Laue, H. Gfeller, K. J. Jenner, J. W. Nichols, S. Kern and A. Natsch, Environ. Sci. Technol., 2014, 48, 9486–9495 CrossRef CAS PubMed.
- L. Trabalón, G. Cano-Sancho, E. Pocurull, M. Nadal, J. L. Domingo and F. Borrull, Environ. Res., 2015, 143, 116–122 CrossRef PubMed.
- D. T. Salvito, M. G. H. Vey and R. J. Senna, Flavour Fragrance J., 2004, 19, 105–108 CrossRef CAS.
- B. Bridges, Flavour Fragrance J., 2002, 17, 361–371 CrossRef CAS.
- K. M. Taylor, M. Weisskopf and J. Shine, Environ. Health, 2014, 13, 1–7 CrossRef PubMed.
- R. E. Rogers, D. A. Isola, C. J. Jeng, A. Lefebvre and L. W. Smith, Environ. Sci. Technol., 2005, 39, 7810–7816 CrossRef CAS PubMed.
- A. M. Difrancesco, P. C. Chiu, L. J. Standley, H. E. Allen and D. T. Salvito, Environ. Sci. Technol., 2004, 38, 194–201 CrossRef CAS PubMed.
- OECD, OECD guidelines for testing of chemicals, 2012, TG No. 305 Search PubMed.
- H. Segner, Altern. Lab. Anim., 2015, 43, P14–P16 Search PubMed.
- L. Vallecillos, F. Borrull and E. Pocurull, TrAC, Trends Anal. Chem., 2015, 72, 80–92 CrossRef CAS.
- M. Saraiva, J. Cavalheiro, L. Lanceleur and M. Monperrus, Food Chem., 2016, 200, 330–335 CrossRef CAS PubMed.
- S. C. Cunha, J. O. Fernandes, L. Vallecillos, G. Cano-Sancho, J. L. Domingo, E. Pocurull, F. Borrull, A. L. Maulvault, F. Ferrari, M. Fernandez-Tejedor, F. Van den Heuvel and M. Kotterman, Environ. Res., 2015, 143, 65–71 CrossRef CAS PubMed.
- L. Vallecillos, E. Pocurull and F. Borrull, Talanta, 2015, 134, 690–698 CrossRef CAS PubMed.
- S. Jensen, D. Lindqvist and L. Asplund, J. Agric. Food Chem., 2009, 57, 5872–5877 CrossRef CAS PubMed.
- S. Jensen, L. Häggberg, H. Jörundsdóttir and G. Odham, J. Agric. Food Chem., 2003, 51, 5607–5611 CrossRef CAS PubMed.
- N. Fidalgo-Used, E. Blanco-Gonzalez and A. Sanz-Medel, Anal. Chim. Acta, 2007, 590, 1–16 CrossRef CAS PubMed.
- P. Wang, Q. H. Zhang, Y. W. Wang, T. Wang, X. M. Li, L. Ding and G. B. Jiang, Anal. Chim. Acta, 2010, 663, 43–48 CrossRef CAS PubMed.
- C. Chen, J. Chen, H. Zhao, Q. Xie, Z. Yin and L. Ge, Environ. Int., 2010, 36, 163–167 CrossRef CAS PubMed.
- P. Roose and U. A. T. Brinkman, J. Chromatogr. A, 1998, 799, 233–248 CrossRef CAS.
- P. Roose and U. A. T. Brinkman, Mar. Pollut. Bull., 2000, 40, 1167–1177 CrossRef CAS.
- A. Kierkegaard, M. Adolfsson-Erici and M. S. McLachlan, Anal. Chem., 2010, 82, 9573–9578 CrossRef CAS PubMed.
- M. Adolfsson-Erici, G. Akerman and M. S. McLachlan, Environ. Sci. Technol., 2012, 46, 8205–8211 CrossRef CAS PubMed.
- M. Adolfsson-Erici, G. Akerman and M. S. McLachlan, Environ. Toxicol. Chem., 2012, 31, 1853–1860 CrossRef CAS PubMed.
- R. Y. Xiao, M. Adolfsson-Erici, G. Akerman, M. S. McLachlan and M. MacLeod, Environ. Toxicol. Chem., 2013, 32, 2695–2700 CrossRef CAS PubMed.
- S. L. Simonich, W. M. Begley, G. Debaere and W. S. Eckhoff, Environ. Sci. Technol., 2000, 34, 959–965 CrossRef CAS.
- B. C. Kelly, M. G. Ikonomou, J. D. Blair, A. E. Morin and F. A. P. C. Gobas, Science, 2007, 317, 236–239 CrossRef CAS PubMed.
- D. Mackay, Multimedia Environmental Models: the fugacity approach, CRC Press Taylor & Francis Group, Boca Raton, 2nd edn, 2001 Search PubMed.
Footnote |
| † Electronic supplementary information (ESI) available. See DOI: 10.1039/c7ay00017k |
| This journal is © The Royal Society of Chemistry 2017 |