 Open Access Article
Assessing the feasibility of electrophoretic separation of CaCO3 polymorphs for archaeological applications†
Chuan
Xu
a,
Cole
Walsh
a,
Elisabetta
Boaretto
b and
Kristin M.
Poduska
*a
aDepartment of Physics and Physical Oceanography, Memorial University of Newfoundland, St. John's, NL, Canada. E-mail: kris@mun.ca; Fax: +1 709 864 8739; Tel: +1 709 864 8890
bScientific Archaeology Unit, Weizmann Institute of Science, 7610001 Rehovot, Israel
First published on 6th December 2016
Abstract
We demonstrate a proof-of-principle method to separate particles of two CaCO3 polymorphs, calcite and aragonite, based on surface charge density differences that affect electrophoretic mobility values. Calcite and aragonite standards show significant differences in their electrophoretic mobility distributions in polyphosphate-containing suspensions. Phosphate additives, which are commonly used to reduce particle aggregation, have a serendipitous added benefit of stabilizing CaCO3 against dissolution. However, the mobility differences among archaeologically relevant samples, such as lime plasters and chalk, are not consistently different enough to make this a reliable separation strategy. Nevertheless, this study is important because it takes a new and fundamentally different approach to non-destructive separation of archaeological materials.
1 Introduction
It is a considerable experimental challenge to physically separate two polymorphs, yet this is scientifically and economically important in applications such as drug discovery and environmental remediation.1–3 Polymorph separation can also be important in scientific and cultural applications; an example is archaeological CaCO3. Two different polymorphs of CaCO3, calcite and aragonite, can appear at archaeological sites for different cultural reasons. CaCO3 can be found in building materials, such as lime plaster and mortar, and it is also present in ash from wood-based fires.4,5 Because CaCO3 samples have a high carbon content, they are attractive for radiocarbon dating.6–13 However, since each phase could be formed at different times – and by physical processes with different archaeological implications – it is appealing to be able to date each polymorph separately. For this reason, there are strong incentives to develop non-destructive strategies to separate CaCO3 polymorphs in a way that is thorough and efficient. In this work, we demonstrate a proof-of-principle method to separate calcite and aragonite particles using electrophoretic motion, due to surface charge differences. In doing so, we find that common polyphosphate additives, which are used to reduce particle aggregation, have an added benefit of stabilizing CaCO3 against dissolution.Several methods have been reported for separating calcite and aragonite polymorphs, but none are widely used for radiocarbon dating applications. Acid etching of fossil corals has been shown to preferentially accumulate calcite by dissolving away aragonite, since the two polymorphs have different solubility constants.11 Polymorph-based density differences have been used to separate recrystallized calcite from aragonitic shells for radiocarbon dating applications.12 Others have reported microscale calcite and aragonite separation in geogenic marine carbonates after chemical staining with cobalt nitrate (Meigen's solution) at elevated temperatures. Separation of the stained particles required either manual selection14 or a magnetic field.13
Another strategy for separating particles is based on electrophoresis. When particles are dispersed in aqueous media, their surfaces become charged, and the net surface charge density determines the extent to which the particles can be moved in the presence of electric fields. Electrophoresis has been used to separate different types of particulate matter in mixtures, including complex sediments.3 It also is the basis for electrophoretic deposition of coatings, and it is the driver for protein and nanoparticle movement in porous gel media.15
When calcium carbonate particles are dispersed in water, the particles acquire a negative surface charge density.16–18 This is due to the release of Ca2+ and/or adsorption of anions. The boundary between the charged particle and the bulk solution is defined as the slipping plane. In the presence of an electric potential, the charges inside the slipping plane will move along with the particle. The potential difference between the slipping plane and the bulk solution is defined as the zeta potential, ζ. This potential is related to the particle's surface charge density (electric charge per unit of area), which is independent of particle size.
For CaCO3 in pure water, ζ is typically so small that the particles do not have enough electrostatic repulsion to prevent agglomeration.16 In general, colloidal systems with low ζ (magnitude ≤ 30 mV) are classified as unstable because the particles in the solution tend to coagulate and sediment. This makes separation by electrophoresis impractical unless a dispersant is added to the suspension.19
Different polymorphs of calcium carbonate are known to exhibit different surface charge densities, thereby producing different ζ values. Numerous crystal growth and nucleation studies have examined this as a way to control phase selectivity, or to prevent unwanted mineralization (scaling).20–22 Many investigations have focused on the effect of additives on nucleation, thermodynamic stability,23–26 and facet-specific surface energies27–31 in dry and wet environments.
In this study, we explore the feasibility of polymorph-specific surface charge modification to separate calcite and aragonite by subjecting aqueous suspensions to an electric field. This procedure is particularly attractive for separating material destined for radiocarbon dating because it does not expose the samples to additional sources of carbon – such as organic solvents, oils, or polymers – that could alter a sample's 14C levels. Furthermore, we show that a conventional CaCO3 dispersant (polyphosphate) offers interesting opportunities to advance an unconventional application: electric-field-based polymorph separation.
2 Experimental details
2.1 Suspension preparation and characterization
This study is based on a range of calcium carbonate samples to account for the diverse proveniences that could be relevant in an archaeological context. A full listing of sample origins, and their abbreviated sample names, appears in Table 1. It includes geogenic sources of both polymorphs (calcitic Iceland spar (SC1), aragonitic Mingilla spar (SA1), and calcitic chalk (CC)), as well as a biogenic source of aragonite (Glycymeris insubrica from Ashkelon, Israel (SA2)). Analytical grade calcite powder (SC2, from Merck) was also used. An ancient lime plaster (PY) was characterized extensively in earlier work.6 Modern lime plasters (PM1, PM2) were prepared as described elsewhere, and had aged for seven years at the time of the electrophoretic measurements.32| Sample name | Source material | Polymorph(s) a = aragonite, c = calcite |
|---|---|---|
| Standards | ||
| SC1 | Iceland spar | c |
| SC2 | Purchased calcite | c |
| SA1 | Mingilla spar | a |
| SA2 | Glycymeris | a |
![[thin space (1/6-em)]](https://www.rsc.org/images/entities/char_2009.gif) |
||
| Plasters | ||
| PY | Ancient plaster (Yiftahel) | c |
| PM1 | Modern plaster | a, c |
| PM2 | Modern plaster | c |
| CC | Geogenic chalk (Nesher) | c |
Suspensions of CaCO3 particles were prepared by hand grinding the solid specimens into fine powders, and then adding 0.05 grams of solid to 1 mL of ultrapure water (18.2 MΩ cm, Barnstead NANOpure Diamond). In some experiments, technical grade sodium hexametaphosphate (SHMP, from Alfa Aesar) was added to the suspensions in 2.5–10 mM concentrations in order to prevent particle aggregation.19 Suspensions were analyzed within a few hours after preparation. In addition, some suspensions were retained and monitored for up to one year, stored under uncontrolled ambient conditions. For these long-term stability studies, other sources of phosphate ions were also tested for comparison, including analytical grade NaH2PO4·H2O (5 mM), and also ultrapure water that had been in contact for seven days with one of three powdered minerals (Ca5(PO4)3OH, aragonite, or calcite). Particle size distributions in the suspensions were assessed using laser Doppler velocimetry with a Malvern Zetasizer Nano.
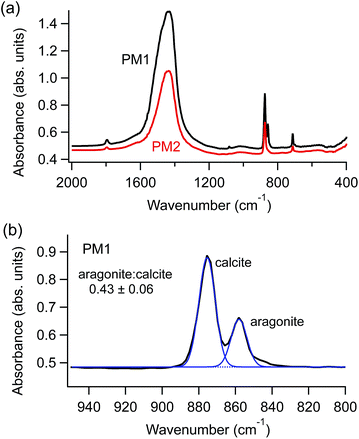
Fourier transform infrared (FTIR) spectroscopy measurements (Nicolet 380) provided information about the polymorphic composition of each sample. Spectra were collected on the hand-ground powders prior to preparing the suspensions; representative spectra are shown in Fig. 1a. Spectra were also collected on dried aliquots of the suspensions after different periods of time, ranging from one hour to one year. In samples that contained both aragonite and calcite polymorphs, we used peak deconvolution, after baseline subtraction, to compare relative peak intensities (IgorPro, Wavemetrics), as shown in Fig. 1b.
2.2 Electrophoretic measurements
By subjecting our CaCO3 suspensions to an electric field, the charged particles move toward the electrode with opposite charge. The measured electrophoretic mobility UE is related to properties of the suspension through the Henry equation: | (1) |
Zeta potential measurements were executed with a Malvern Zetasizer Nano using either a universal dip cell (Malvern ZEN1002) or a folded-capillary cell (Malvern DTS1070) at 20 °C, each with ∼1 mL volume. This instrument is highly automated to facilitate rapid data analysis. A single source laser (633 nm) produces two coherent beams: one passes through the liquid cell, and the other goes directly to the detector. The phase difference between the two beams is recorded as a function of time. When the applied field is reversed rapidly (tens of milliseconds), the particles in the suspension reach terminal velocity, and the electroosmotic flow is insignificant. The slopes of the phase difference plot obtained during this fast field reversal were averaged to obtain a mean phase difference, and hence a mean electrophoretic mobility. To get information about the distribution of particle velocities, additional data were recorded while applied field was reversed slowly (hundreds of milliseconds).
To extract electrophoretic mobility information from these data, we used the Malvern software supplemented by our own data treatment. This combination was necessary to circumvent a smoothing algorithm that the Malvern software implements by default in its electrophoretic mobility plots. First, a Fourier transformed version of slow field reversal portion of the phase difference plot gave us a frequency (Doppler) spectrum. After correcting for the modulator frequency (320 Hz) and adjusting the baseline, we implemented a correction for the electroosmotic flow by adding the difference between the true frequency shift (obtained during the fast field reversal) and the mean of the adjusted frequency shift distribution. We then converted the Doppler frequencies to electrophoretic mobility values using a linear equation that depends on the fringe spacing, cell spacing, and electric field.
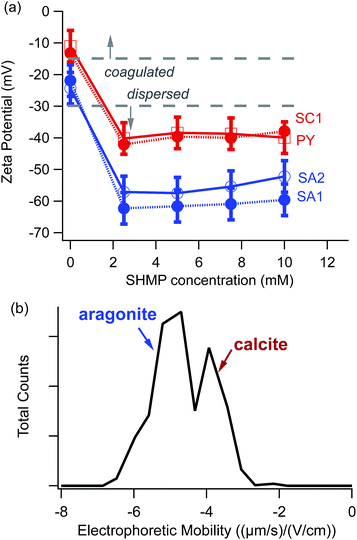
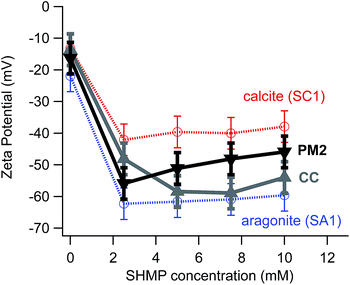
Results in this manuscript are based on data collected from hundreds of electrophoretic mobility measurements on different CaCO3-containing suspensions. Error bars for ζ values (Fig. 2 and 5) include contributions due to differences among distinct aliquots of identically prepared suspensions, as well as differences among multiple measurements on the same aliquot.
Even though the electrophoretic mobility of a particle does not directly depend on its size (eqn (1)), this kind of information can be helpful. For our studies, light scattering measurements are preferable to image-based assessments because light scattering is related to the size distributions while the particles are in suspension. In our suspensions, flocculation and sedimentation occurred rapidly when no SHMP was present. As a result, the effective sizes of the scatterers changed too rapidly for the light scattering data to give meaningful size information. Even with the addition of polyphosphate dispersant, light scattering experiments proved to be difficult in our suspensions because of their high degree of polydispersity. Further details and representative particle size distributions from light scattering data are provided in ESI.†
3 Results
3.1 Electrophoretic mobilities
To compare results among different powders, we measured electrophoretic mobilities and then converted them to the more standard comparison parameter ζ, according to eqn (1). Fig. 2a shows the resulting ζ values for representative calcite and aragonite samples, obtained using different amounts of the SHMP dispersant. With no SHMP, calcite and aragonite have low magnitude ζ values (less than 30 mV). We observed that particles in SHMP-free suspensions sedimented completely within tens of minutes. However, once SHMP was added to the same suspension, the suspension remained cloudy for several hours. Particles in SHMP-containing suspensions displayed much more negative ζ (50–65 mV). It is notable that our two calcite standards (geogenic spar calcite (SC1) and ancient calcite plaster (PY)) have identical electrophoretic mobility values over the range of 0–10 mM SHMP, and that these values are distinct from those of the two aragonite standards (geogenic spar aragonite (SA1) and bivalve aragonite (SA2)).The distinct ζ values between calcite (SC1) and aragonite (SA2) persist, even when the two polymorphs are mixed together. Fig. 2b shows a bimodal distribution in the electrophoretic mobility histogram that is consistent with the ζ values measured for each polymorph individually (Fig. 2a). Although there is some overlap between the calcite and aragonite peaks, this plot demonstrates, in principle, that there is sufficient difference in the mobility distributions to allow for electrophoretic separation of these two polymorphs.
3.2 Long-term suspension stability
We observed an additional benefit of SHMP, beyond increasing ζ: it prevents the preferential dissolution of aragonite when it is in contact with water. Fig. 3 compares changes in relative FTIR peak intensities (as described in Fig. 1b) for a modern plaster sample. This specimen contained a mixture of the two polymorphs, with an aragonite![[thin space (1/6-em)]](https://www.rsc.org/images/entities/char_2009.gif) :
:![[thin space (1/6-em)]](https://www.rsc.org/images/entities/char_2009.gif) calcite value near 0.5. The specimen was homogenized, divided, and then used to make aqueous suspensions. Small aliquots were then extracted from each suspension at different points in time, ranging from one hour to one year, and then dried prior to FTIR measurements. Data in Fig. 3 show that suspensions in nanopure water, and those enriched in carbonate, showed a consistent and dramatic decrease in the amount of detected aragonite over time. However, suspensions that included SHMP or other phosphates had very different trends. Spectra for material from phosphate-containing suspensions had aragonite
calcite value near 0.5. The specimen was homogenized, divided, and then used to make aqueous suspensions. Small aliquots were then extracted from each suspension at different points in time, ranging from one hour to one year, and then dried prior to FTIR measurements. Data in Fig. 3 show that suspensions in nanopure water, and those enriched in carbonate, showed a consistent and dramatic decrease in the amount of detected aragonite over time. However, suspensions that included SHMP or other phosphates had very different trends. Spectra for material from phosphate-containing suspensions had aragonite![[thin space (1/6-em)]](https://www.rsc.org/images/entities/char_2009.gif) :
:![[thin space (1/6-em)]](https://www.rsc.org/images/entities/char_2009.gif) calcite peak intensities that were consistent with those from the original starting material, even after the particulates had been in contact with water for one year.
calcite peak intensities that were consistent with those from the original starting material, even after the particulates had been in contact with water for one year.
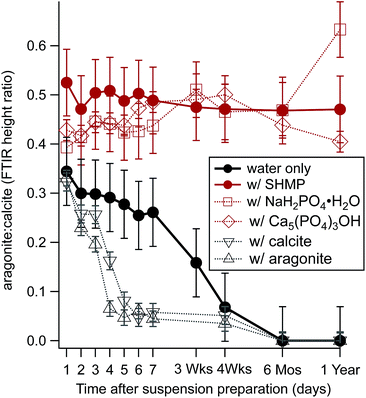 | ||
Fig. 3 Time evolution of aragonite![[thin space (1/6-em)]](https://www.rsc.org/images/entities/char_2009.gif) : :![[thin space (1/6-em)]](https://www.rsc.org/images/entities/char_2009.gif) calcite FTIR peak height ratios for a mixed aragonite–calcite plaster that had been stored in different aqueous solutions, including ultrapure water (solid black circles) and ultrapure water with 5 mM SHMP (solid red circles). Other solutions had either phosphate ions (open red symbols) or carbonate ions (open black symbols). The FTIR peak ratio compares calcite's 878 cm−1 peak with aragonite's 858 cm−1 peak, as shown in Fig. 1b. calcite FTIR peak height ratios for a mixed aragonite–calcite plaster that had been stored in different aqueous solutions, including ultrapure water (solid black circles) and ultrapure water with 5 mM SHMP (solid red circles). Other solutions had either phosphate ions (open red symbols) or carbonate ions (open black symbols). The FTIR peak ratio compares calcite's 878 cm−1 peak with aragonite's 858 cm−1 peak, as shown in Fig. 1b. | ||
4 Discussion
As a proof-of-principle, the electrophoretic mobility distribution differences between calcite and aragonite (Fig. 2b) are encouraging for electrophoretic polymorph separation. However, there are two substantive challenges in making electrophoretic separation practical for archaeological samples: the likelihood of heterogeneous surface charge densities on a single particle, and the likelihood of a heterogeneous ensemble of particles. Fortuitously, we found that polyphosphate dispersants prevent a third potential challenge: particle dissolution. We now discuss each of these challenges in turn.4.1 Heterogeneous surface charge density on an individual particle
The simplest model for electrokinetics, based on eqn (1), describes the motion of spherical particles that have a uniform surface charge density. However, our CaCO3 particles are neither spherical nor uniformly charged. Literature has shown that electrokinetic studies of particles with non-uniform surface charge densities present significant experimental and theoretical challenges.33Because the electrophoretic experiments take place in aqueous suspensions, it is important to consider surface charge densities for calcite and aragonite when they are in contact with water. Many experimental and theoretical studies have investigated the equilibrium morphologies of CaCO3 polymorphs.20,25,29,30 For calcite, the influence of water favours rhombohedral particles with {10![[1 with combining macron]](https://www.rsc.org/images/entities/char_0031_0304.gif) 4} faces, which are terminated with equal concentrations of CO32− and Ca2+.29 In contrast, aragonite shows more acicular particles. The terminal ions on aragonite's predominant faces ({010} and {110}) are Ca2+, while the less stable {011} face is terminated by CO32−.25,29,30 Thus, the most stable faces of aragonite are polar (with a non-zero net charge density), while the most stable faces for calcite have zero net charge. This suggests that perfectly formed crystallites of calcite should have ζ near zero, while the magnitude of aragonite's characteristic ζ should be larger because aragonite can adsorb more negatively charged ions on its equilibrium faces.20 Indeed, data in Fig. 2a demonstrates that, in the presence of phosphate anions, aragonite has a more negative ζ compared to that for calcite.
4} faces, which are terminated with equal concentrations of CO32− and Ca2+.29 In contrast, aragonite shows more acicular particles. The terminal ions on aragonite's predominant faces ({010} and {110}) are Ca2+, while the less stable {011} face is terminated by CO32−.25,29,30 Thus, the most stable faces of aragonite are polar (with a non-zero net charge density), while the most stable faces for calcite have zero net charge. This suggests that perfectly formed crystallites of calcite should have ζ near zero, while the magnitude of aragonite's characteristic ζ should be larger because aragonite can adsorb more negatively charged ions on its equilibrium faces.20 Indeed, data in Fig. 2a demonstrates that, in the presence of phosphate anions, aragonite has a more negative ζ compared to that for calcite.
In real suspensions, values of ζ will change based on the types of ions and their concentrations in the solution. Adsorption of these ions will change the surface charge density differently on different crystallite faces, depending on the kinds of terminal ions that each has. In pure water, the available ions are mostly from dissolved atmospheric CO2. Our experiments involved polyphosphate dispersants, which served as a source of anions. Solution pH also affects ζ; for example, theoretical models have been developed to explain electrophoretic mobility values for nanoparticles in porous gels.15
There are other reasons why an individual particle can have a non-uniform surface charge density. Before our powdered CaCO3 samples were dispersed in solution, they had to be crushed, ground, and sieved to make particles small enough to remain suspended during an electrophoresis experiment. This mechanical treatment yields particles with a wide range of sizes and non-equilibrium shapes. As an example, Fig. 4 is a scanning electron micrograph of crushed spar calcite. The abraded and fractured particles have regions of their surfaces where higher energy faces are exposed. It is also possible there can be pre-existing surface contamination on these natural materials, whether from biogenic, geogenic, or anthropogenic sources. For these reasons, it is not surprising that the effective surface charge densities of particles in our suspensions can deviate from the theoretical ideal.
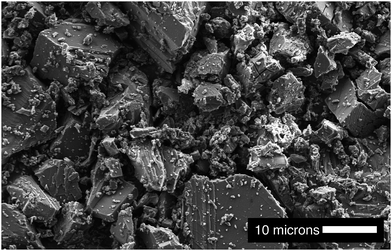 | ||
| Fig. 4 Scanning electron microscope image of spar calcite powders demonstrate that even faceted particles have fractures and irregular surface features after crushing and grinding. | ||
Although there are many potential complications related to heterogeneous surface charge density, our data do show ζ differences between calcite and aragonite over a range of different experimental conditions (Fig. 2a). Nevertheless, ζ differences are not robust for all types of samples that one would need to consider for archaeological contexts. Fig. 5 illustrates a typical challenge for effective electrophoretic separation of archaeologically relevant calcite and aragonite. It shows ζ values for two common kinds of “contaminants” to an ancient archaeological sample: a modern calcite plaster (PM2), and a geogenic source of calcite (chalk, CC). The electrophoretic mobilities for these contaminants do not align cleanly with a standard source of calcite (SC1), even though FTIR data confirm that PM2, CC, and SC1 are all composed of pure calcite. This means that electrophoretic methods would not separate these contaminants completely from standard aragonite (SA1).
4.2 Heterogeneous ensemble of particles
It is important to remember that powders contain a large number of particles, and that each ζ measurement in this study provides information about the distribution of electrophoretic mobility values in an ensemble of many thousands of suspended particles. Histograms from electrophoretic mobility measurements in this study (Fig. 2b) show that there is significant width to the distribution of values for both polymorphs. This demonstrates that individual particles deviate from their ideal ζ values to different extents, and thus we have a heterogeneous ensemble of particles.It is neither practical nor helpful to undertake a detailed surface study on individual particles, since it is not clear how representative it would be of the aggregate sample. In an attempt to get surface information on a large collection of particles, we used Kelvin probe measurements (Asylum Research MFP-3D atomic force microscope) on dry, pelletized powder samples to try to detect differences in surface charge among particles from a mixed calcite–aragonite modern plaster (PM1, Fig. 1b). Our results were inconclusive when using either pristine surfaces or powders treated with SHMP. We attribute this null result to the poorly defined crystallite morphologies and surfaces, since the large topographical features likely overwhelmed any measurable surface potential differences.
4.3 Particle dissolution
Despite the difficulties inherent in electrophoretic separation of calcite and aragonite, our investigations yield interesting observations related to interactions between phosphate and CaCO3 that are not addressed well in the literature. We found that SHMP stabilizes solution pH very rapidly (Fig. 6). Even in mM amounts, SHMP-containing suspensions have very stable pH values over a span of hours. The pH stability could be related to several phenomena. For example, phosphate ions are widely used for their buffering capacity, which would keep the suspension pH stable. It is also possible that phosphate anions, adsorbed to the particle surfaces, could play a role passivation that prevents dissolution. Our studies of long-term suspension stability (Fig. 3) demonstrate that CaCO3 particles – especially aragonite – do dissolve when there is no phosphate present. Regardless of the cause, this phenomenon is very convenient for us because it keeps suspensions stable for a sufficient amount of time to complete electrophoresis experiments.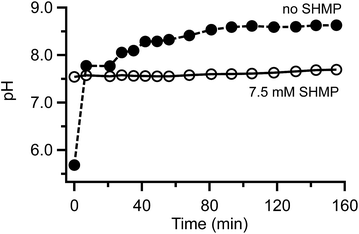 | ||
| Fig. 6 Comparison of pH vs. time for calcite in the presence and absence SHMP. Uncertainty values are contained within the size of the markers. | ||
It is not clear from the literature if phosphate can adsorb readily to all faces of calcite and aragonite, both polar and non-polar, or what the resulting net surface charges would be for each face. Many reports have used adsorption isotherms to study adsorption and desorption of different ions on calcite and aragonite.34,35 Some experiments have used NMR to identify phosphate in the form of surface precipitates,36 while others have focused on interactions between water and phosphate.37 Theoretical simulations of these scenarios are very complicated due to the complex solution equilibria in buffering (phosphate) electrolytes. Nevertheless, some reports have paired experiments with complexation modeling for phosphate and arsenate adsorption on calcite,38,39 while others have modeled phosphorus speciation on calcite and dolomite.40
4.4 Archaeological implications
Polymorph separation for radiocarbon dating applications has been attempted by a few groups,12,13 but our work is the first attempt to explore electrophoretic properties as a means of non-destructive calcite–aragonite separation.The main target of our attempt was lime plaster because this material has proven to be very challenging for radiocarbon dating.41 Plaster is produced by heating CaCO3 above its decomposition temperature (near 750 °C) to produce lime (CaO), which then converts to portlandite (Ca(OH)2) upon exposure to humidity or water. Carbon becomes incorporated in the Ca(OH)2 only when it interacts with atmospheric CO2 that has been dissolved in the water, and this recarbonation process is typically completed within months to years. Thus, measuring the 14C levels in the resulting CaCO3 plaster gives the date that the plaster cured.
Until recently, it was widely assumed that aragonite discovered in archaeological plaster was related to biogenic contamination, such as snail or bivalve shells. This was based on the fact that aragonite is less thermodynamically stable than calcite (under ambient conditions) and has a faster dissolution rate, which makes it relatively rare in geological settings.25 However, there is now evidence that anthropogenic lime plasters can be produced as a mixture of aragonite and calcite.4 This presents an interesting question about whether dating aragonite and calcite portions of a plaster sample separately could help distinguish between foreign aragonite (such as from shells) and aragonite formed during the original plaster production process. As of now, this remains an open question.
Our focus on polymorph separation for radiocarbon dating applications introduces some constraints to the electrophoretic separation method. For example, we chose to conduct our experiments in aqueous electrolytes to avoid contaminating our samples with carbon that originates from organic solvents, oils, agar gels, or polymers. This introduced some practical disadvantages. Large voltages are required to move our charged particles, and these voltages cause water hydrolysis. The O2 evolution and H2 evolution reactions associated with hydrolysis cause dramatic pH gradients to form between the electrodes. Furthermore, the bubbles that form as these gases are produced can cause fluid motion that interferes with the electrophoretic motion of the particles.
Finally, it is worth noting that our findings have important general implications for working with powdered CaCO3 samples in aqueous environments. We found evidence that crushed samples react readily with water to cause time-dependent pH changes (Fig. 6), and preferential dissolution of aragonite (Fig. 3). This means that standard rinsing and sorting procedures that are used to clean archaeological samples would remove some surface calcite, and an even larger portion of aragonite.
5 Conclusions
Electrophoretic separation of calcite and aragonite appears to be possible in theory, but it is not trivial to put into practice. Our study was targeted for archaeological applications, and we applied the method to lime plaster and mortar samples in order to assess the feasibility of extracting polymorph-specific powder fractions to use for radiocarbon dating. Even though our calcite and aragonite standards showed significant differences in their electrophoretic mobility distributions in polyphosphate-containing suspensions, the mobility differences between lime plasters and geogenic contaminants are not consistently different enough to make this a reliable separation strategy. Nevertheless, this study is important because it takes a new and fundamentally different approach to non-destructive separation of archaeological materials, using surface chemistry differences.Acknowledgements
We thank Dr V. Booth (Memorial University), Dr R. Klajn (Weizmann Institute), and Dr Orit Gal (Hebrew University) for access to zetasizer instruments. We also thank Dr J. Cheng, M. Bennett, J. Ford, and A. Rose for preliminary zetasizer measurements. Thanks to Dr E. Klein (Weizmann Institute) for assistance with electron microscopy imaging.References
- D. S. Sholl and R. P. Lively, Nature, 2016, 532, 435–437 CrossRef PubMed.
- M. B. J. Atkinson, D. K. Bwambok, J. Chen, P. D. Chopade, M. M. Thuo, C. R. Mace, K. A. Mirica, A. A. Kumar, A. S. Myerson and G. M. Whitesides, Angew. Chem., Int. Ed., 2013, 52, 10208–10211 CrossRef CAS PubMed.
- H. Moayedi, S. Kazemian, K. A. Kassim, R. Nazir and M. Raftari, J. Dispersion Sci. Technol., 2013, 34, 1273–1279 CrossRef CAS.
- M. B. Toffolo and E. Boaretto, J. Archaeol. Sci., 2014, 49, 237–248 CrossRef CAS.
- P. Baraldi, C. Baraldi, R. Curina, L. Tassi and P. Zannini, Vib. Spectrosc., 2007, 43, 420–426 CrossRef CAS.
- K. M. Poduska, L. Regev, F. Berna, E. Mintz, I. Milevski, H. Khalaily, S. Weiner and E. Boaretto, Radiocarbon, 2012, 54, 887–896 CrossRef CAS.
- K. Al-Bashaireh and G. W. Hodgins, Radiocarbon, 2012, 54, 905–914 CrossRef CAS.
- A. Lindroos, L. Regev, M. Oinonen, Å. Ringbom and J. Heinemeier, Radiocarbon, 2012, 54, 915–931 CrossRef CAS.
- G. L. A. Pesce, R. J. Ball, G. Quarta and L. Calcagnile, Radiocarbon, 2012, 54, 933–942 CrossRef CAS.
- I. Hajdas, J. Trumm, G. Bonani, C. Biechele, M. Maurer and L. Wacker, Radiocarbon, 2012, 54, 897–903 CrossRef CAS.
- T.-C. Chiu, R. G. Fairbanks, R. A. Mortlock and A. L. Bloom, Quat. Sci. Rev., 2005, 24, 1797–1808 CrossRef.
- K. Douka, R. E. M. Hedges and T. F. G. Higham, Radiocarbon, 2010, 52, 735–751 CrossRef CAS.
- T. T. Hang, K. Kato and H. Wada, Geochem. J., 2014, 48, 113–119 CrossRef CAS.
- K. Kato, H. Wada and K. Fujioka, Geochem. J., 2003, 37, 291–297 CrossRef CAS.
- R. J. Hill, Soft Matter, 2016, 12, 8030–8048 RSC.
- P. Moulin and H. Roques, J. Colloid Interface Sci., 2003, 261, 115–126 CrossRef CAS PubMed.
- P.-Q. Yuan, Z.-M. Chen, Z.-M. Zhou, W.-K. Yuan and R. Semiat, Colloids Surf., A, 2008, 328, 60–66 CrossRef CAS.
- R. Eriksson, J. Merta and J. B. Rosenholm, J. Colloid Interface Sci., 2007, 313, 184–193 CrossRef CAS PubMed.
- R. Mehrotra and N. R. Dhar, Proc. Natl. Inst. Sci. India, 1949, 16, 59–65 Search PubMed.
- P. V. Smallwood, Colloid Polym. Sci., 1977, 255, 881–886 CAS.
- K. Sawada, Pure Appl. Chem., 1997, 5, 921–928 Search PubMed.
- I. Sondi, J. Bišćan, N. Vdović and S. D. Šcapin, Colloids Surf., A, 2009, 342, 84–91 CrossRef CAS.
- Y. Kitano, M. Okmura and M. Idogaki, Geochem. J., 1978, 12, 29–37 CrossRef CAS.
- M. Donnet, P. Bowen and J. Lemâitre, J. Colloid Interface Sci., 2009, 340, 218–224 CrossRef CAS PubMed.
- A. Radha and A. Navrotsky, Rev. Mineral. Geochem., 2013, 77, 73–121 CrossRef CAS.
- W. Sekkal and A. Zaoui, Sci. Rep., 2013, 3, 1587 CAS.
- N. H. de Leeuw and S. C. Parker, J. Phys. Chem. B, 1998, 102, 2914–2922 CrossRef CAS.
- F. Heberling, T. P. Trainor, J. Lützkirchen, P. Eng, M. A. Denecke and D. Bosbach, J. Colloid Interface Sci., 2011, 354, 843–857 CrossRef CAS PubMed.
- M. Bruno, F. R. Massaro, L. Pastero, E. Costa, M. Rubbo, M. Prencipe and D. Aquilano, Cryst. Growth Des., 2013, 13, 1170–1179 CAS.
- A. M. Bano, P. M. Rodger and D. Quigley, Langmuir, 2014, 30, 7513–7521 CrossRef CAS PubMed.
- M. P. Andersson, J. D. Rodriguez-Blanco and S. L. S. Stipp, Geochim. Cosmochim. Acta, 2016, 176, 198–205 CrossRef CAS.
- L. Regev, K. M. Poduska, L. Addadi, S. Weiner and E. Boaretto, J. Archaeol. Sci., 2010, 37, 3022–3029 CrossRef.
- M. Zembala, Adv. Colloid Interface Sci., 2004, 112, 59–92 CrossRef CAS PubMed.
- F. Millero, F. Huang, X. Zhu, X. Liu and H.-Z. Zhang, Aquat. Geochem., 2001, 7, 33–56 CrossRef CAS.
- A. Durán-Álvarez, M. Maldonado-Domínguez, O. González-Antonio, C. Durán-Valencia, M. Romero-Ávila, F. Barragán-Aroche and S. Lópex-Ramírez, Langmuir, 2016, 32, 2608–2616 CrossRef PubMed.
- H. E. Mason, S. Frisia, Y. Tang, R. J. Reeder and B. L. Phillips, Earth Planet. Sci. Lett., 2007, 254, 313–322 CrossRef CAS.
- S. Kababya, A. Gal, K. Kahil, S. Weiner, L. Addadi and A. Schmidt, J. Am. Chem. Soc., 2015, 137, 990–998 CrossRef CAS PubMed.
- H. U. Sø, D. Postma, R. Jakobsen and F. Larsen, Geochim. Cosmochim. Acta, 2011, 75, 2911–2923 CrossRef.
- H. U. Sø, D. Postma, R. Jakobsen and F. Larsen, Geochim. Cosmochim. Acta, 2012, 93, 1–13 CrossRef.
- N. Xu, M. Chen, K. Zhou, Y. Wang, H. Yin and Z. Chen, RSC Adv., 2014, 4, 35205–35214 RSC.
- E. Boaretto and K. M. Poduska, J. Mater., 2013, 65, 481–488 CAS.
Footnote |
| † Electronic supplementary information (ESI) available: Particle size distributions from light scattering data. See DOI: 10.1039/c6ay03186b |
| This journal is © The Royal Society of Chemistry 2017 |

