
Online fluorescence anisotropy immunoassay for monitoring insulin secretion from islets of Langerhans†
Adrian M.
Schrell
,
Nikita
Mukhitov
,
Lian
Yi
,
Joel E.
Adablah
,
Joshua
Menezes
and
Michael G.
Roper
 *
*
Department of Chemistry and Biochemistry, Florida State University, 95 Chieftain Way, Dittmer Building, Tallahassee, FL 32306, USA. E-mail: roper@chem.fsu.edu; Fax: +1-850-644-8281; Tel: +1-850-644-1846
First published on 28th October 2016
Abstract
Insulin secretion from islets of Langerhans is a dynamic process that is essential for maintaining glucose homeostasis. The ability to measure dynamic changes in insulin levels upon glucose stimulation from single islets will allow testing of therapeutics and investigating mechanisms of defective secretion observed in metabolic diseases. Most approaches to date for measurement of rapid changes in insulin levels rely on separations, making the assays difficult to translate to non-specialist laboratories. To enable rapid measurements of secretion dynamics from a single islet in a manner that will be more suitable for transfer to non-specialized laboratories, a microfluidic online fluorescence anisotropy immunoassay was developed. A single islet was housed inside a microfluidic chamber and stimulated with varying glucose levels from a gravity-based perfusion system. The total effluent of the islet chamber containing the islet secretions was mixed with gravity-driven solutions of insulin antibody and Cy5-labeled insulin. After mixing was complete, a linearly polarized 635 nm laser was used to excite the immunoassay mixture and the emission was split into parallel and perpendicular components for determination of anisotropy. Key factors for reproducible anisotropy measurements, including temperature homogeneity and flow rate stability were optimized, which resulted in a 4 nM limit of detection for insulin with <1% RSD of anisotropy values. The capability of this system for measuring insulin secretion from single islets was shown by stimulating an islet with varying glucose levels. As the entire analysis is performed optically, this system should be readily transferable to other laboratories.
Introduction
Real-time monitoring of cellular secretion is central to the investigation of biological networks and communication.1–4 The elucidated secretion profiles yield insight into the function of a cell as a response to environmental stimuli, and perturbations of cellular secretions may be used to help diagnose and understand cellular malfunction.5,6 In turn, the development of analytical methods that allow the monitoring of cellular release with high temporal resolution is required.1 As an example, the study of insulin secretion from islets of Langerhans has benefited greatly from the development of methods that can rapidly measure release events. Insulin is the major regulatory hormone controlling glucose levels in the blood and its release is highly regulated from islets.7,8 The temporal patterns of insulin release vary depending on the glucose level in the system, and are essential for maintaining proper glucose levels in the blood. Defective insulin secretion is one of the hallmarks of type 2 diabetes and perturbations in the release profile of insulin are often seen even prior to the onset of overt type 2 diabetes.9,10 Therefore, there is a great interest in methods that can measure insulin secretion from single islets with a time resolution appropriate to capture secretion dynamics.The most popular methods to measure insulin are via antibody-based assays, for example enzyme linked immunosorbent assays or radioimmunoassays. While these assays are attractive due to their ability to achieve low limits of detection, their tolerance for high-salt levels, and high specificity of the antibody, both of these methods are time-consuming and laborious, making them difficult to automate. In the past 15 years, electrophoretic immunoassays for insulin have been developed using microfluidic systems, retaining the benefits of the antibody-based assays, but making them more amenable to automation.11–16 In the competitive form of these assays, insulin, and a fluorescently-tagged mimic (insulin*) compete for binding to a limited amount of high affinity antibody (Ab). Measurement of the bound antibody–insulin* complex (Ab–insulin*) and free insulin*, and their ratio (B/F), is inversely related to the amount of insulin in the sample.17 Determination of the B/F is often performed by separating the Ab–insulin* and insulin* using capillary or microfluidic electrophoresis, followed by laser-induced fluorescence detection. When these assays are performed on a microfluidic device, these separations are fast (∼10 s) and can be automated, enabling the observation of secretion dynamics.11–16
While these electrophoretic immunoassays are powerful methods to identify secretion dynamics from islets, due to the technological expertise required to run these separation based assays, they are difficult to translate to non-specialist laboratories. To facilitate the transfer and implementation of these systems to a wider field, relatively simple methods to measure the B/F of insulin* are desired. One method that has been used for decades for relatively simple quantitation of B/F of other species is through the use of fluorescence polarization, or fluorescence anisotropy.18–21
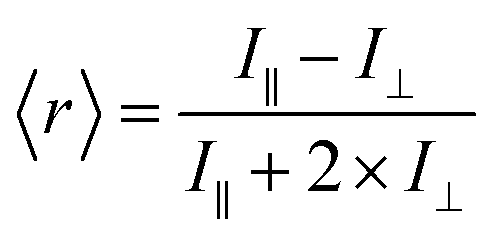
Fluorescence anisotropy is a measure of the amount of depolarization of fluorescence emission after being excited with linearly polarized light.21 As an example, insulin* will exhibit a smaller rotational correlation time as compared to a large Ab–insulin* complex, i.e. insulin* will rotate faster than Ab–insulin*. This smaller rotational correlation time will result in its emission being more depolarized, as compared to the emission of Ab–insulin*. In turn, the measurement of the average anisotropy of the solution, 〈r〉, provides a measure of the B/F according to:
| 〈r〉 = ∑(fbrb + ffrf) | (1) |
 | (2) |
Recently, there have been several reports of using fluorescence anisotropy based methods for quantitative measurements. In one report, a multi-channel design was used to screen >2300 pairwise protein–ligand interactions.24 In other studies, fluorescence anisotropy measurements were multiplexed to obtain multi-sample readings in the same25 or in parallel26 channels. However, none of these applications have yet been extended to online measurement of cell-secreted products.
In this manuscript, we present an online anisotropy immunoassay to monitor insulin secretion dynamics. The channel resistances of the microfluidic system were optimized for pulse-free gravity-driven flow of perfusion solutions and immunoassay reagents. Accurate and reproducible temperature control of the microfluidic system was found to be critical for reproducible anisotropy values, as well as fluid control. The all-optical based determination of B/F is simpler to use than electrophoretic-based systems and should be amenable to transfer of the technology to non-specialist laboratories.
Experimental section
Chemicals and reagents
NaOH, Tween-20, KCl, and HF where purchased from EMD Chemicals (San Diego, CA). H2SO4, HNO3, and H2O2 were purchased from Avantor Performance Materials (Center Valley, PA). RPMI 1640, antibiotic/antimycotic (Ab/Am), gentamicin, dextrose and sodium tetraborate (Na2B4O7·10H2O) were purchased from Fisher Scientific (Pittsburg, PA). Monoclonal Ab to insulin was purchased from Meridian Life Science, Inc. (Saco, ME). All other reagents were purchased from Sigma-Aldrich (Saint Louis, MO). The protocol for production of insulin* (Cy5-labeled insulin) was described previously.15 Immunoassay reagents were made in a buffer composed of 20 mM borate buffer in ultrapure deionized water (Barnstead International, Dubuque, IA) made to pH 9.4 using NaOH, followed by an additional 0.1% Tween-20 (w/v) and 1 mg mL−1 BSA added. A balanced salt solution (BSS) was used for dissolving insulin standards and used to perfuse islets. The BSS was composed of 125 mM NaCl, 2.4 mM CaCl2, 1.2 mM MgCl2, 5.9 mM KCl, 25 mM HEPES, and either 3 or 20 mM glucose, made to pH 7.4 with NaOH, followed by an additional 1 mg mL−1 BSA added.Device and system fabrication
Devices were created using photolithography and wet etching as previously described.14,15 All channels were 40 μm × 160 μm (depth × width at middle) as measured by a SJ-410 surface profiler (Mitotoyo Corporation, Aurora, IL). Fluid access holes were drilled using 0.02′′ diamond-tipped drill bits (Wolfco Inc., Bozrah, CT), while the islet chamber was drilled with a 0.012′′ diamond bit (Wolfco Inc.).A gravity-driven perfusion system was used for delivery of glucose to islets located within the islet chamber. This system has been described in detail elsewhere.14,27,28 Briefly, two syringes filled with either 20 or 3 mM glucose in BSS were suspended using a pulley system attached to a support board. The height of one of the syringes was controlled with a stepper motor (Phidgets, Calgary, Alberta, Canada) using a LabView program (National Instruments, Austin, TX). The height above the device dictated the flow rate of the solutions into the perfusion channels. Since their heights were inversely correlated with one another, the total flow rate of the two solutions entering the device remained constant, while the final glucose concentration was determined by the flow rate ratio. For delivery of the immunoassay reagents, two syringes containing either 75 nM Ab or 75 nM insulin* in BSS were suspended from a static support. The output of all syringes were connected to the device using commercially available tubing and ports (Idex Health & Science, Oak Harbor, WA).
Temperature control
The temperature of the microfluidic system was regulated using a custom built thermal plate to hold the device. The thermal plate was fabricated out of copper and four thermoelectric coolers (TEC1-12706, Hebeit I.T., Shanghai, China) were attached to the four corners of the plate. The temperature gradient on top of each thermoelectric cooler was dissipated by 40 × 40 × 10 mm (L × W × D) aluminum fins. The microfluidic device was placed in the center of the copper plate with a slit cut into the plate to allow for optical detection of the islet chamber, perfusion mixing channel, and immunoassay mixing channel. Temperature control of the thermoelectric coolers was facilitated by a FTC100D temperature controller (Accuthermo Technology, Fremont, CA) and an Accuthermo FTX100D H-Bridge amplifier, which modulated the power output of an 18 V, 3 A power supply (Extech Instruments, Nashua, NY). To maintain the set point temperature, an SAI-J thermocouple (Omega Engineering, Inc., St, Stamford, CT) was placed on top of the microfluidic device with its output measured by the FTC100D temperature controller. The temperature inside the islet chamber was measured to be 36.5 °C by a T-240C micro-thermocouple (Physitemp Instrument, Inc., Clifton, NJ) connected to a TAC80B-T thermocouple to analog converter (Omega Engineering, Inc., Stamford, CT).Detection system
The thermal plate holding the microfluidic device was placed on the stage of an Eclipse TS-100F microscope (Nikon Instruments, Inc., Melville, NY). The original stage was replaced by an acrylic replica, which reduced thermal loss from the thermal plate. For anisotropy experiments, a 635 nm laser (Coherent Inc., Santa Clara, CA) was used for excitation and its output power was reduced from 25 mW to 2.5 mW using a neutral density filter (ThorLabs, Inc., Newton, NJ). The light then passed through a linear polarizer (LPVIS100-A, ThorLabs) before entering the back of the microscope where it was made incident on a XF2054 triple band dichroic mirror (Omega Optical, Inc., Brattleboro VT) and reflected it to a 40×, 0.60 NA objective (Nikon). Insulin* fluorescence was collected via the same objective and passed through the dichroic and a quad-bandpass filter (446-523-600-677 Brightline, Semrock, Inc., Rochester, NY) where it was transmitted through the microscope to a 2-channel photometer (Photon Technology International, Inc., Birmingham, NJ). Inside the photometer, the light passed through a spatial filter, a 635 nm notch filter (ZET635NF, Chroma Technology Corp., Bellow Falls, VT) and was split by a polarizing beam splitter (PBS101, ThorLabs) into vertical and horizontal components. Each polarization was filtered again by linear polarizers and sent to separate photomultiplier tubes (PMTs) (Hamamatsu Photonics, Middlesex, NJ). For flow rate measurements, a 488 nm laser (Melles Griot, Carlsbad, CA) was used for excitation of fluorescein. The light from this laser was made incident on the dichroic mirror mentioned above and emission collected in a similar fashion but without the use of the 635 nm notch filter. The emission from fluorescein was collected from the PMT that corresponded to the vertical polarization. Data from both PMTs were acquired at 5 Hz via a NI-PCIe 6321 data acquisition card (National Instruments) controlled by a LabView program written in-house.Experimental protocol
At the beginning of each day, all perfusion tubings and microfluidic channels were purged of air bubbles using 100% ethanol. The ethanol was then replaced with diH2O and flow resumed. Afterwards, the device was conditioned with appropriate buffers; the perfusion syringes were filled with BSS (one contained 500 nM fluorescein) and the immunoassay syringes were filled with 20 mM borate buffer. The temperature control system was then initiated and the entire system was allowed to equilibrate for ∼2 h. Once the system was equilibrated, experiments commenced.Flow rates in the device were measured in a similar fashion as described elsewhere.14 Briefly, a step concentration in fluorescein was delivered to the device and the time it took for the PMT signal to increase to 10% above baseline was used to calculate the linear flow rate. The cross-sectional channel area measured during fabrication was used to convert this flow rate to a volumetric flow rate.
Isolation of islets of Langerhans
Islets of Langerhans were isolated from male CD-1 mice (25–40 g) as described previously.29 The protocol for isolation of islets was in compliance with institutional guidelines and approved by the Florida State University's Animal Care and Use Committee (protocol 1519). Following isolation, islets were incubated in RPMI-1640 media containing 11 mM glucose, L-glutamine, 10% Cosmic Calf Serum, 1% Ab/Am, and 0.1% gentamicin at 37 °C and 5% CO2. Prior to an experiment, an islet was removed from this media and placed in the microfluidic device where it was rinsed with BSS containing 3 mM glucose for at least 5 min before experiments commenced.Data analysis
Anisotropy data was calculated using a LabView program written in-house. The data from each PMT was converted to anisotropy using eqn (2). The data was then smoothed using a 10-point moving boxcar average. An online calibration curve was performed as described in the text with each concentration of insulin perfused for 10 min. The anisotropy data from 6–9 min of each concentration step was averaged and plotted as a function of insulin concentration. Error bars correspond to ±1 standard deviation. The immunoassay detection limit was calculated by fitting a 4-parameter logistic fit to the calibration curve and calculating the concentration of insulin required to decrease the anisotropy to a value lower than 3 times the standard deviation at the 0 point. The anisotropy measured from a single islet was converted to insulin concentration from the equation of the calibration curve and then normalized by the perfusion flow rate through the islet chamber.Results and discussion
Measurement of insulin secretion dynamics is essential for understanding the mechanisms of glucose sensing within islets and how it may be altered in disease states. While most assays for monitoring insulin release from single islets involve complicated separation systems, due to the simplicity of detection, fluorescence anisotropy is an ideal method for use in these assays. Anisotropy is defined through the Perrin equation as: | (3) |
 | (4) |
Optical design
The optics used to measure fluorescence anisotropy are shown in Fig. 1. While the emission from the 635 nm laser was polarized mostly in the vertical direction from the laser head, an additional polarizer was used to ensure proper alignment. The vertically polarized light was used to excite fluorescence in the solution flowing within the microfluidic device. The vertical (parallel) and horizontal (perpendicular) components of the depolarized emission light were then measured using separate PMTs. A G-factor, which is used to correct differences in sensitivities of the detection system to different light polarizations, was not measured since only relative changes in the anisotropy (Δr) as a function of the insulin concentration were measured.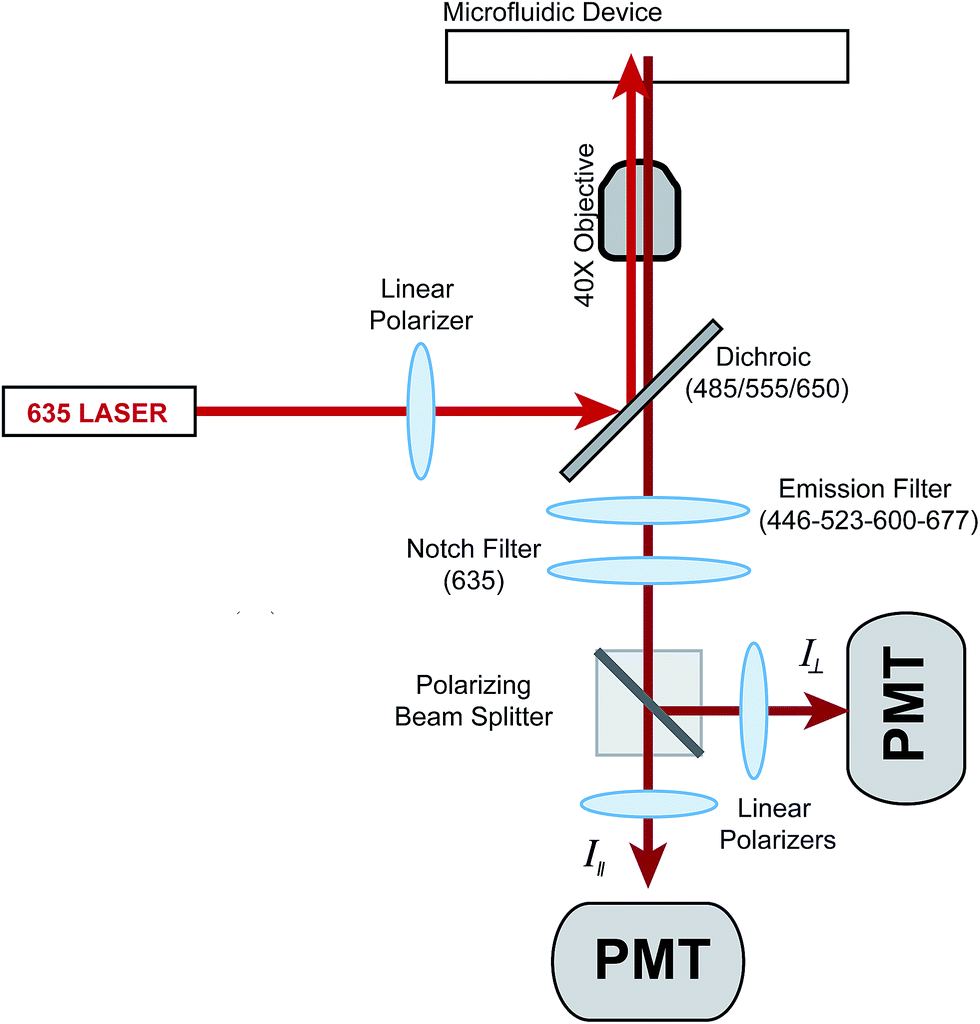 | ||
| Fig. 1 Optical setup for measurement of fluorescence anisotropy. The power output from a 635 nm laser was reduced to 2.5 mW using a neutral density filter (not shown) and sent through a linear polarizer. The light was made incident on a dichroic mirror where it was focused into the microfluidic channel using a 40×, 0.6 NA microscope objective. The emission light was collected by the same objective, passed through the dichroic mirror, a spatial filter (not shown), an emission filter, and a 635 nm notch filter for removal of stray incident light. A polarizing beam splitter cube directed the parallel (I∥) and perpendicular (I⊥) intensities of the fluorescence emission to additional linear polarizers before detection via separate PMTs. | ||
Chip design and operation
Syringe pumps were initially used to deliver all reagents to the device. However, at constant Ab, insulin*, and insulin concentrations, large variations in anisotropy were observed due to fluctuations in the flow rate from these pumps. The variations in anisotropy were attributed to flow-rate dependent scatter of the laser light. In other reports, gravity-driven flow has been used to deliver solutions in a pulse-free manner. We therefore turned to gravity-driven flow for delivery of all solutions into the device. Since multiple inputs were used, channel lengths were determined using nodal analysis to produce the appropriate flow rates and directionality of flow.28 The channel lengths of each segment in the device are shown in Fig. 2A.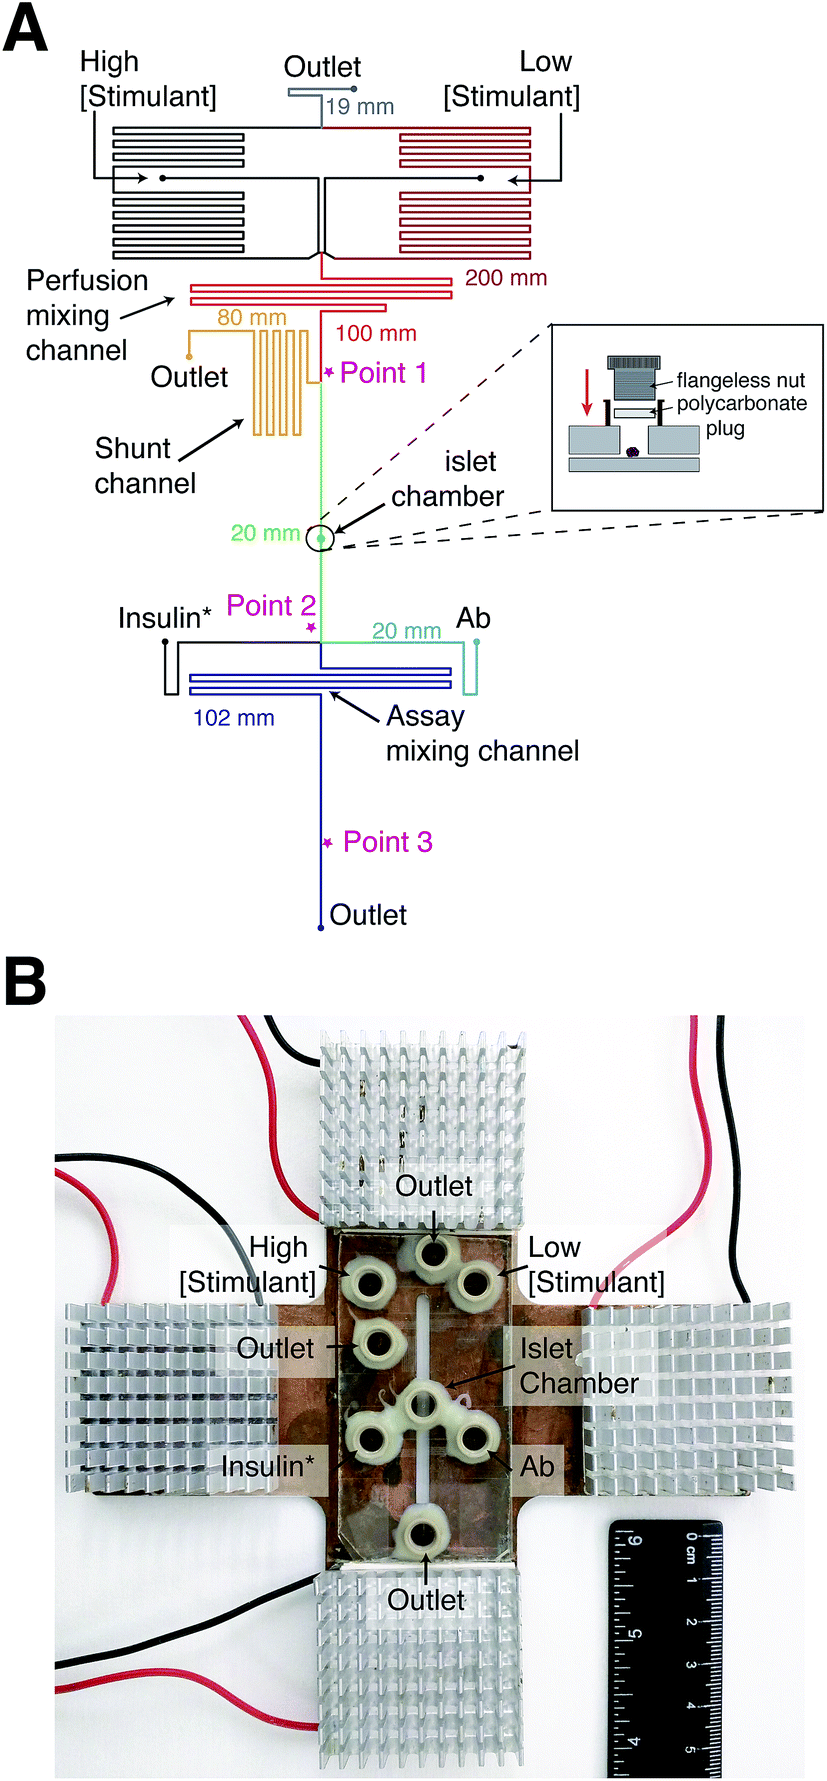 | ||
| Fig. 2 Microfluidic device design for measurement of online insulin secretion. (A) A top view of the microfluidic design is shown; liquid flowed from the top to bottom in the device. The perfusion channels consisted of two inputs for high and low concentrations of glucose or insulin and a perfusion mixing channel. The majority of the mixed perfusion solution was sent to waste via the shunt channel with a fraction sent to the islet chamber. As seen in the inset figure, a flangeless nut and polycarbonate plug were used to seal the islet chamber. The perfusate from the islet chamber was mixed with Ab and insulin* as it passed through the “Assay Mixing Channel” and anisotropy was measured prior to the outlet. Points 1, 2, and 3 are highlighted by * indicating where various measurements were made, as described in the text. The lengths of the various channel segments are indicated in the figure with the colors corresponding to the segments. (B) A photograph of the microfluidic device placed on the temperature control plate is shown. The plate consisted of a copper block with a slit through the middle enabling optical detection through the device. The four thermoelectric coolers, their control wires, and the aluminum fins are visible. The various reservoirs on the microfluidic system are labeled. | ||
In past reports using electrophoretic separations, perfusion solutions were delivered to the islet chamber while electroosmotic flow sampled the perfusate into the immunoassay region.11–16 In this system, the chamber was closed to allow the perfusion solution to sweep the entire islet chamber volume into the immunoassay region (Fig. 2A). A similar approach was used with electrophoretic separations to ensure a more homogeneous sampling of secreted insulin.30 With a closed system, the flow rate through the islet chamber needed to be optimized to capture secretion dynamics, while not inducing excess dilution. Another factor that influenced the perfusion flow rate was the ability to obtain accurate concentrations of the glucose or insulin perfusion solutions. At high flow rates, the syringe heights above the microfluidic device are large, which produces a large difference in syringe heights between the 0 and 100% perfusion solutions. At low flow rates, the heights of the syringes above the microfluidic device are small, requiring only a small difference between the two syringe heights to induce a change between the 0 and 100% perfusion solutions. The larger difference in syringe heights at higher flow rates makes it easier to accurately and reproducibly position the syringes for production of a particular perfusion concentration. Finally, higher flow rates are desirable to reduce the time the perfusion solution spends in the device, which minimizes longitudinal broadening and distortion of time-dependent signals.31,32
To satisfy the need for different flow rates in the device, a shunt channel was incorporated into the device prior to the islet chamber (“Point 1” in Fig. 2A). The purpose of the channel was to allow high flow rates in the perfusion system and lower flow rates through the islet chamber. The islet chamber consisted of a ∼400 μm diameter hole in the top piece of glass with a port epoxied on top. A flangeless nut fitted with a polycarbonate plug was screwed into the port (Fig. 2A, inset), which pressed the polycarbonate firmly to the glass sealing the islet chamber. This design resulted in an islet chamber with a volume of ∼120 nL. After the islet chamber, the solution traveled to the immunoassay region where it joined with insulin* and Ab (point 2 in Fig. 2A). The heights of the immunoassay reagents were adjusted so that the flow rates from the three solutions were approximately 3![[thin space (1/6-em)]](https://www.rsc.org/images/entities/char_2009.gif) :1:3 of insulin*:insulin:Ab. The solution traveled through another mixing channel where mixed and equilibrated prior to detection at point 3 (Fig. 2A).
:1:3 of insulin*:insulin:Ab. The solution traveled through another mixing channel where mixed and equilibrated prior to detection at point 3 (Fig. 2A).
Initially, the three outlets of the device were left open, but accumulation of fluid over time produced a large enough backpressure to affect the flow rates from the various syringes. To counteract this, all outputs were fitted with tubings that delivered the waste to a beaker. The beaker was filled with water to negate the effect of flow rate perturbations produced by droplet release from the tubings.
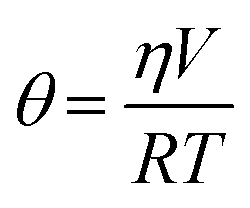
Temperature also played a critical role in anisotropy measurements, as shown in eqn (4), and also through temperature-dependent effects on flow rates. Therefore, maintaining a constant temperature was essential for reproducible anisotropy measurements. Because islets must be held at 37 °C to maintain viability, the entire microfluidic system was heated to this temperature to avoid temperature gradients. Initially, a single thermofoil was placed on the islet culture and assay region of the device; however, this temperature control was insufficient and temperature fluctuations resulted in drift and instability in the measured anisotropy. By placing the device on a custom-made plate (Fig. 2B) that contained four thermoelectric coolers, the entire device was thermostated to within ±0.1 °C of the set point. The high thermal mass of the plate acted as a heat sink and was insensitive to external thermal fluctuations once equilibrated for ∼20 min.
This heating of the entire device is in contrast to microfluidic separation systems where elevated temperatures in the separation channel are detrimental to preservation of the non-covalent Ab–insulin* complex.33,34 However, since anisotropy measurements are performed under equilibrium conditions, elevated temperatures typically increase the amount of the non-covalent complex, which is beneficial for assay sensitivity and a high dynamic range.35 Overall, this temperature system simplifies the assay conditions compared to the electrophoretic systems.
System characterization and evaluation
To determine the flow rates through the device, a series of square waves of fluorescein was produced by the perfusion system and the fluorescence at 3 points measured: before the shunt channel (point 1), before the introduction of the immunoassay reagents (point 2), and at the detection point for the immunoassay (point 3). The locations of these points are shown in Fig. 2A and the data from the fluorescein square waves are shown in Fig. 3. The average arrival times for each of the three points were 1.06 ± 0.01, 3.88 ± 0.03, and 5.66 ± 0.16 min, respectively. These corresponded to flow rates of 620 ± 5, 50 ± 2, and 360 ± 30 nL min−1, respectively. From these values, the effect of the shunt channel can be readily observed as it decreased the flow rate into the islet chamber by ∼13-fold. The response times, defined as the time for the fluorescence signal to change from 10 to 90% of the final signal, were used to characterize the temporal resolution of the system. At each of these points, the response times were 8.4 ± 0.2 s, 132 ± 6 s, and 115 ± 18 s, respectively. The short response time at point 1 was due to the high flow rate of the perfusion system and the short distance the wave traveled in the device. The response time increased significantly from point 1 to point 2 due to the time required to flush the islet chamber with the low flow rate after the shunt channel. As the immunoassay reagents were introduced, the flow rate increased and resulted in a small change in the response time from point 2 to point 3. The response times between point 2 and 3 were not statistically different and was the limit of the temporal resolution of the system. This value is similar to what we and others have obtained for electrophoretic monitoring of insulin release.12–16,30 As will be shown below, this time was appropriate to observe secretion dynamics from single islets.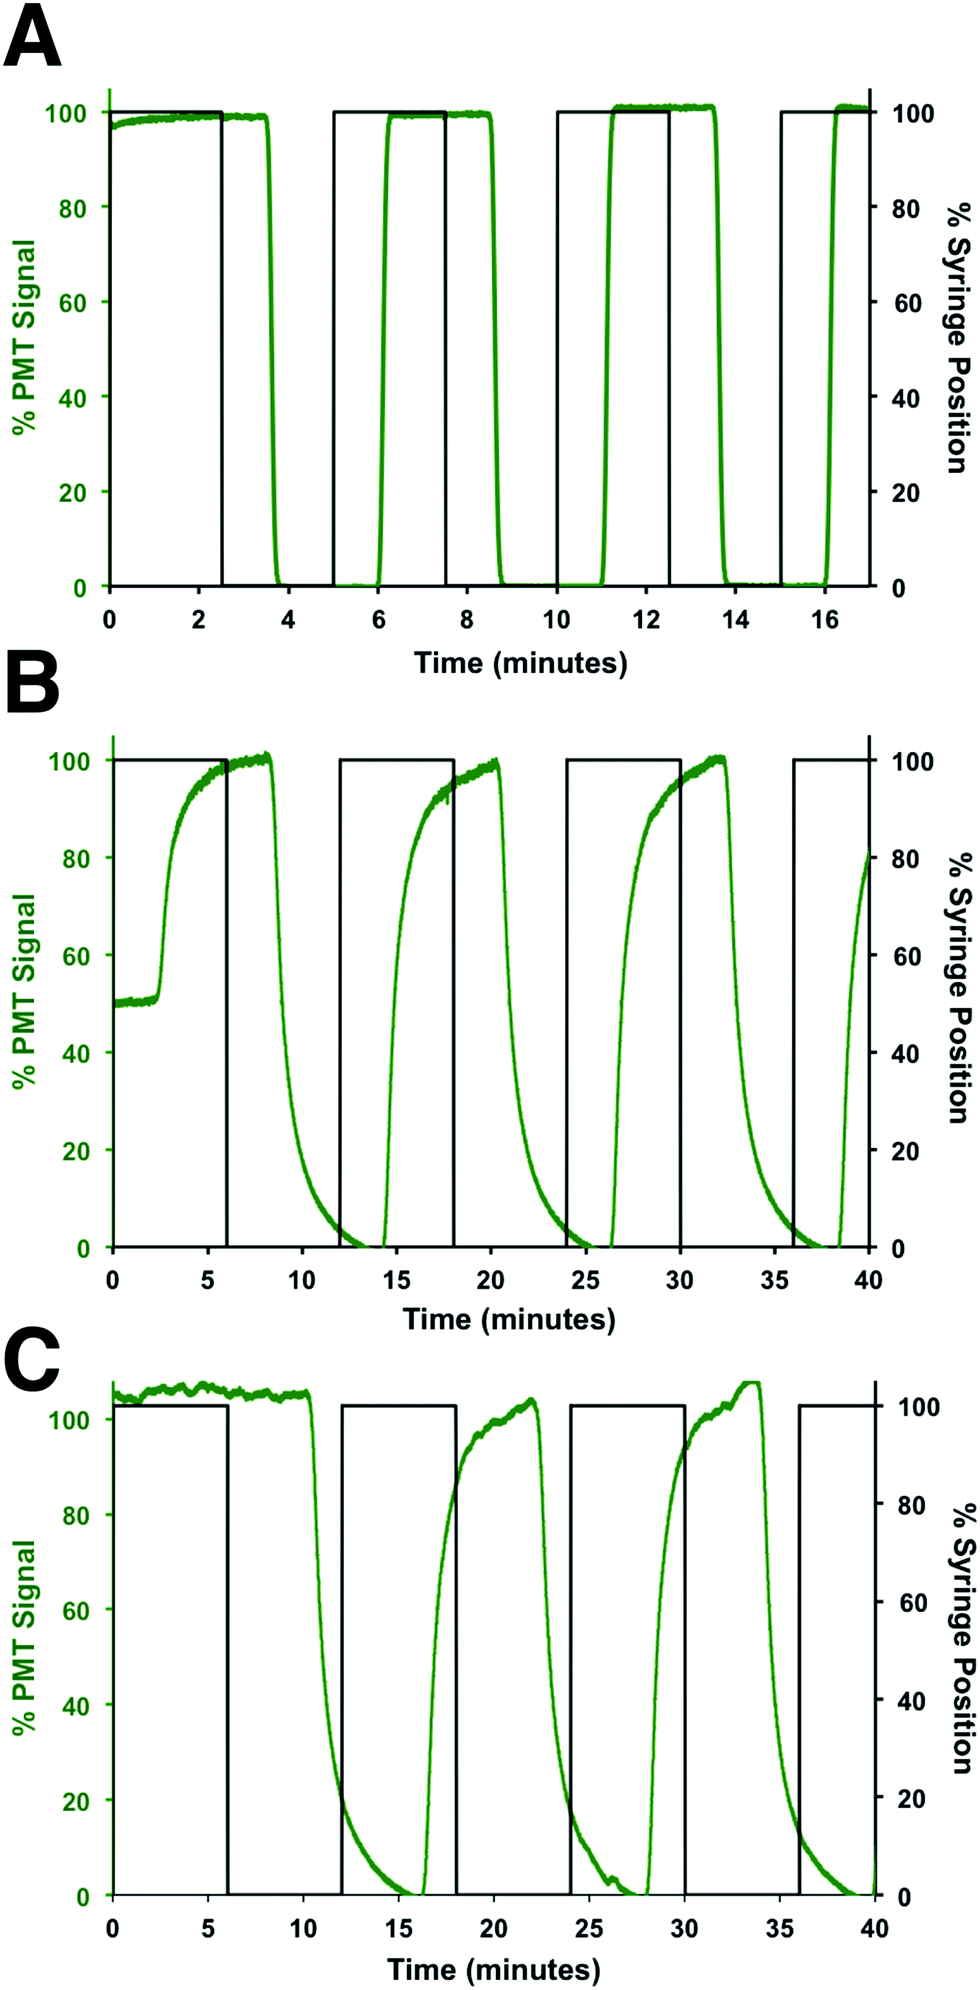 | ||
| Fig. 3 Flow rate measurements. The flow rates and response times through different sections of the device were determined by measuring the profile of fluorescein pulses made by the perfusion system. The observed fluorescein signal was normalized to its maximum signal at each location and plotted in green, while the position of the perfusion syringe is plotted in black. The profile of the fluorescein pulses was measured at (A) point 1, (B) point 2, and (C) point 3, which are defined in the text and shown in Fig. 2A. | ||
Insulin assays
To perform an immunoassay calibration curve, the fluorescein solution was replaced with 750 nM insulin and the immunoassay syringes were filled with insulin* and antibody solutions. After the flows were equilibrated, the automated perfusion system was used to deliver insulin concentrations of 0, 2, 16, 53, 128, and 250 nM to be mixed with the immunoassay reagents. Each concentration was run for 10 min and the anisotropy was measured at point 3. As shown by the calibration curve in Fig. 4, the plot showed the expected decrease in Δr with increasing insulin concentration. The reproducibility of the assay was good, with each concentration tested having less than 1% RSD in the anisotropy values. The resulting limit of detection (LOD) was 4 nM, similar to what has been achieved with other competitive immunoassay for insulin.11–16,30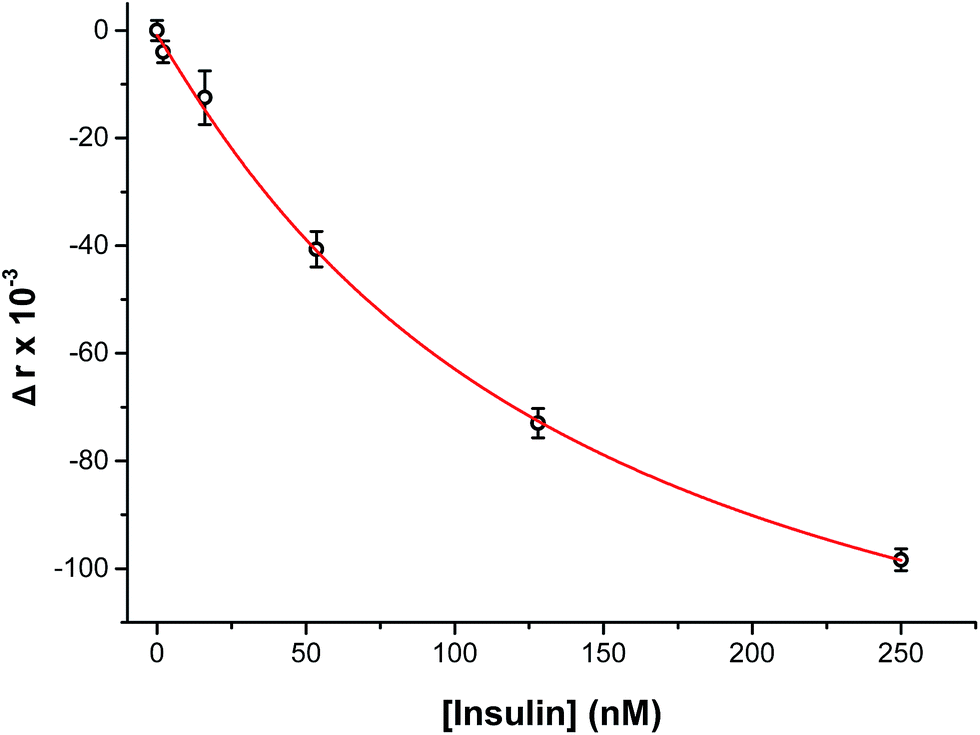 | ||
| Fig. 4 Calibration curve of insulin immunoassay. The measured change in anisotropy (Δr × 10−3) was measured as a function of insulin concentration perfused through the islet chamber. A concentration range of 0 to 250 nM insulin was used to evaluate the assay. At low insulin concentrations, a high anisotropy value was measured and with increasing insulin levels the anisotropy decreased. The data points shown are relative to the average anisotropy at 0 nM insulin. The data were then fitted with a 4-parameter logistic fit (red line). The RSD for the points were <2% and the limit of detection was 4 nM. Error bars correspond to ±1 standard deviation. | ||
To test if this method could monitor hormone secretion, a single islet was placed in the chamber and the flangeless nut re-applied. The device and all solutions were pre-warmed to 37 °C to limit the stress to the islet. No changes in islet morphology were noted before and after experiments. The measured anisotropy values before, during, and after glucose stimulation are shown in Fig. 5A. The anisotropy values were converted to insulin concentration using the calibration curve shown in Fig. 4 and further normalized by the flow rate through the islet chamber producing the insulin secretion rates shown in Fig. 5B. At the beginning of the experiment, 3 mM glucose was delivered to the islet chamber for 15 min to wash the islet and record a basal insulin secretion level. Because of a slight drift in the anisotropy measurements between the calibration and the measurements, some of the anisotropy values at low insulin concentrations fell below the limit of detection. After delivery of the basal glucose level, 20 mM glucose was applied for 35 min and the insulin levels rapidly increased, as expected. The secretion rate was relatively constant over the duration of the elevated glucose exposure. While oscillatory insulin release has been observed elsewhere13,14,30 the glucose concentration used here was not conducive to this secretion pattern. This is due to the high glucose flux saturating the dynamics of the intracellular glycolytic reactions.36,37 As evidence of the islet viability, when the glucose levels were reduced back to 3 mM, the release rate returned to near basal levels. This experiment was repeated with islets from different mice (n = 4) and all showed similar patterns (see Fig. S-2† for additional islet traces), consistent with literature reports using similar glucose levels.36–40
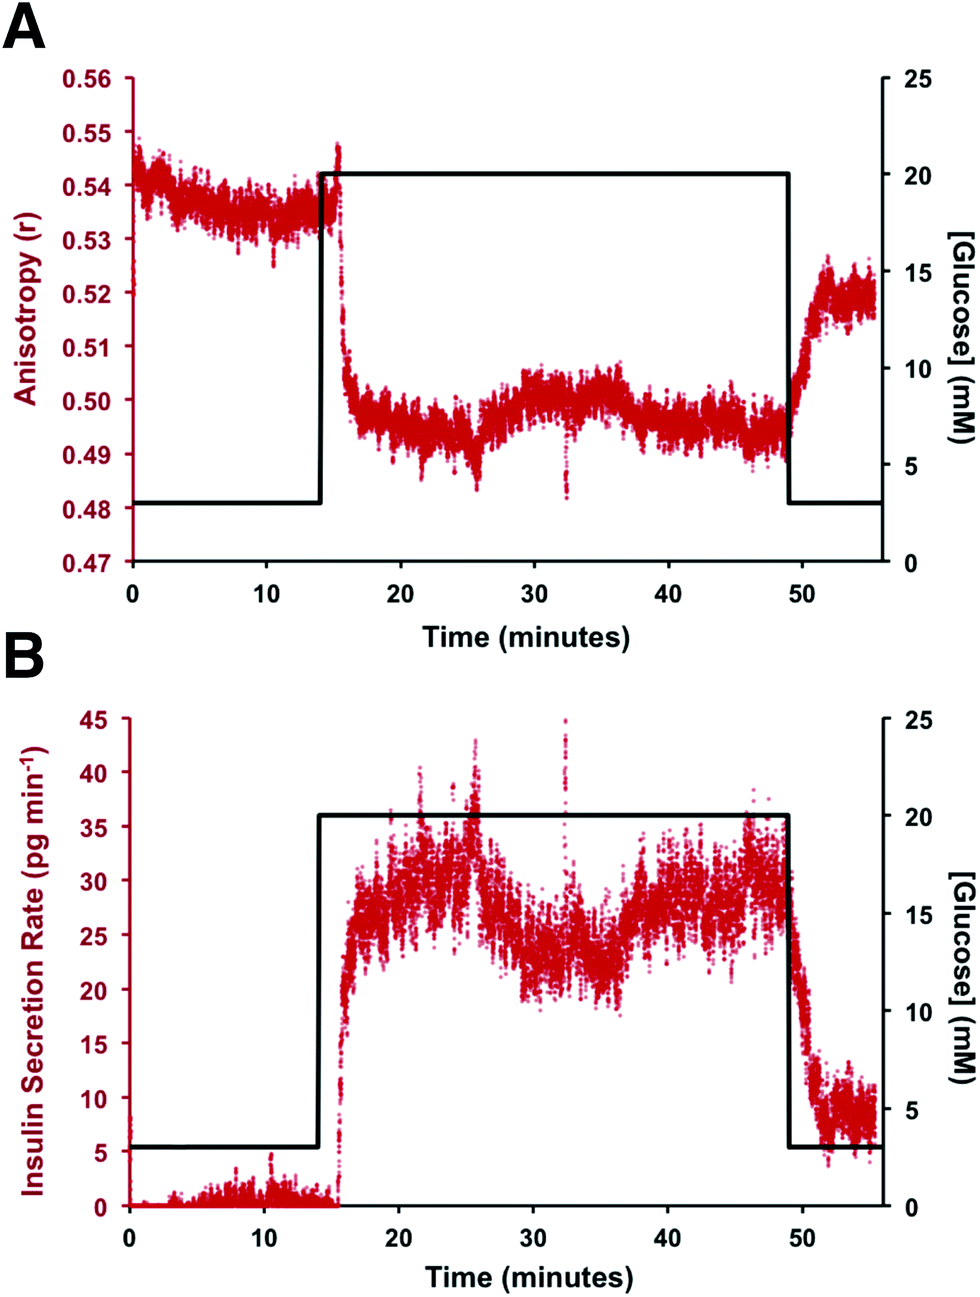 | ||
| Fig. 5 Representative example of online insulin secretion measurement from a single islet. (A) The measured anisotropy from a single pancreatic islet in response to a glucose step wave from 3 to 20 mM is shown. The measured anisotropy is plotted in red with the glucose concentration in black. The timing of the glucose trace is corrected to account for the time required to arrive at the islet chamber from the actuated perfusion system. (B) The secretion rate was obtained by normalizing the concentration to the flow rate through the islet chamber. The observed insulin secretion rate is plotted in red with the delivered glucose concentration plotted in black. A rapid increase in insulin secretion was observed following exposure to the elevated glucose level. Following removal of the glucose stimulus, the insulin secretion rate return to near basal. | ||
Conclusion
The capability to measure online insulin secretion from single islets of Langerhans with an online fluorescence anisotropy immunoassay is demonstrated. In contrast to other methods,11–16,30 this approach does not require separations or the associated difficulties with intra-chip temperature gradients. In addition, since the solutions were controlled using gravity-driven flow, fabrication of large channels could be performed, which simplifies manufacturing over that required for electrophoretic assays. Additionally, because the measurement is performed in a homogeneous manner, separate optimizations of the binding and separation conditions was not required.In the future, simultaneous assays can be achieved by adding appropriate immunoassay reagents labeled with a spectrally different fluorophore and using a multi-color anisotropy measurement technique.25 While hindered by optically opaque and birefringent materials, anisotropy assays can potentially be interfaced with easily fabricated materials.41 Due to the low flow rate required to flush the islet chamber, the temporal resolution of the assays was similar to electrophoretic assays developed in the past. For future improvement, the assay could benefit from the integration of oil based segmented flow schemes to improve the temporal resolution.42,43 In addition, a larger ratio of flow from the islet chamber to the immunoassay reagents would increase the sensitivity of the assay. Nonetheless, the assay demonstrated here presents a reliable route for implementation of dynamic cellular peptide release in non-specialist laboratories.
Acknowledgements
This work was supported by a grant from the National Institutes of Health (R01 DK080714). N. M. was supported by an American Heart Association pre-doctoral fellowship. A. M. S. and N. M. contributed to this work equally.References
- A. M. Schrell, N. Mukhitov, L. Yi, X. Wang and M. G. Roper, Annu. Rev. Anal. Chem., 2016, 9, 249–269 CrossRef PubMed.
- M. G. Roper, Anal. Chem., 2016, 88, 381–394 CrossRef PubMed.
- J. Massagué, Annu. Rev. Biochem., 1998, 67, 753–791 CrossRef PubMed.
- A. L. Barabási and Z. N. Oltvai, Nat. Rev. Genet., 2004, 5, 101–113 CrossRef PubMed.
- M. H. Stipanuk, Annu. Rev. Nutr., 2004, 24, 539–577 CrossRef CAS PubMed.
- N. Pørksen, M. Hollingdal, C. Juhl, P. Butler, J. D. Veldhuis and O. Schmitz, Diabetes, 2002, 51, S245–S254 CrossRef.
- P. Rorsman and M. Braun, Annu. Rev. Physiol., 2013, 75, 155–179 CrossRef CAS PubMed.
- A. R. Saltiel and C. R. Kahn, Nature, 2001, 414, 799–806 CrossRef CAS PubMed.
- D. A. Lang, D. R. Matthews, M. Burnett and R. C. Turner, Diabetes, 1981, 30, 435–439 CrossRef CAS PubMed.
- Z. Fu, E. R. Gilbert and D. Liu, Curr. Diabetes Rev., 2013, 9, 25–53 CrossRef PubMed.
- M. G. Roper, J. G. Shackman, G. M. Dahlgren and R. T. Kennedy, Anal. Chem., 2003, 75, 4711–4717 CrossRef CAS PubMed.
- J. G. Shackman, G. M. Dahlgren, J. L. Peters and R. T. Kennedy, Lab Chip, 2005, 5, 56–63 RSC.
- J. F. Dishinger and R. T. Kennedy, Anal. Chem., 2007, 79, 947–954 CrossRef CAS PubMed.
- L. Yi, X. Wang, R. Dhumpa, A. M. Schrell, N. Mukhitov and M. G. Roper, Lab Chip, 2015, 15, 823–832 RSC.
- A. R. Lomasney, L. Yi and M. G. Roper, Anal. Chem., 2013, 85, 7919–7925 CrossRef CAS PubMed.
- K. R. Reid and R. T. Kennedy, Anal. Chem., 2009, 81, 6837–6842 CrossRef CAS PubMed.
- N. M. Schultz and R. T. Kennedy, Anal. Chem., 1993, 65, 3161–3165 CrossRef CAS.
- W. B. Dandliker and V. A. de Saussure, Immunochemistry, 1970, 7, 799–828 CrossRef CAS PubMed.
- M. E. Jolley, J. Anal. Toxicol., 1981, 5, 236–240 CrossRef CAS PubMed.
- E. Terpetschnig, H. Szmacinski and J. R. Lakowicz, Anal. Biochem., 1995, 227, 140–147 CrossRef CAS PubMed.
- J. R. Lakowicz, in Principles of Fluorescence Spectroscopy, Springer, New York, 3rd edn, 2006, vol. 10, pp. 353–382 Search PubMed.
- C. Owicki, J. Biomol. Screening, 2000, 5, 297–306 CrossRef PubMed.
- D. S. Smith and S. A. Eremin, Anal. Bioanal. Chem., 2008, 391, 1499–1507 CrossRef CAS PubMed.
- L. F. Cheow, R. Viswanathan, C. S. Chin, N. Jennifer, R. C. Jones, E. Guccione, S. R. Quake and W. F. Burkholder, Anal. Chem., 2014, 86, 9901–9908 CrossRef CAS PubMed.
- A. M. Schrell, N. Mukhitov and M. G. Roper, Anal. Chem., 2016, 88, 7910–7915 CrossRef CAS PubMed.
- O. Wakao, Y. Fujii, M. Maeki, A. Ishida, H. Tani, A. Hibara and M. Tokeshi, Anal. Chem., 2015, 87, 9647–9652 CrossRef CAS PubMed.
- R. Dhumpa, T. M. Truong, X. Wang and M. G. Roper, Integr. Biorefin., 2015, 7, 1061–1067 RSC.
- M. Ferry, I. Razinkov and J. Hasty, Methods Enzymol., 2011, 497, 295 CAS.
- X. Wang and M. G. Roper, Anal. Methods, 2014, 6, 3019–3024 RSC.
- J. F. Dishinger, K. R. Reid and R. T. Kennedy, Anal. Chem., 2009, 81, 3119–3127 CrossRef CAS PubMed.
- F. Azizi and C. H. Mastrangelo, Lab Chip, 2008, 8, 907–912 RSC.
- X. Zhang, A. Grimley, R. Bertram and M. G. Roper, Anal. Chem., 2010, 82, 6704–6711 CrossRef CAS PubMed.
- M. Berezovski and S. N. Krylov, Anal. Chem., 2004, 76, 7114–7117 CrossRef CAS PubMed.
- N. Mukhitov, L. Yi, A. M. Schrell and M. G. Roper, J. Chromatogr. A, 2014, 1367, 154–160 CrossRef CAS PubMed.
- A. R. Lomasney, C. Guillo, A. M. Sidebottom and M. G. Roper, Anal. Bioanal. Chem., 2009, 394, 313–319 CrossRef CAS PubMed.
- C. S. Nunemaker, R. Bertram, A. Sherman, K. Tsaneva-Atanasova, C. R. Daniel and L. S. Satin, Biophys. J., 2006, 91, 2082–2096 CrossRef CAS PubMed.
- R. Bertram, A. Sherman and L. S. Satin, Am. J. Physiol., 2007, 293, E890–E900 CAS.
- J. C. Henquin, N. Ishiyama, M. Nenquin, M. A. Ravier and J. C. Jonas, Diabetes, 2002, 51, S60–S67 CrossRef CAS PubMed.
- J. Pizarro-Delgado, M. Braun, I. Hernández-Fisac, R. Martín-Del-Río and J. Tamarit-Rodriguez, Biochem. J., 2010, 431, 381–389 CrossRef CAS PubMed.
- R. Roat, V. Rao, N. M. Doliba, F. M. Matschinsky, J. W. Tobias, E. Garcia, R. S. Ahima and Y. Imai, PLoS One, 2014, 9, e86815 Search PubMed.
- B. C. Gross, J. L. Erkal, S. Y. Lockwood, C. Chen and D. M. Spence, Anal. Chem., 2014, 86, 3240–3253 CrossRef CAS PubMed.
- M. Wang, G. T. Roman, K. Schultz, C. Jennings and R. T. Kennedy, Anal. Chem., 2008, 80, 5607–5615 CrossRef CAS PubMed.
- G. Aubry, M. Zhan and H. Lu, Lab Chip, 2015, 15, 1424–1431 RSC.
Footnote |
| † Electronic supplementary information (ESI) available. See DOI: 10.1039/c6ay02899c |
| This journal is © The Royal Society of Chemistry 2017 |