Quantitative characterisation of conductive fibers by capacitive coupling†
Andres
Ruland
 a,
Rouhollah
Jalili
b,
Attila J.
Mozer
 a and
Gordon G.
Wallace
 *a
*a
aARC Centre of Excellence for Electromaterials Science (ACES), Intelligent Polymer Research Institute, AIIM Facility, Innovation Campus, University of Wollongong, NSW 2500, Australia. E-mail: gwallace@uow.edu.au
bSchool of Engineering, College of Science, Engineering & Health, RMIT University, Melbourne, VIC 3001, Australia
First published on 17th October 2017
Abstract
This work presents a study on a capacitively coupled contactless conductivity detector (C4D) for micron-sized fibers. Following a previous report on the qualitative application of C4D for fibers, the present study provides a thorough analysis of the signal response to fiber conductivity. Using reduced graphene oxide (RGO) fibers, the detector response as a function of fiber length, cross-sectional area and resistance has been investigated. To study the effect of insulating coatings, Parylene-coated RGO fibers were also investigated. In addition, measurements were performed in different coupling environments, such as in a capillary tube or air. The analysis of the measured data allowed the determination of the C4D conductivity of various RGO fibers, and the correlation with contact methods through empirical relationships to be determined. It was found that the detection limit and sensitivity of resistance measurements are mainly dependent on the sensor design, and also on the fiber properties. The detection threshold can be defined as the ratio of the coupling impedance to fiber resistance. In our case, the detection limit was found for impedance ratios equal to 14. This limit sets a functioning mode in C4D for fibers, which may be used as an area or resistance detector for the impedance ratio above or below the detection threshold. A semi-log linear response of the fiber resistance to the voltage output was found for impedance ratios between 2.66 and 0.63. These impedance ratios may serve as a reference for designing C4D, depending on the fibers to be tested and the analytical information needed. In summary, we suggest that C4D has the capacity to emerge as a new characterisation tool for micron-sized fibers, due to its applicability to any conductive material, ease of use, and the contactless nature of the measurement.
Introduction
In recent years, a great deal of attention has been paid to the development of electrically conductive organic fibers as an alternative to metal wires. Among them, reduced graphene oxide (RGO), RGO-polymer composites and carbon fibers are some of the best candidates.1,2 These new types of fibers have the benefit of good conductivity properties combined with light weight, as well as mechanical strength, flexibility and cost-effective manufacturing. Such fibers can be further assembled into more complex structures such as yarns,3,4 or knitted into textiles.5 Applications include the development of smart textiles, wearable electronics, or artificial muscles among others.6–11 While there is intense research into such applications, there are few reports on methods for fiber or yarn characterisation. To date, the main tools used for evaluating the fiber resistance have been contact methods, such as two- or four-point point probe (2PP and 4PP, respectively) methods. In addition, to evaluate the fiber resistance per area, resistivity and cross-sectional areas must be known in advance. This is typically done by microscopy, which is time consuming and difficult to implement in simultaneous resistance measurements. For in situ cross-sectional area determination, laser based systems have been developed, but are limited to circular fibers. Concerning resistance measurements, the use of mechanical pressure from the electrode to the fiber, or the use of silver paste, makes the fiber unusable. Hence, it can be concluded that contact methods are time consuming and, overall, of destructive character.An effort towards continuous fiber resistance monitoring of conductive fibers was made by Bashir et al.12 In that work, the fiber resistance was monitored by 2PP and 4PP, where brass pulleys acted as both a sample holder and electrode. Although effective for monitoring conductive fibers, the method is impractical for enamelled or coaxial fibers, or the measurements require a contactless approach, for instance for the in situ monitoring of GO reduction using light induced reduction,13,14 chemicals,15 or after heat treatment.16,17
In regard to contactless conductivity measurements, a few other techniques based on microwave and radiofrequency methods are available, such as microwave cavity perturbation and eddy current. In the case of microwave conductivity, most reports have focused on thin film characterisation, and only a few reports on thin fibers exist.18,19 Despite being effective for measuring conductive films at high throughput, it requires a complex setup such as a special resonance cavity design capable of operating at GHz frequencies.20,21 On the other hand, the eddy current is a well-established technique in the field of non-destructive testing, and it is commercially available for measuring various forms of test samples. One of the limitations of the eddy current is the need for a test sample with sufficient volume in order to induce detectable changes. This limits its applicability to large objects, or 2D structures such as foils or textiles, and thick wires (>1 mm).
Recently, Cabot et al.22 demonstrated the possibility to qualitatively evaluate the conductive properties of micron-sized fibers in a contactless fashion, in particular by using a capacitively coupled contactless conductivity detector (C4D). C4D is commonly used in the field of separation science/electrofluidics,23–25 as an analyte detector in capillary electrophoresis. However, its application to conductive fibers is rather novel and not fully understood. The open questions are for instance how is the signal influenced by the fiber's cross-sectional area and the detection limit, and if it can be used to quantify the conductivity of micron-sized fibers. In the present work, we have performed a thorough study on the signal response to different fiber characteristics, with the aim of extracting quantitative information on the fiber's properties from the C4D signal output. In particular, by monitoring the C4D signal output as a function of fiber length, area and resistance. The quantitative evaluation of the fiber properties was based on parametric analysis and empirical models and their validation with experimental measurements. The limitations and possibilities of the method are also discussed throughout the text.
Working principle of C4D for conductive fibers
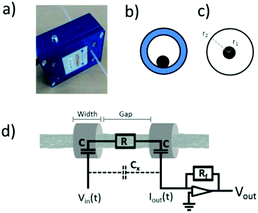
The working principle of C4D is a well-established concept, intensively used since 1998 for analyte detection in capillary electrophoresis.26,27 A detailed description of its fundamentals and the development of the technique can be found elsewhere.28 Briefly, two tubular electrodes, an emitter and receiver, are isolated from each other by a gap, typically defining the detection section. In our case, the electrode width and gap are 0.5 and 1 cm, respectively (Fig. 1d).The sample under examination (e.g. fluid or conductive fiber) is physically separated from the electrodes, typically by a thin dielectric medium or a capillary tube. After applying an AC-voltage, Vin, to the emitter electrode, the dielectric medium near the electrode is capacitively charged. The induced charge flows through the detection gap as a function of the sample resistance, R (e.g. conductive fiber), and reaches the receiver electrode area via an AC potential difference. The resulting AC-current travels through the dielectric medium to the receiver electrode. Finally, the current is amplified by a feedback resistor, Rf, and converted back to AC-voltage. The nominal signal output, Vout, is the peak value of the resulting AC-voltage. Crucial for this process is the need for a sufficiently high excitation frequency to overcome the capacitive impedance, Zc, between the electrode and sample. Likewise, a thin dielectric material is used to lower Zc. The amplitude of Vout can be tuned, in addition to Zc, by varying Vin and Rf. A short path for the above-mentioned mechanism is the stray capacitance, Cx, which is the result of direct coupling through air between both electrodes. In our study, Cx is neglected since the electrodes are shielded. The remaining voltage from the stray capacitance is set to zero before each measurement.
For quantitative analysis, Vout was converted to impedance variation, ΔZ, using eqn (1):
 | (1) |
Since impedance variation is only due to the current flow through a capacitance–resistor–capacitance circuit, ΔZ is equal to the sum of the fiber resistance and twice the coupling impedance, Zc (eqn (2)):
| ΔZ = R + 2Zc | (2) |
 | (3) |
 | (4) |
Finally, with the known values of ΔZ and Zc, the detection gap, l (cm), and sample area, A (cm2), the conductivity, K (S cm−1) can be calculated by eqn (5). The same equation applies for 4PP conductivity:
 | (5) |
Experimental
Fiber preparation
The fibers were prepared by a wet-spinning method following a previously reported procedure.17 Briefly, graphene oxide (GO) in the liquid crystal phase at a concentration of 10.5 mg ml−1 was injected into a rotating coagulation bath at 3 cm from the center. The composition of the coagulation bath was: 70% ethanol, 25% water, and 5% hypophosphorous acid (HA) as a reducing agent; the percentages are expressed in volume %. 2% CaCl2 by weight was also added. The reduction of the GO fibers was carried out by placing the GO fiber coagulation bath in an oven at 80 °C overnight. Some fibers were collected at particular times to monitor the fiber resistance. The coagulation solution was removed from the resulting RGO fibers and washed 3 times in deionised water until a neutral pH was reached. For the fiber F1, the same procedure was repeated but with a GO of 20 mg ml−1. To achieve different cross-sectional areas, fibers were spun using a needle gauge 19 (fibers 1–3) and gauge 21 (fibers 4–6). In addition, fibers were tensioned under different weights: 1 g (fibers 1, 2, 4), 2 g (fiber 5) and 2.8 g (fibers 3, 6). Stainless-steel fiber 316L was purchased from Goodfellow Cambridge Ltd. The chemicals used: HA 50 wt% and CaCl2 were purchased from Sigma-Aldrich. Ethanol was purchased from Chem-Supply. For Parylene coating, Parylene type C was deposited with a coater from Speciality Coating Systems PDS 2010.Fiber characterisation
RGO fibers were characterised with an in-house 4PP setup connected to a multimeter (Keithley 2000). Note that no silver paste was used. For a robust electrical contact, the fiber was gently pressed in between a soft block and the electrode tips (0.23 cm spacing). The measurements were repeated 3 times on independent fiber fragments. For cross-sectional area measurements, an optical microscope (Leica DM6000) was used. For this, fibers were first encapsulated into a polymer matrix via mild heat polymerisation (80 °C overnight) of a monomer, and then polished orthogonally to the fiber length (Leica EM TXP). Average cross-sectional areas were obtained from 5 independent fragments via image analysis of the corresponding optical images. The C4D setup (EDAQ ET125) consisted of a detector of 1 cm electrode gap (instead of 9 mm as specified by the manufacturer), 5 mm electrode width, 1.6 mm aperture, variable AC-frequency (20 kHz–2 MHz) and variable peak-to-peak input voltage (2–20 V). Two different feedback resistances, Rf, were used, i.e. 11 and 56 kohm. The input voltage was adjusted to avoid a signal output above 2.5 V. The displayed signals over 2.5 V were recorded at lower input voltages, and rescaled to 20 V for comparison. As a capillary tube, a PTFE tube of 1.6 and 0.8 mm OD/ID was used. The voltage values recorded for measurements inside the capillary tube corresponded to 3 reproducible maximum voltage values. For measurements using a capillary, the fiber position with respect to the electrodes was off-centre as in Fig. 1b. The fibers did not move during the measurement as the capillary was placed horizontally. In addition, there was a strong surface affinity between PTFE and fibers, facilitating a static position of the fiber inside the capillary. For air measurements, the fiber was guided through a homemade holder featuring a fiber guide aligned to each aperture. Before recording the signals, the guide was adjusted until the fiber was at the center of the electrode aperture, corresponding to the minimum voltage output. The measurement details in all cases, unless specified, were voltage: 20Vpp, frequency: 2 MHz, amplification: 11 kohm (for capillary) and 56 kohm (for air). The stray voltage was set to zero before each measurement.Results and discussion
Signal dependence on fiber length, resistance and area
Before using C4D as a quantitative conductivity detector, a study of the signal output as a function of fiber characteristics was first carried out. Due to its analogy to traditional C4D, most of the experiments shown were conducted using a capillary tube as the coupling medium and the sample holder. For comparative purposes, additional measurements were carried out using air as the coupling medium (Fig. 1b and c). Air measurements also represent the ideal setup for contactless characterisation, suitable for instance for industrial-scale fiber monitoring. In a previous study, it was concluded that the signal output can be scaled to the 4PP fiber resistance and influenced by its cross-sectional area,22 termed hereafter area. In this case, we shed more light on the underlying mechanism governing the capacitive conductivity for micron-sized fibers, by analysing the signal output in terms of the fiber's area, length and resistance. The fibers studied in this work and their relevant parameters are listed in Table 1. See the Experimental section for details. The representative cross-sectional images for each fiber are shown in Fig. S1.†| Sample name | Resistancea (ohm cm) | Areab (10−5 cm2) | Conductivity (S cm−1) | Voltagec (V) |
|---|---|---|---|---|
| SS: stainless-steel fiber. F1–F6: reduced graphene oxide fibers.a Average of 3 independent fragments.b Average of 5 independent fragments.c Voltage output corresponding to 3 reproducible maxima, recorded on 2 cm fiber length. | ||||
| SS | 23.9 ± 2 | 0.31 ± 0.01 | 1.34 × 10⁴ | — |
| F1 | 426 ± 5 | 3.90 ± 0.06 | 60.2 | 2.05 |
| F2 | 640 ± 28 | 2.53 ± 0.05 | 61.6 | 1.94 |
| F3 | 840 ± 18 | 1.83 ± 0.03 | 64.9 | 1.83 |
| F4 | 1052 ± 23 | 1.41 ± 0.09 | 67.4 | 1.76 |
| F5 | 1269 ± 27 | 1.06 ± 0.04 | 73.8 | 1.63 |
| F6 | 1771 ± 21 | 0.75± 0.02 | 75.0 | 1.52 |
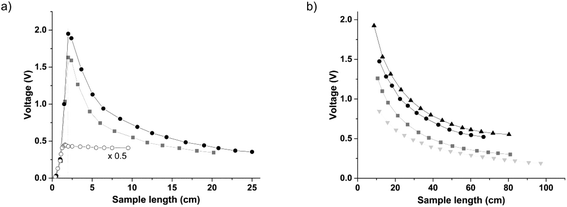
The voltage response to different fiber lengths was first examined. To also evaluate the effect of the fiber area, fibers F2 and F5 were compared. In addition, different volumes of distilled water were also measured for comparison as high resistance samples. Note that the sample length is equal to a different longitudinal length of the sample inside the capillary. Each data point corresponds to a sample of a different length. For fragments shorter than the sensor casing, the capillary was moved until the maximum signal was achieved. The displacement of the capillary served as an indication to locate the position of the fiber with respect to the electrodes, which was qualitatively at the center of the electrode gap. For capillary measurements, only straight fibers with full contact with the capillary tube were used, as the air gap in between them strongly influences the signal output.22 Likewise, due to the flexible nature of the capillary used, before recording each data point, the capillary was finely adjusted until a maximum voltage output was achieved. The resulting voltage output, Vout, as a function of sample length is shown in Fig. 2a, and corresponds to 3 reproducible maximum voltages. The solid lines are an eye guide for connecting experimental data points.
Comparing the trends for distilled water and fibers, the data presented in Fig. 2a clearly indicate different behaviour depending on the sample properties. Although the comparison is based on two samples that are very different in nature, the signal only concerns the impedance variations occurring in between the electrodes. Impedance variations are due to the changes in the coupling capacitance and resistance, as shown in eqn (2).
For fibers, the highlight is the sharp voltage maximum at 2 cm, and the gradual signal decay beyond that point. In contrast, distilled water shows a gradual increase until 1.6 cm, where it reaches a nearly constant value. The location of the maximum voltage in terms of length illustrates the effective detection gap. For fibers, the effective gap is located at 2 cm, corresponding to the electrode gap and twice the electrode width. Note that for distilled water, an effective gap of 1.6 cm is slightly larger than the expected. Considering that the electrode gap is 1 cm, an increase of 0.3 cm of the detection gap into each electrode occurs. Typically, the increased detection gap in low conductivity solutions is in the sub-millimetre range, for the excitation frequency used.23,25 The wider detection gap observed for water is attributed to the dimensions of the capillary tube used, which is thicker and has a larger external diameter than the traditional ones. The observed difference in the detection gap of fibers with respect to distilled water is in agreement as previously mentioned,29 where low resistance samples cause the electric field to concentrate only in the area below the electrodes. As a result, the detection gap for fibers includes the electrode gap and twice the electrode width. For higher resistance samples, electric field coupling is less intense and delocalised towards the electrode gap.
In relation to the voltage decay as a function of sample length, it appears to be related to the sample resistance, as it does not occur for distilled water. The hypothesis is that the capacitive charge accumulated on the fiber tends to dissipate along its whole length, while for distilled water, due to its high resistance, it remains nearly constant. The next observable difference in Fig. 2a is the voltage amplitude. Comparing fibers F2 and F5, the voltage signal must be related to differences in area, as F2 is larger than F5. However, the ratio between voltages is not proportional to that of the areas. When normalising the voltage profiles for F2 and F5, a slight difference in the amplitudes can be seen in between 5 and 10 cm of fiber length (Fig. S2a†). The fitting functions and their average are shown in Fig. S2b.† Despite the slight variation in the range from 5 to 10 cm, the averaged fitting function could be used to extrapolate the voltage at 2 cm for any fiber length measured in this range. The effect of the resistance does not seem to have a quantitative effect on the signal output for fibers F2 and F5. On the other hand, the distilled water sample shows a reduced signal output, for an area of about 500 times larger than the fibers. Here the low output signal is due to the large resistance and a corresponding low impedance change (eqn (1)). These observations indicate that there must be a resistance detection limit where only the changes in the area are detectable.
A similar study was done for air as the coupling medium between the fiber and the electrode. Due to practical limitations, minimum sample lengths were restricted to about 8 cm. This setup also allowed the evaluation of the signal output for longer fiber lengths. In this case, samples up to about 1 meter were used. To obtain further information on the voltage signal, a stainless-steel fiber (SS) was compared with fibers F1, F2 and F5. The resulting data are presented in Fig. 2b.
When analysing the voltage decay trends, all fibers adjust to a bi-exponential function (R2 = 0.99), with constant voltage values at long fiber lengths. The fitting equation was (eqn (6)):
 | (6) |
This bi-exponential dependence suggests that the signal decay is proportional to the sample area and resistance. Due to the signal decay, it was found that meaningful data could only be extracted from the offset values (yo) resulting from the fitting functions. These values should also simulate measurements performed on infinitely long fibers. These extracted onset values were 0.506, 0.420, 0.265, and 0.097 V for F1, F2, F5, and SS, respectively. See Table S1† for details on fitting coefficients. Similar to that mentioned above, the voltage values follow the same trend as the fiber area. No particular trend was observed for the other fitting coefficients.
To further study the relationship between the fiber area and voltage, additional measurements were carried out. F5 fibers were segmented in equal lengths of 2 cm, and the signal response was measured as a function of the number of fragments enclosed inside a capillary tube. Care was taken to ensure the superposition of fiber fragments during measurements. The resulting plot (Fig. S3†) shows an exponential increase of voltage as a function of the number of fibers, which tends towards a plateau.
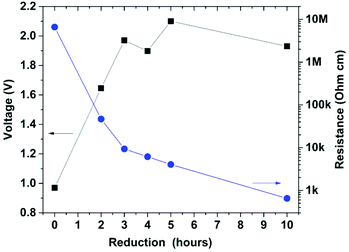
To assess the sensor's detection limit, fibers from batch F2 at different reduction times were measured in a capillary tube. The resulting measured voltage as a function of reduction time for fibers 2 cm in length is shown in Fig. 3. In addition, the 4PP resistance of each fiber is represented on a logarithmic scale due to the large variation in resistances. Voltage variation occurs from about 1 to 2 V, for a GO fiber and RGO, respectively. This voltage change should in principle represent a resistance variation from the Mohm range to a few kohm. For the initial reduction stages, there is a good correlation between the voltage and the fiber resistance. In contrast, further reduction periods do not seem to follow a proportional voltage increase, as the fiber resistance is further reduced. By performing a fitting function to the voltage as a function of time (data not shown), the signal reaches a plateau after 3–4 hours of reduction time. This implies that the resistance detection limit is about 7 kohm cm for this particular sensor. Therefore, the observed changes in the signal amplitude for fibers below such a threshold are due to variations in the fiber's cross-sectional area. This is consistent with the data from observation in Fig. 2. Note that the sample after 10 hours of reduction corresponds to a tensioned fiber, while the other fibers are non-tensioned. Non-tensioned fibers typically have a rougher surface and increased outer area with respect to tensioned ones, affecting the coupling, and in turn resulting in a higher voltage.
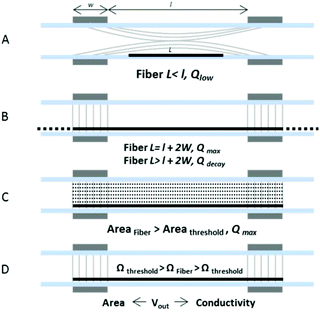
Based on the signal output as a function of fiber length, area and resistance, a more detailed picture of the working principle of C4D for fibers can be seen. A rationale for the electric field coupling to the fiber mechanism can be found in Gauss's laws, in relation to the charge density. The charge present on the sample, Q, is dependent on its volume and charge density. The charge density on the fiber is that provided by the coupling medium or dielectric material, such as the capillary tube or air. The amount of the induced charge per unit time on the fiber will ultimately dictate the measured voltage. This explains the fiber charging and decay for samples shorter and larger than the detection gap, respectively. A representation of the following is shown in Fig. 4, adapted from ref. 29. For short fibers, the total charge on the fiber is below its maximum as the fiber length is shorter than the full electrode width (A). After reaching a maximum (B), the induced charges distribute along its whole length, reducing the charge density. When comparing samples equal in length, an increase of fiber area will lead to higher charging, leading to higher current and, hence, to higher voltage output. The voltage increase with the fiber volume appears to follow an exponential relationship (Fig. S3†), until it reaches a saturation point or plateau. The amplitude of such a plateau might be dependent on the fiber dimension. (C) In relation to fiber charge, or effective coupling capacitance, is the resistance detection limit. As illustrated in Fig. 3, and further discussed in the following section, the changes in the resistance with values below the detection limit range will be negligible with respect to the high coupling impedance present in the sensor (e.g. low coupling capacitance). This sets a practical operating mode, where C4D can be used as an area or conductivity sensor, for fibers below or above the resistance threshold.
Area estimation
Once the key aspects of the signal output as a function of fiber properties are identified, the next and ultimate goal is to extract quantitative information on C4D measurements for fibers. Since the detector might be used with a capillary tube or air measurements, analysis on both experimental setups was carried out. It has been shown that the C4D signal is highly sensitive to area variation and independent of the changes in the resistance for this particular sensor and the fibers studied. Without having identified yet the effective coupling capacitance, it is useful to observe the relationship between the voltage and area. This is shown in Fig. 5a and b, with the experimental data resulting from the capillary and air measurements, respectively. Data points (black squares) are connected with a mono-exponential function (red line) described in eqn (7) and (8).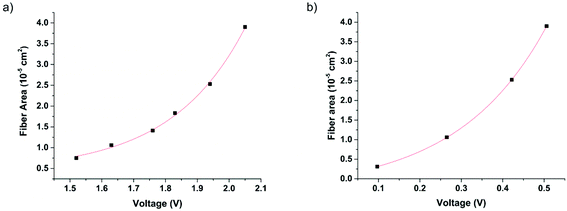 | ||
| Fig. 5 Experimental values of the fiber area in relation to the signal output (squares), and their fitting function (red line), measured in a capillary (a) and air (b). The areas are expressed in 10−5 cm2. (a) Each data point corresponds to the voltage value listed in Table 1, for fibers F1–F6 of 2 cm in length. (b) The voltage values taken from the offset values of the fitting functions, listed in Table S1.† | ||
In both datasets, the experimental data follow a clear exponential trend in good agreement with the fitting function (R2 = 0.99). The resulting fitting for capillary and air measurements is shown in eqn (7) and (8), respectively. The areas are expressed in 10−5 cm2 and the voltage in volts.
 | (7) |
 | (8) |
These equations serve as an empirical model for extracting the fiber area from its voltage value, either for capillary or air measurements. Since the resistance of the studied fibers is well below the estimated resistance detection limit, the voltage output is due to changes in the coupling capacitance, which in turn is due to changes in the fiber area. Knowing the cross-sectional area from the voltage output, and the specific conductivity (S cm−1) of the test sample, it is then possible to determine the fiber conductivity. For example, for SS, of known specific resistivity (8.06 × 10⁻⁶ ohm cm), and a voltage value of 0.097, results on an estimated resistance of 25.8 ohms (error of 0.7%) after introducing values in eqn (8) and (5). The same approach can be applied for RGO fibers, although an accurate estimation of the intrinsic resistivity of RGO fibers is difficult. This was seen during the preparation of the RGO fibers, where the fiber conductivity was not a constant value as in metals, rather a variable depending on the fiber area. A rationale for such effect is the hindered reduction of the GO component for thicker fibers with respect to thinner fibers. In our case, using an average specific resistivity of 1.49 × 10⁻² ohm cm results in an estimation error up to 10% with respect to 4PP measurements.
It is important to mention that the method is independent of the fiber cross-sectional shape, in contrast to other laser based methods. It was also found that the sensor is not sensitive to the overall fiber periphery, but to the conductive regions only.
Coaxial fibers
Another possibility of C4D is to measure conductive fibers coated with dielectric materials, also known as enamelled or coaxial fibers. In this case, and as a reference model, F3 fibers were coated with Parylene, using a molecular vapour deposition method. This resulted in a homogeneous coating of controllable thickness. To evaluate the effect of the dielectric layer, different coating thicknesses were prepared. As shown in Fig. S4 and Table S2,† these coatings were 6.5, 14.1, and 20.7 micron thick. The thickness was regulated by the amount of the Parylene dimer used for each cycle. The measurements of the coated F3 were carried out in a capillary tube, for 2 cm sample length. The measured voltages are listed in Table S2.† No marked difference in the signal amplitude could be observed, although a slightly reduced voltage output could be expected as the dielectric layer is increased. Due to the use of high excitation frequency, the dielectric layer had a negligible effect on the voltage output. The differences in the voltage amplitude are attributed to the differences in the RGO fiber area. The same as mentioned above, upon sensor calibration, the fiber area can be extracted from the voltage output, and in turn, the fiber conductivity can be calculated if the specific resistivity of the material is known. Alternatively, for fibers of known area and coupling capacitance, the fiber resistance underneath the dielectric layer could also be calculated.Estimation of effective coupling capacitance
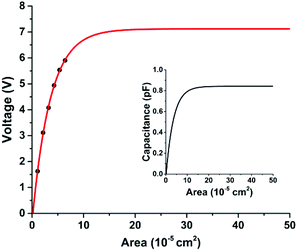
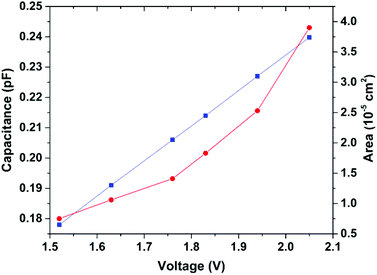
In addition to the empirical method for fiber area determination, a parametric analysis of the voltage output was also performed. Since the voltage change in response to area variation is due to the increase in coupling capacitance, it is reasonable to expect a proportional relationship between the effective coupling capacitance and area. To find out the effective coupling capacitance, further analysis of the data in Fig. S3† was done. Here, by applying a mono-exponential fitting function to the experimental data (R2 = 0.99), and extrapolating to large area values, a constant voltage value of 7.12 V was reached (see Fig. 6). This value corresponds to an equivalent fiber area of 5 × 10⁻⁴ cm2. An assumption was made by attributing the limiting voltage to the sensor's geometrical capacitance. Using eqn (4), and εr (PTFE) = 2.1, yields a geometrical capacitance of 0.84 pF. Upon normalisation and rescaling of the fitted function to the sensor's capacitance, the coupling capacitance as a function of fiber area can be extracted (see Fig. 6 inset). For fiber F5, this yields a value of 0.19 pF for an area of 1.06 × 10⁻⁵ cm2.When a similar approach was followed with other fibers, different limiting voltages were obtained (data not shown), indicating that the coupling capacitances must be extracted individually for each fiber when using such an approach. In order to validate the estimated coupling capacitance for fiber F5, eqn (1)–(3) were used. When the estimated coupling capacitance was introduced in the equations, a factor of 6.19 between the measured and expected voltage was obtained. The origin of the factor has not been fully identified, but it may correspond to an internal signal amplification within the measuring apparatus. Based on the hypothesis that the factor is constant for all fibers measured in a capillary tube, all the measured voltages using the capillary tube were divided by the factor, and the coupling capacitances were extracted. The resulting capacitance values for fibers F1–F6 are listed in Table S3† and represented in Fig. 7 as a function of their corresponding output voltage. In addition, the measured areas are also plotted as a function of their corresponding voltage. The increase in voltage output follows a linear increase in coupling capacitance, while the fiber cross-section varies exponentially. A similar procedure was carried out for air measurements, based on the voltage extrapolation to 2 cm. For the fiber SS, of known dimensions and radial shape, the correction factor was 3.22. The difference between the factors of capillary and air measurements is attributed to the increased dielectric coupling of PTFE and/or the off-centre fiber alignment.
Resistance estimation and detection limit
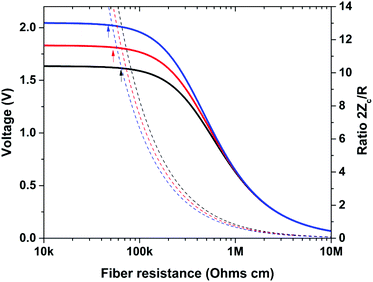
Last but not least, knowing the effective coupling capacitance of a single fiber, it is now possible to have a closer look at the resistance detection limit and optimum range for resistance measurements. Using equations from (1)–(3), and the effective coupling capacitances of fibers F1, F3, and F5, their voltage response was simulated as a function of fiber resistance. In addition to the voltage, the ratio of the coupling impedance (2Zc) to fiber resistance is also shown. Note that the resistance values are expressed in ohms at 1 cm, instead of 2 cm as given in the calculations. The voltage values shown on the y-axis are converted to experimental voltages by multiplying with the factor 6.19 (Fig. 8).The resistance detection limit can be seen as a voltage plateau for low resistance values, similar to that in Fig. 3. The detection limit is chosen at the point where the sensitivity is below 1 mV kohm−1, corresponding to a 1% change from the saturation voltage. A useful term to describe the sensor response in absolute terms as a function of fiber properties is the coupling impedance to resistance ratio (2Zc/R). The resistance detection limits for F1, F3 and F5 were very similar, with an impedance ratio of 14. In terms of resistance, the offset voltages correspond to 46, 53 and 60 kohm for F1, F3 and F6, respectively. In general, the larger the area, the lower the resistance detection limit. There is a discrepancy however with the data in Fig. 3 in regard to the resistance detection limit, which was found experimentally at about 7 kohm cm. This is attributed to the fact that non-tensioned fibers of a rough profile displayed lower voltages than expected. The increased coupling capacitance from a larger area may not be transformed into a higher voltage output if there is an air gap between the electrode and fiber.
For resistance measurements using C4D, a linear range is needed. For the 3 fibers studied, the linear range is located between 20 and 70% of the saturation voltage. In terms of 2Zc/R, the linear range was similar for all fibers, between 2.66 and 0.63. For example for F3, this corresponds to a resistance interval from 0.28 to 1.18 Mohm cm. The voltage response as a function of resistance had a good linear fit in such an interval (R2 = 0.99) of the form: V = a![[thin space (1/6-em)]](https://www.rsc.org/images/entities/char_2009.gif) log(R) + b (resistance (R) in ohm cm, slope (a), and intercept (b)). Different parameters are calculated for each fiber as listed in Table S4.† For air measurements, lower Z/R ratios are expected for the linear range in resistance to voltage, since the coupling capacitance is lower.
log(R) + b (resistance (R) in ohm cm, slope (a), and intercept (b)). Different parameters are calculated for each fiber as listed in Table S4.† For air measurements, lower Z/R ratios are expected for the linear range in resistance to voltage, since the coupling capacitance is lower.
These results indicate that using C4D for resistance measurements can be challenging and limited to high resistance test samples. The 2Zc/R ratio can serve as an indicator to model the sensor for achieving the desired response (either an area or resistance detector). It is important to note that the impedance ratios are only valid for this particular sensor. Other setups with electrodes of smaller diameter will have much improved effective coupling capacitance. In general, for improving the resistance response, the 2Zc/R ratio should be lowered through the following variables: (1) increase of excitation frequency, (2) increase of electrode width, (3) a large fiber area or small electrode diameter, and (4) use of a capillary of higher dielectric constant and/or of reduced thickness.
Conclusions
In summary, a thorough analysis of C4D for micron-sized fibers has been carried out, ranging from the fundamental working principles to empirical, parametric analysis and simulation models. Due to the coupling principle between electrodes and fibers, the sensor is highly sensitive to the fiber area and length. This implies that for comparative purposes, only fibers of the same length should be used. On the other hand, it was also observed that the effect of the length becomes nil for long fibers. The analysis of the experimental data and simulated voltage output for the different fibers investigated revealed that C4D can work as an area or resistance detector. In addition, resistance measurements are influenced by the fiber area through the coupling impedance. Therefore, only one variable can be measured at a time. The functioning mode can be categorized in absolute terms by the coupling impedance to fiber resistance ratio. The area or resistance detection occurs at high or low impedance ratios, respectively. For area determination, the sensor must be calibrated due to the non-linear relationship between the area and voltage. Upon calibration, the voltage response was found to be highly sensitive and independent of the fiber geometry. Resistance measurements are challenging for low resistance samples but are possible with an improved sensor design and the use of thicker fibers. Due to the contactless nature of the measurement, C4D could also be used to determine the electrical properties of fibers with insulating coatings, otherwise inaccessible by contact methods. This study serves as a baseline for the design and calibration of C4D for the evaluation of conductive fibers by the contactless means. The applications of this approach could be beneficial for reel to reel fiber processing, or in situ monitoring of the fiber properties during additive manufacturing. Further studies on fiber characterisation could be aimed at improving the sensor's resistance sensitivity and the sensor's response to a running fiber using the air measurement setup.Conflicts of interest
There are no conflicts to declare.Acknowledgements
This work has been supported by the Australian Research Council Centre of Excellence Scheme (Project Number CE 140100012). The authors would like to thank the Australian National Nanofabrication Facility Materials Node for equipment use.References
- F. Meng, W. Lu, Q. Li, J.-H. Byun, Y. Oh and T.-W. Chou, Adv. Mater., 2015, 27, 5113–5131 CrossRef CAS PubMed.
- E. Frank, L. M. Steudle, D. Ingildeev, J. M. Sporl and M. R. Buchmeiser, Angew. Chem., Int. Ed., 2014, 53, 5262–5298 CrossRef CAS PubMed.
- J. Foroughi, G. M. Spinks, D. Antiohos, A. Mirabedini, S. Gambhir, G. G. Wallace, S. R. Ghorbani, G. Peleckis, M. E. Kozlov, M. D. Lima and R. H. Baughman, Adv. Funct. Mater., 2014, 24, 5859–5865 CrossRef CAS.
- J. Foroughi, G. M. Spinks, S. R. Ghorbani, M. E. Kozlov, F. Safaei, G. Peleckis, G. G. Wallace and R. H. Baughman, Nanoscale, 2012, 4, 940–945 RSC.
- J. Foroughi, G. M. Spinks, S. Aziz, A. Mirabedini, A. Jeiranikhameneh, G. G. Wallace, M. E. Kozlov and R. H. Baughman, ACS Nano, 2016, 10, 9129–9135 CrossRef CAS PubMed.
- M. D. Lima, N. Li, M. Jung de Andrade, S. Fang, J. Oh, G. M. Spinks, M. E. Kozlov, C. S. Haines, D. Suh, J. Foroughi, S. J. Kim, Y. Chen, T. Ware, M. K. Shin, L. D. Machado, A. F. Fonseca, J. D. W. Madden, W. E. Voit, D. S. Galvão and R. H. Baughman, Science, 2012, 338, 928–932 CrossRef CAS PubMed.
- J. Foroughi, G. M. Spinks, G. G. Wallace, J. Oh, M. E. Kozlov, S. Fang, T. Mirfakhrai, J. D. W. Madden, M. Shin, S. J. Kim and R. H. Baughman, Science, 2011, 334, 494–497 CrossRef CAS PubMed.
- W. Zeng, L. Shu, Q. Li, S. Chen, F. Wang and X. M. Tao, Adv. Mater., 2014, 26, 5310–5336 CrossRef CAS PubMed.
- H. Cheng, C. Hu, Y. Zhao and L. Qu, NPG Asia Mater., 2014, 6, e113 CrossRef CAS.
- Z. Xu and C. Gao, Mater. Today, 2015, 18, 480–492 CrossRef CAS.
- L. Chen, Y. Liu, Y. Zhao, N. Chen and L. Qu, Nanotechnology, 2016, 27, 032001 CrossRef PubMed.
- T. Bashir, L. Fast, M. Skrifvars and N.-K. Persson, J. Appl. Polym. Sci., 2012, 124, 2954–2961 CrossRef CAS.
- Y. H. Ding, P. Zhang, Q. Zhuo, H. M. Ren, Z. M. Yang and Y. Jiang, Nanotechnology, 2011, 22, 215601 CrossRef CAS PubMed.
- R. Trusovas, K. Ratautas, G. Račiukaitis, J. Barkauskas, I. Stankevičienė, G. Niaura and R. Mažeikienė, Carbon, 2013, 52, 574–582 CrossRef CAS.
- S. Eigler, S. Grimm, M. Enzelberger-Heim, P. Muller and A. Hirsch, Chem. Commun., 2013, 49, 7391–7393 RSC.
- C. Mattevi, G. Eda, S. Agnoli, S. Miller, K. A. Mkhoyan, O. Celik, D. Mastrogiovanni, G. Granozzi, E. Garfunkel and M. Chhowalla, Adv. Funct. Mater., 2009, 19, 2577–2583 CrossRef CAS.
- R. Jalili, S. H. Aboutalebi, D. Esrafilzadeh, R. L. Shepherd, J. Chen, S. Aminorroaya-Yamini, K. Konstantinov, A. I. Minett, J. M. Razal and G. G. Wallace, Adv. Funct. Mater., 2013, 23, 5345–5354 CrossRef CAS.
- A. M. Azzeer, L. M. Silber, I. L. Spain, C. E. Patton and H. A. Goldberg, J. Appl. Phys., 1985, 57, 2529 CrossRef CAS.
- T. Bernardino, P. Antoranz, J. M. Miranda and J. L. Sebastian, European Microwave Integrated Circuit Conference, 2007, pp. 603–606.
- N. D. Orloff, C. J. Long, J. Obrzut, L. Maillaud, F. Mirri, T. P. Kole, R. D. McMichael, M. Pasquali, S. J. Stranick and J. A. Liddle, Sci. Rep., 2015, 5, 17019 CrossRef CAS PubMed.
- N. D. Orloff, J. Obrzut, C. J. Long, T. Lam, P. Kabos, D. R. Novotny, J. C. Booth and J. A. Liddle, IEEE Trans. Microwave Theory Tech., 2014, 62, 2149–2159 CrossRef.
- J. M. Cabot, E. Duffy, S. Currivan, A. Ruland, R. Jalili, A. J. Mozer, P. C. Innis, G. G. Wallace, M. Breadmore and B. Paull, Analyst, 2016, 141, 2774–2782 RSC.
- P. Kuban and P. C. Hauser, Electrophoresis, 2004, 25, 3387–3397 CrossRef CAS PubMed.
- P. Kuban and P. C. Hauser, Electrophoresis, 2004, 25, 3398–3405 CrossRef CAS PubMed.
- F. Opekar, P. Tuma and K. Stulik, Sensors, 2013, 13, 2786–2801 CrossRef CAS PubMed.
- A. J. Zemann, E. Schnell, D. Volgger and G. K. Bonn, Anal. Chem., 1998, 70, 563–567 CrossRef PubMed.
- J. A. F. da Silva and C. L. do Lago, Anal. Chem., 1998, 70, 4339–4343 CrossRef.
- P. Kuban and P. C. Hauser, Electrophoresis, 2017, 38, 95–114 CrossRef CAS PubMed.
- Z. Zhenli, L. Yaolong, X. Zhongshi, Z. Xilei, K. Qi and S. Dazhong, Int. J. Electrochem. Sci., 2013, 8, 3357–3370 Search PubMed.
Footnote |
| † Electronic supplementary information (ESI) available. See DOI: 10.1039/c7an00442g |
| This journal is © The Royal Society of Chemistry 2018 |

