Detection of antibiotic resistant Escherichia Coli bacteria using infrared microscopy and advanced multivariate analysis
Ahmad
Salman
 *a,
Uraib
Sharaha
b,
Eladio
Rodriguez-Diaz
cd,
Elad
Shufan
a,
Klaris
Riesenberg
e,
Irving J.
Bigio
fg and
Mahmoud
Huleihel
*d
aDepartment of Physics, SCE – Shamoon College of Engineering, Beer-Sheva 84100, Israel. E-mail: ahmad@sce.ac.il; Fax: +972-8-6475758; Tel: +972-8-6475794
bDepartment of Microbiology, Immunology and Genetics, Ben-Gurion University of the Negev, Beer-Sheva 84105, Israel
cDepartment of Medicine, Section of Gastroenterology, Boston University School of Medicine, Boston, MA, USA
dSection of Gastroenterology, VA Boston Healthcare System, Boston, MA, USA. E-mail: mahmoudh@bgu.ac.il; Fax: +972-8-6479867; Tel: +972-8-6479867
eSoroka University Medical Center, Beer-Sheva 84105, Israel
fDepartment of Biomedical Engineering, Boston University, Boston, MA, USA
gDepartment of Electrical & Computer Engineering, Boston University, Boston, MA, USA
First published on 18th May 2017
Abstract
Bacterial resistance to antibiotics is becoming a global health-care problem. Bacteria are involved in many diseases, and antibiotics have been the most effective treatment for them. It is essential to treat an infection with an antibiotic to which the infecting bacteria is sensitive; otherwise, the treatment is not effective and may lead to life-threatening progression of disease. Classical microbiology methods that are used for determination of bacterial susceptibility to antibiotics are time consuming, accounting for problematic delays in the administration of appropriate drugs. Infrared-absorption microscopy is a sensitive and rapid method, enabling the acquisition of biochemical information from cells at the molecular level. The combination of Fourier transform infrared (FTIR) microscopy with new statistical classification methods for spectral analysis has become a powerful technique, with the ability to detect structural molecular changes associated with resistivity of bacteria to antibiotics. It was possible to differentiate between isolates of Escherichia (E.) coli that were sensitive or resistant to different antibiotics with good accuracy. The objective computational classifier, based on infrared absorption spectra, is highly sensitive to the subtle infrared spectral changes that correlate with molecular changes associated with resistivity. These changes enable differentiating between the resistant and sensitive E. coli isolates within a few minutes, following the initial culture. This study provides proof-of-concept evidence for the translational potential of this spectroscopic technique in the clinical management of bacterial infections, by characterizing and classifying antibiotic resistance in a much shorter time than possible with current standard laboratory methods.
1. Introduction
The intensive use of antibiotics in both public health and animal husbandry has promoted bacterial resistance to antibiotics,1–4 to the extent that some bacteria have developed resistance to virtually all of the commonly used antibiotics.1 Bacterial resistance to antibiotics may be conferred by the exchange of chromosomal or genetic material via plasmids and transposons in the bacteria.1,5,6 This can cause molecular changes in the host genome that may lead to the expression of specific enzymes that can attack and disassemble the antibiotic or that may cause the targeted enzyme (RNA polymerase 1, for example) to be stable when exposed and therefore resistant to the antibiotic. For example, specific mutations that effect changes in the targeted enzyme can essentially change its identity without altering its activity.7 Indeed, hundreds of resistance genes have been characterized in both Gram-negative and Gram-positive species.8,9 Most of these mutations have developed as a result of repeated unnecessary use of these antibiotics, particularly for a treatment time that is insufficient to eliminate all of the bacteria. The end result of this scenario is a return to the pre-antibiotics period, such that many routine infections will be difficult to treat.10 Moreover, simple surgeries, organ transplantation, and cancer chemotherapy are also endangered by the increase in bacterial resistance to antibiotics.11The early detection and identification of bacterial susceptibility to antibiotic enables the clinician to select the most effective antimicrobial agents to target the pathogen. Currently used procedures for determining bacterial resistance to antibiotics are divided between phenotypic and genotypic methods. Classical phenotypic methods are routinely used in hospitals, and they include broth microdilution12,13 and manual methods, such as disk diffusion and gradient diffusion.14 Each method has its advantages and limitations. The antimicrobial gradient method is expensive,15 whereas the disk diffusion test is simple, practical, and well standardized, but its main disadvantages are a lack of mechanization or automation, the non-quantitative result and the long times required to obtain results.
These classical phenotypic methods rate the bacterium as sensitive or resistant to a specific antibiotic, or as exhibiting intermediate susceptibility. For a resistant or intermediate susceptibility test result, the physician will seek an alternative antibiotic treatment, if one exists. By the conservative approach, the test classification combines resistant and intermediate responses as one category. In the present study, we adopted this conservative approach.
Using the classical methods, the time that elapses between the receipt of patient material and the presentation of identification results to the clinician is too long (at least 48 hours). During this period of time, physicians typically begin treatment with broad-spectrum antibiotics. If the time between bacterial identification and a diagnosis of antibiotic resistance could be shortened, patients can be treated with the appropriate antibiotics, which will significantly reduce the poor health outcomes and costs associated with inadequately treated infectious diseases.16
Genotypic methods for rapid identification of bacteria for clinical diagnostic microbiology rely on the new application of existing technologies.17,18 Although molecular methods are used widely in academia and in reference laboratories, and while they have a high potential to be used as valuable infection control tools, they are not commonly used in clinical diagnostic laboratories, due partially to their high costs.19
In recent years, new developments in the applications of optical technologies to biomedical problems has provided important new insights into the world of microorganisms. Infrared (IR) microscopy has advanced significantly, with improved spectral and spatial resolutions, enabling the acquisition of unprecedented biochemical information at the molecular level for both prokaryotic and eukaryotic cells.20–25 More relevant to clinical laboratory applications, microscopic implementation of Fourier transform infrared (FTIR) spectroscopy, with its ability to provide detailed information on the spatial distribution of chemical composition at the molecular level, has emerged as a powerful tool for biochemical analysis.26 FTIR can distinguish a wide range of biomolecules based on spectral signatures in the mid-IR absorption range: i.e., 600–4000 cm−1 (wavenumbers).
Matrix Assisted Laser Desorption/Ionization (MALDI) Time of Flight Mass Spectrometry (TOF-MS) is a spectroscopic method that is used for taxonomic identification and rapid characterization of bacteria at the genus, species, and isolate level.27 Despite the demonstrated value of MALDI-TOF, species like Escherichia coli, Shigella spp., some strains of Stenotrophomonas maltophilia, Streptococcus pneumonia or Propionibacterium acnes, and members of the S. oralis/mitis group can be misidentified by MALDI-TOF MS because of the low rate of differences in their ribosomal protein sequences. Nonetheless, the detection of the bacteria at the species level using MALDI-TOF is becoming a routine test at some hospitals (such as Soroka University Medical Center (SUMC), in Beer Sheva, Israel).
While using MALDI-TOF for the identification of bacteria at the species level has become a routine test, it is a long way from being applied for detection of antibiotic resistance of bacteria. Recently a few studies have been carried out to assess the potential of detecting antibiotic resistance of bacteria by MALDI-TOF.28,29 Although Sparbier et al. reported some success in the detection of bacterial resistance to β-lactam antibiotics, their analysis was based only on nine strains.29 Also, conflicting results have been published regarding the ability of mass spectrometry to distinguish between methicillin-susceptible and resistant S. aureus.30–33
Given the considerations presented here, it remains important and worthwhile to search for an appropriate method for rapid and reliable detection and identification of antibiotic-resistant bacteria. As stated above, IR spectroscopy is one of the most promising techniques to be exploited for its potential to rapidly detect and identify resistant bacteria.
A range of disciplines, including medicine, materials science, forensics, biochemistry, biomedical science, and geochemistry, with both basic and applied research goals, employ IR spectroscopy.23,26,34–43 The biomolecular components of the cell yield characteristic spectra that provide rich structural and functional information.26,44,45 This includes the demonstrated utility of IR spectroscopy to distinguish the genotypic and phenotypic changes that accompany tumorigenic transformation of cells to cancer,48,55 changes that are similar to those related to development of antibiotic resistance. Our previous studies have shown that IR spectroscopy can detect diseases in the early phases of development or cell transformation at a stage when cell morphology is still normal.41,42 We also demonstrated the use of FTIR spectroscopy to classify Phytophthora infestans isolates into mefenoxam resistant and non-resistant types, with 95% specificity and 88% sensitivity.46 In another study,47 we used IR spectroscopy with principal component analysis (PCA) and linear discriminant analysis (LDA) to classify 35 isolates of Colletotrichum coccodes fungus into eight vegetative compatibility groups (VCGs), with high success rate. Based on our encouraging results in previous studies,36 in this study bacterial samples were classified according to their susceptibility to antibiotics using this spectroscopic technique.
Despite the great promise shown by IR-spectroscopy, its true potential in routine clinical diagnosis has not been established. The present work thus aims to provide proof-of-concept of the translational potential of this underexploited spectroscopic technique in objective clinical identification of bacterial susceptibility to antibiotics.
2. Materials and methods
2.1 Identification of patient bacterial samples
Specimens of de-identified patients were provided by the microbiology laboratory at SUMC under the approval of the Institutional Review Helsinki Board. Samples were grown overnight on selective agar plates at 24 °C. Pure bacterial colonies were examined by classical methods, for species type (MALDI-TOF) and susceptibility (disk diffusion) to a number of antibiotics. In addition, small amounts from the same colonies were sampled by bacteriological needle and placed on a zinc–selenium slide (transparent to IR radiation), air dried for 15 min at room temperature, and then examined by FTIR microscopy.2.2 FTIR measurements
Because the spectral changes in the bacteria associated with the development of resistivity to antibiotics are subtle, spectra with a high signal-to-noise ratio (SNR) are required. The spectra were therefore obtained using the transmission mode, which is known to give high SNR (compared to other IR sensing techniques), and measured with a cooled mercury cadmium telluride (MCT) detector. Data were collected at 4 cm−1 spectral resolution from 600 to 4000 cm−1. For the analysis, the range of 900 to 1800 cm−1 was used, because studies have shown that this spectral range provides the most information about cell activity and proliferation.36,482.3 Spectral manipulation
All spectra were manipulated using commercial OPUS 7 software (Bruker, Germany). First, the spectra were smoothed using a Savitzky–Golay algorithm with 13 points. Then the spectra were cropped to the range 900–1800 cm−1, and baseline correction was employed using the Concave Rubber Band method with 64 points and five iterations.49,50 The spectra then were normalized using the Vector Normalize method, and the minima were shifted to zero using Offset normalization. Using Vector normalization, we subtract the intensity average of the whole spectral range from the spectrum itself. The resulting spectrum is normalized to 1.0.2.4 Data analysis
The computational classifiers and machine learning algorithms were developed in our laboratories, based on methodologies developed for classification of optical spectroscopy at visible wavelengths.51 The obtained IR spectra were used to train classifiers and test their performances.A variety of statistical tools (including sequential forward feature selection and principal component analysis) were used to extract spectral features, from the high-dimensionality spectra, for the training.
All spectra were pre-processed prior to analysis. The spectra were then normalized to unit area, to facilitate analysis of spectral shape, independent of relative intensities. Additionally, the spectra were down sampled by a factor of two to further smooth the signal. To classify measured spectra, we developed a diagnostic algorithm based on multidimensional pattern-recognition/machine learning. Given the high-dimensional nature of the data, we used a framework consisting of dimensionality-reduction followed by classification. Sequential floating forward selection (SFFS) was used for dimensionality-reduction,52 followed by multidimensional classification using linear support vector machines (SVM).53,54 For a given antibiotic, the diagnostic algorithm was designed to distinguish between spectra found to be sensitive to the antibiotic from spectra that were found to be resistive, based on the gold standard. Leave-one-out cross-validation was used to optimize classifier parameters and obtain classification performance estimates.
3. Results
In the work reported here, we investigated 496 different isolates of E. coli. These isolates were identified for their species using MALDI-TOF and classified for their susceptibility as resistant or sensitive, for a range of specific antibiotics using the phenotypic disk diffusion method. As an example, we list the details of ten of these isolates and their classification results for six different antibiotics in Table 1.| Isolate numbers as they appear in the medical files | Ampicillin | Antibiotics | ||||
|---|---|---|---|---|---|---|
| Cefuroxime | Ceftriaxone | Ciprofloxacin | Sulfamethoxa Trimeth | Amoxicillin ClavulA | ||
| 848430431 | R | R | R | R | R | S |
| 314205 | R | S | S | R | ||
| 314206 | R | S | S | S | ||
| 314203 | R | S | S | R | ||
| 848445709 | S | S | S | S | S | S |
| 848429823 | R | S | S | S | S | S |
| 848461277 | R | S | R | S | S | R |
| 314133 | S | S | S | S | ||
| 848441653 | R | S | R | S | R | S |
| 315050 | S | S | S | S | ||
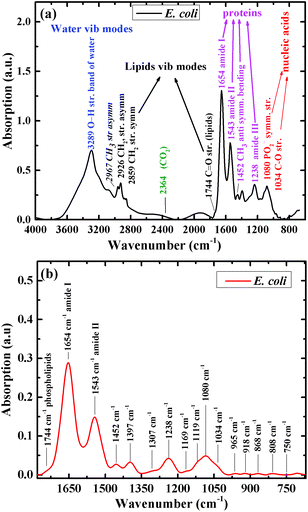
Fig. 1a shows the infrared absorption spectrum of one of the E. coli isolates included in this research, before spectral manipulation. The main spectral features in the high wavenumber region (2800–3200 cm−1) are the bands detected at 2859 and 2926 cm−1. These bands correspond mainly to phospholipids absorbance.55 Water absorbance bands in this region were excluded from the spectra as part of the analysis procedure. The main features in the low wavenumber region (715–1800 cm−1), after spectral manipulation, are the amide I and amide II absorption bands with centroids at 1654 cm−1 and 1543 cm−1, respectively (Fig. 1b).56 A large absorbance band at 1080 cm−1 is mainly attributed to carbohydrate and nucleic acid vibrations. The centroid of the amide III band is detected at 1238 cm−1. The glycogen C–O stretching vibration is detected at 1034 cm−1.55,57 The centroids of the absorption bands were determined using second-derivative spectra.
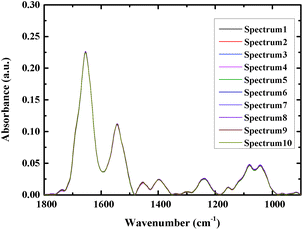
At least 16 spectra of each sample were measured, and the average spectra were used for analysis to increase the accuracy. Fig. 2 shows an overlay of ten spectra that were acquired from different sites of the same bacterial sample, as a way to examine the reproducibility of the spectra. As can be seen from the figure the spectra closely overlay each other, demonstrating good reproducibility.
The averages of spectra representing twenty different isolates of E. coli that were found to be sensitive or resistant to ampicillin are plotted in Fig. 3. As can be seen from the figure, the spectra are similar and overlapped, but with a significant degree of variation. The spectra of the 496 different isolates of E. coli that were examined in this study are also similar, exhibiting subtle variations in shape and intensity of various spectral features, as shown in Fig. 3, a scenario that dictated our use of sophisticated multivariate and statistical methods to achieve a good level of classification.49
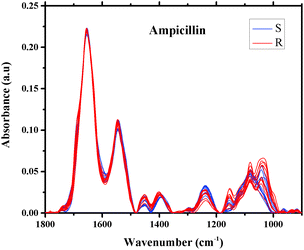 | ||
| Fig. 3 Infrared absorption spectra of E. coli isolates sensitive (10 spectra) and resistant (10 spectra) to ampicillin in the region 900–1800 cm−1 after spectral manipulations. | ||
To classify FTIR spectra, we developed a diagnostic algorithm based on multidimensional pattern-recognition/machine learning. Given the high-dimensional nature of the data, we used a framework consisting of dimensionality-reduction (feature selection),52 followed by multidimensional classification using linear support vector machines (SVM).53,54 We considered a binary classification problem with spectra from isolates being grouped based on susceptibility, to a specific antibiotic, as resistant or sensitive.
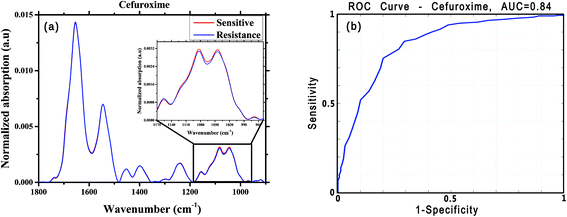
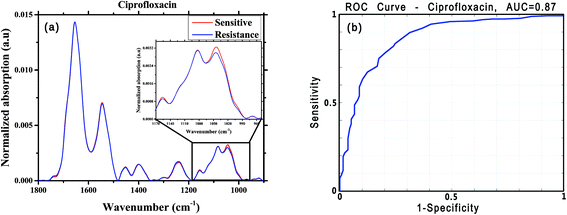
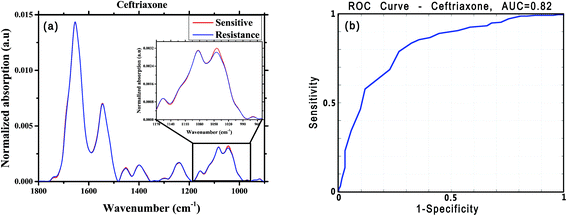
For this analysis, we focused on the low-wavenumber spectral region (900–1800 cm−1), as an interim analysis revealed this region to allow better bacterial susceptibility discrimination. Leave-one-out cross-validation was used to optimize classifier parameters and obtain classification performance estimates. Fig. 4 shows the average low-wavenumber spectra grouped based on the isolate susceptibility to cefuroxime (Fig. 4a) and the resulting receiver operating characteristic (ROC) curve for this case (Fig. 4b). The ROC curve illustrates the accuracy of the tests in terms of the probability for correctly determining whether a sample is resistant or sensitive, quantitatively represented by the area under the curve (AUC) of the ROC plot. An area of 1 represents a perfect test; an area of 0.5 represents random chance (akin to classification by flipping a coin). Similar figures are shown for two other antibiotics: ciprofloxacin (Fig. 5) and ceftriaxone (Fig. 6).
For each antibiotic, we used sensitivity (SE) and specificity (SP), balanced accuracy (Acc_bal = (SE + SP)/2), positive-predictive value (PPV) and area under the curve (AUC) as performance metrics for our preliminary tests of classification of E. coli susceptibilities. We defined bacterial resistance to an antibiotic as the “negative” state, and the sensitive condition as the “positive” state. Thus, for each specific drug, if culture assay deemed the bacteria to be sensitive, then SE refers to the probability that the algorithm will correctly classify the FTIR spectra as sensitive; and SP corresponds to the probability of correctly identifying the bacteria as resistance to the drug. The PPV is the probability that the culture test will confirm the bacteria to be sensitive to a specific drug, if the algorithm predicts sensitivity. Exemplary results of preliminary classifications (for six of the tested antibiotics) are summarized in Table 2.
| Resistant spectra | Sensitive spectra | SE | SP | Acc_bal | PPV | AUC | |
|---|---|---|---|---|---|---|---|
| Ampicillin | 164 | 329 | 0.74 | 0.62 | 0.70 | 0.49 | 0.69 |
| Cefuroxime | 316 | 160 | 0.80 | 0.73 | 0.75 | 0.86 | 0.84 |
| Ceftriaxone | 256 | 146 | 0.79 | 0.73 | 0.75 | 0.84 | 0.82 |
| Ciprofloxacin | 273 | 138 | 0.84 | 0.75 | 0.78 | 0.87 | 0.87 |
| Sulfamethoxa Trimeth | 228 | 142 | 0.64 | 0.67 | 0.66 | 0.76 | 0.67 |
| Amoxicillin ClavulA | 326 | 56 | 0.72 | 0.77 | 0.76 | 0.95 | 0.79 |
Another statistical result of high potential clinical relevance is the agreement rate of the classification with the standard test in identifying an effective antibiotic from among the available options. Using the data, a different classification algorithm was developed for each of the tested antibiotics. Each of those individual classifiers has its own performance statistics for the whole dataset (Table 2), but for any individual patient sample, the confidence level for a classification (related to the “distance” from the multidimensional class boundary, or risk of misclassification) may be higher or lower for different classifiers (antibiotics).
Since the clinical need is to be able to provide the physician with recommendations for antibiotics that are most likely to work, a new analysis was performed. This analysis is based on the combined (ensemble) results of individual antibiotic sensitivity classifiers, to yield the choices of one, two or three antibiotics with highest combination of classification performance and classification confidence for the specific patient sample.58 Posterior probabilities of the output of each classifier for a given patient were used to rank antibiotics to which the pathogen is most likely to be sensitive. Here, the definition of sensitivity and specificity of the ensemble analysis was modified. Sensitivity is defined as the accuracy of the ensemble in correctly identifying one effective antibiotic, when one or more effective antibiotics exist, based on the gold standard. Specificity is defined as the accuracy of the ensemble in correctly identifying all antibiotics (of a test group) to which the pathogen is resistant, when those antibiotics are ineffective, based on the gold standard. The sensitivity performance was also analyzed based on identifying effective antibiotics from the first N antibiotics, as ranked by the posterior probability of the output of each classifier for a given patient. For example:
• Sen (1/1) – the sensitivity in identifying the top-ranked antibiotic as effective when it is effective by the gold standard
• Sen (1/2) – the sensitivity in identifying one of the top two ranked antibiotics as effective when the top two are effective based on the gold standard.
• Sen (2/2) – the sensitivity in identifying the top two ranked antibiotics as effective when both are effective based on the gold standard.
The results of ensemble classification performance are summarized in Table 3.
| SP | SE (at least 1) | SE (1/1) | SE (1/2) | SE (2/2) | |
|---|---|---|---|---|---|
| Where. • Ensemble (balanced accuracy) = individual classifiers optimized for balanced accuracy. • Weighted ensemble (balanced accuracy) = individual classifiers optimized for balanced accuracy weighted by the fraction of sensitive samples for a given antibiotic (a priori probability). • Ensemble (PPV) = individual classifiers optimized for PPV. • Weighted ensemble (PPV) = individual classifiers optimized for PPV weighted by the fraction of sensitive samples for a given antibiotic (a priori probability). | |||||
| Ensemble (balanced accuracy) | 0.6 | 0.99 | 0.93 | 0.97 | 0.79 |
| Weighted ensemble (balanced accuracy) | 0.6 | 0.99 | 0.96 | 0.98 | 0.84 |
| Ensemble (PPV) | 1 | 0.98 | 0.90 | 0.94 | 0.69 |
| Weighted ensemble (PPV) | 1 | 0.98 | 0.94 | 0.96 | 0.75 |
As can be seen from Table 3, the agreement rate for the case of the highest statistical sensitivity to be 90% and 94% for one of the top two choices of antibiotics.
4. Discussion
In this study, the potential of the FTIR microscopy technique for rapid assessment of bacterial susceptibility to antibiotics was examined. A number of previous studies published in rigorous journals have reported that the development of antibiotic resistance can be a result of identifiable genetic changes in bacterial strains5,6 and exchange of chromosomal or genetic material via plasmids and transposons in the bacteria,1 thus the vibrational spectral differences between resistant and sensitive isolates are expected to be subtle. Consequently, biochemical changes occur during development of resistance to antibiotics, and we sought to be able to detect spectral changes that correlate with those molecular changes. In this study, our motivation was not to identify these biochemical changes but, rather, we looked for their manifestation in the mid-infrared spectra, regardless of the mechanism of development of resistance to any specific antibiotics.Even though the manifested differences between the average spectra corresponding to resistant and sensitive E. coli presented in Fig. 4, 5 and 6 are subtle, those changes are, nonetheless, sufficiently repeatable to yield promising statistics for the classifications. The high sensitivity of FTIR microscopy to minor molecular changes in cells59,60 thus renders the technique capable of detecting the molecular changes that lead to resistance to a specific antibiotic, as can be seen from Tables 2 and 3.
In our approach to this research (see details under Methods), several points should be taken into account. First, appropriate sample preparation invokes choosing a sufficient concentration of the bacterial cells to yield samples mounted on the ZnSe slides with optimum thickness, resulting in a strong IR signal, but without saturating the IR detector. Second, attention was addressed to the reproducibility of the data, with at least 16 spectra measured from different sites of the same sample, which were averaged to generate the spectrum representative of the sample. Thus, the SNR was high; moreover, the reproducibility of the spectra was excellent as can be seen in Fig. 2.
New methods and computational tools of pattern-recognition were employed for statistical classification of the optical spectra. In a retrospective analysis, these novel statistical tools have shown excellent classification statistics for the FTIR spectra.
A novel element of our data treatment is the use of a new classification paradigm relating to biological variability, which improves current classification performance levels. In this approach, the multidimensional classifier SVM identifies samples at high risk of being misclassified. In most cases, these samples lie near the multi-dimensional decision boundary and, as such, the system would refrain from classifying them, with the risk-tolerance being a controllable parameter. In the literature, this type of approach is known as error-rejection, (or as high/low-confidence decisions in the clinical diagnostic literature), and the result is a lowering of the risk of misclassification.51 This is not to be confused with the much simpler task of rejecting “outlier” spectra, prior to classification, which are due to easily-filtered problems such as poor SNR (e.g., cell culture too sparse), instrumental failure (lamp or detector), etc.
Briefly, the classification algorithm uses an ensemble of decision rules obtained from different spectral regions, each incorporating the high-/low-confidence decision paradigm. A specimen is classified as sensitive or resistant to a specific antibiotic if the decision is made with high confidence; the third outcome is no decision, if the classification has low confidence. The level of confidence is assessed in multi-dimensional space, by which the algorithm identifies samples that are close to the hyperspace decision boundary and thus could lead to uncertain classification.61
The expected result, as demonstrated in earlier work for spectroscopic cancer-risk assessment, is an improvement in performance for those samples that are classified, since only samples classified in high-confidence are considered, which is, of course, at the expense of a small proportion of low-confidence samples that will remain unclassified. This new approach to spectral classification (machine learning) methods is uniquely suited for assessment of antibiotic susceptibility, in that sensitivity to treatment can be intermediate, with some resistance manifesting as slower response to treatment. Thus, determination of a reduced level of confidence in a dichotomous classification can represent the biologic variability of early genetic mutations, and can be used to improve the probability of choosing an antibiotic that classifies as effective with higher reliability. In eventual clinical deployment, the identification of low-confidence samples could simply prompt the classifier to indicate the choice of a different antibiotic, for which the classification confidence is higher or, at worst, lead to the traditional (slower) laboratory tests.
As the most important issue is to help the physician to choose one antibiotic to which the infectious bacteria is sensitive, the ensemble analysis is important, yielding high values for the sensitivity classification rate (Table 3).
We hasten to note that these statistical results are for a retrospective leave-one-out correlation. Retrospective analyses, based on datasets that were used to train the algorithms, are notoriously optimistic; a prospective study (testing a trained algorithm on a naïve dataset) would not be expected to perform as well. Nonetheless, we submit that the results of these early studies motivate larger upcoming prospective studies to assess the true potential for impact on the management of patient care for bacterial infections.
5. Conclusions
Infrared-absorption microscopy and machine-learning classification algorithms for pattern recognition have the potential for identifying one or more antibiotics to which an infectious bacterial species is sensitive with a high confidence level.We plan to expand the research and test the methods prospectively, to produce a large database, including other bacterial species, and to demonstrate the reliability of the method.
Acknowledgements
Financial support by SCE internal research funding is gratefully acknowledged.References
- H. C. Neu, Science, 1992, 257, 1064–1073 CAS.
- R. Daniels, Emerg. Nurse, 2012, 20, 11 Search PubMed.
- P. Coxeter, D. Looke, T. Hoffmann, J. Lowe and C. Del Mar, Aust. N. Z. J. Public Health, 2013, 37, 403–404 CrossRef PubMed.
- A. Shah, South Asian J. Cancer, 2013, 2, 3–4 CrossRef PubMed.
- C. Walsh, Nature, 2000, 406, 775–781 CrossRef CAS PubMed.
- M. N. Alekshun and S. B. Levy, Cell, 2007, 128, 1037–1050 CrossRef CAS PubMed.
- U. Gisi and Y. Cohen, Annu. Rev. Phytopathol., 1996, 34, 549–572 CrossRef CAS PubMed.
- D. M. Livermore, Ann. Med., 2003, 35, 226–234 CrossRef PubMed.
- N. Woodford, Clin. Microbiol. Infect., 2005, 11(Suppl 3), 2–21 CrossRef CAS PubMed.
- T. Gottlieb and G. R. Nimmo, Med. J. Aust., 2011, 194, 281–283 Search PubMed.
- O. Cars, L. D. Högberg, M. Murray, O. Nordberg, S. Sivaraman, C. S. Lundborg, A. D. So and G. Tomson, Meeting the challenge of antibiotic resistance, 2008 Search PubMed.
- H. M. Ericsson and J. C. Sherris, Acta Pathol. Microbiol. Scand., Sect. B: Microbiol. Immunol., 1971, 217(Suppl 217), 1–90 Search PubMed.
- A. Balows, Current techniques for antibiotic susceptibility testing, Charles C. Thomas, Springfield, IL, 1972 Search PubMed.
- J. H. Jorgensen and M. J. Ferraro, Clin. Infect. Dis, 2009, 49, 1749–1755 CrossRef CAS PubMed.
- J. H. Jorgensen, M. J. Ferraro, M. L. McElmeel, J. Spargo, J. M. Swenson and F. C. Tenover, J. Clin. Microbiol., 1994, 159–163 CAS.
- G. V. Doern, R. Vautour, M. Gaudet and B. Levy, J. Clin. Microbiol., 1994, 32, 1757–1762 CAS.
- M. A. Pfaller, Emerging Infect. Dis., 2001, 7, 312–318 CrossRef CAS PubMed.
- S. A. Sakallah, Biotechnol. Annu. Rev., 2000, 6, 141–161 CAS.
- N. Woodford and A. Sundsfjord, J. Antimicrob. Chemother., 2005, 56, 259–261 CrossRef CAS PubMed.
- L. Kong, P. Zhang, G. Wang, J. Yu, P. Setlow and Y. Q. Li, Nat. Protoc., 2011, 6, 625–639 CrossRef CAS PubMed.
- S. G. Kazarian and K. L. Chan, Analyst, 2013, 138, 1940–1951 RSC.
- J. Samelis, A. Bleicher, C. Delbes-Paus, A. Kakouri, K. Neuhaus and M. C. Montel, Food Microbiol., 2011, 28, 76–83 CrossRef CAS PubMed.
- D. Naumann, D. Helm and H. Labischinski, Nature, 1991, 351, 81–82 CrossRef CAS PubMed.
- E. Bogomolny, M. Huleihel, A. Salman, A. Zwielly, R. Moreh and S. Mordechai, Analyst, 2010, 135, 1934–1940 RSC.
- E. Bogomolny, M. Huleihel, Y. Suproun, R. K. Sahu and S. Mordechai, J. Biomed. Opt., 2007, 12, 024003 CrossRef PubMed.
- H. H. Mantsch and D. Chapman, Infrared Spectroscopy of Biomolecules, Wiley-Liss, New York, 1996 Search PubMed.
- J. O. Lay, Mass Spectrom. Rev., 2001, 20, 172–194 CrossRef CAS PubMed.
- J. Hrabak, E. Chudackova and R. Walkova, Clin. Microbiol. Rev., 2013, 26, 103–114 CrossRef CAS PubMed.
- K. Sparbier, S. Schubert, U. Weller, C. Boogen and M. Kostrzewa, J. Clin. Microbiol., 2012, 50, 927–937 CrossRef CAS PubMed.
- V. Edwards-Jones, M. A. Claydon, D. J. Evason, J. Walker, A. J. Fox and D. B. Gordon, J. Med. Microbiol., 2000, 49, 295–300 CrossRef CAS.
- P. A. Majcherczyk, T. McKenna, P. Moreillon and P. Vaudaux, FEMS Microbiol. Lett., 2006, 255, 233–239 CrossRef CAS PubMed.
- K. Bernardo, S. Fleer, N. Pakulat, O. Krut, F. Hunger and M. Kronke, Proteomics, 2002, 2, 740–746 CrossRef CAS PubMed.
- M. Wolters, H. Rohde, T. Maier, C. Belmar-Campos, G. Franke, S. Scherpe, M. Aepfelbacher and M. Christner, Int. J. Med. Microbiol., 2011, 301, 64–68 CrossRef CAS.
- R. K. Sahu, A. Salman, S. Mordechai and E. Manor, J. Biomed. Opt., 2013, 18, 115004 CrossRef PubMed.
- A. Salman, E. Shufan, L. Zeiri and M. Huleihel, Methods, 2014, 68, 364–370 CrossRef CAS PubMed.
- A. Salman, E. Shufan, L. Tsror, R. Moreh, S. Mordechai and M. Huleihel, Methods, 2014, 68, 325–330 CrossRef CAS PubMed.
- L. Chiriboga, H. Yee and M. Diem, Appl. Spectrosc., 2000, 54, 1–8 CrossRef CAS.
- P. T. Wong, R. K. Wong, T. A. Caputo, T. A. Godwin and B. Rigas, Proc. Natl. Acad. Sci. U. S. A., 1991, 88, 10988–10992 CrossRef CAS.
- S. Argov, J. Ramesh, A. Salman, I. Sinelnikov, J. Goldstein, H. Guterman and S. Mordechai, J. Biomed. Opt., 2002, 7, 248–254 CrossRef PubMed.
- A. Salman, S. Argov, J. Ramesh, J. Goldstein, I. Sinelnikov, H. Guterman and S. Mordechai, Cell. Mol. Biol., 2001, 47, OL159–OL166 CAS , online pub.
- A. Salman, V. Erukhimovitch, M. Talyshinsky, M. Huleihil and M. Huleihel, Biopolymers, 2002, 67, 406–412 CrossRef CAS.
- E. Bogomolny, S. Mordechai, A. Zwielly and M. Huleihel, Eur. Biophys. J., 2009, 38, 971–980 CrossRef CAS PubMed.
- Infrared and raman spectroscopy of biological materials, ed. H.-U. Gremlich and B. Yang, Marcel Dekker, New York, 2000 Search PubMed.
- A. Zwielly, S. Mordechai, I. Sinielnikov, A. Salman, E. Bogomolny and S. Argov, Med. Phys., 2010, 37, 1047–1055 CrossRef CAS PubMed.
- M. M. Mariani, L. J. Maccoux, C. Matthaus, M. Diem, J. G. Hengstler and V. Deckert, Anal. Chem., 2010, 82, 4259–4263 CrossRef CAS PubMed.
- A. Pomerantz, Y. Cohen, E. Shufan, Y. Ben-Naim, S. Mordechai, A. Salman and M. Huleihel, J. Photochem. Photobiol., B, 2014, 141, 308–314 CrossRef CAS PubMed.
- A. Salman, E. Shufan, I. Lapidot, L. Tsror, R. Moreh, S. Mordechai and M. Huleihel, Analyst, 2015, 140, 3098–3106 RSC.
- A. Salman, E. Shufan, R. K. Sahu, S. Mordechai and G. Sebbag, Vib. Spectrosc., 2016, 83, 17–25 CrossRef CAS.
- A. Salman, E. Shufan, L. Zeiri and M. Huleihel, Biochim. Biophys. Acta, 2013, 1830, 2720–2727 CrossRef CAS.
- S. Mordechai, E. Shufan, B. S. Porat Katz and A. Salman, Analyst, 2017, 142, 1276–1284 RSC.
- E. Rodriguez-Diaz, Q. Huang, S. R. Cerda, M. J. O'Brien, I. J. Bigio and S. K. Singh, Gastrointest. Endosc., 2015, 81, 539–547 CrossRef.
- P. Pudil, J. Novovicová and J. Kittler, Pattern Recognit. Lett., 1994, 15, 1119–1125 CrossRef.
- C. Cortes and V. Vapnik, Mach. Learn., 1995, 20, 273–297 Search PubMed.
- V. N. Vapnik, Statistical learning theory, John Wiley & Sons, New York, 1998 Search PubMed.
- Z. Movasaghi, S. Rehman and D. I. ur Rehman, Appl. Spectrosc. Rev., 2008, 43, 134–179 CrossRef CAS.
- G. Kos, H. Lohninger and R. Krska, Anal. Chem., 2003, 75, 1211–1217 CrossRef CAS.
- R. K. Dukor, in Handbook of Vibrational Spectroscopy, John Wiley & Sons, Ltd, 2006 Search PubMed.
- K. Gajjar, J. Trevisan, G. Owens, P. J. Keating, N. J. Wood, H. F. Stringfellow, P. L. Martin-Hirsch and F. L. Martin, Analyst, 2013, 138, 3917–3926 RSC.
- M. Beekes, P. Lasch and D. Naumann, Vet. Microbiol., 2007, 123, 305–319 CrossRef CAS PubMed.
- I. W. Levin and R. Bhargava, Annu. Rev. Phys. Chem., 2005, 56, 429–474 CrossRef CAS PubMed.
- E. Rodriguez-Diaz, D. A. Castanon, S. K. Singh and I. J. Bigio, J. Biomed. Opt., 2011, 16, 067009 CrossRef PubMed.
| This journal is © The Royal Society of Chemistry 2017 |

