DOI:
10.1039/C6AN01506A
(Paper)
Analyst, 2017,
142, 110-117
Role of micropillar arrays in cell rolling dynamics†
Received
3rd July 2016
, Accepted 23rd October 2016
First published on 24th October 2016
Abstract
In this study, we present a role of arrayed micropillar structures in cell rolling dynamics. Cell rolling on a ligand coated surface as a means of cell separation was demonstrated using a micropillar-integrated microfluidic channel. This approach allows the separation of cells according to characteristic surface properties, regardless of cell size. In these experiments, different moving trajectories of the cells between a ligand-coated micropost structure and a 1% BSA coated micropost structure were observed using sequential images. Based on the analysis of the angle of travel of cells in the trajectory, the average angles of travel on the ligand-coated microposts were 1.5° and −3.1° on a 1% BSA-coated micropost structure. The overall force equivalent applied to a cell can be analyzed to predict the cell rolling dynamics when a cell is detached. These results show that it will be possible to design chip geometry for delicate operations and to separate target cells. Furthermore, we believe that these control techniques based on a ligand coated micropillar surface can be used for enhancing cell rolling-based separation in a faster and more continuous manner.
Introduction
Numerous cell sorting methods have been recently developed for various applications.1–6 These methods use various discriminating parameters, such as fluorescence, cell size and the cell surface properties. However, cell sorting techniques using these parameters have several limitations with respect to cell separation.7 For instance, fluorescence labeling techniques have annoying steps, such as sample preparation steps before the assay and the need to remove labeling materials after the assay. Label-free cell separation methods, like the cell size based technique, do not require these additional steps. However, the cell size based technique has the limitation that it is impossible to separate size-overlapped cells. To overcome these limitations, a novel cell sorting technique based on cell rolling has been developed.8,9 Cell rolling is a characteristic phenomenon that occurs as a result of interactions between surface affinities caused by cell receptor–surface ligand bonding and shear fluid flow. Regardless of the cell size, this approach can separate cells using only characteristic surface properties. Consequently, this approach is useful for discriminating blood cell lines or stem cell lines. Also, many studies using leukocytes,10 CD34+ bone marrow cells11 and mesenchymal stem cells (MSCs)12 have been conducted using this method. However, it is difficult to observe interactions between cells and the ligand-coated wall in previously developed assays. There has been a need to develop methods that are more time efficient by reducing the length of time the cell and the wall interact.
In this study, we describe a combinational cell sorting method in which cell trajectories are shifted in a micropillar-integrated microfluidic channel, as shown in Fig. 1a. Based on numerical analysis results of our proposed microfluidic chip, the trajectories of the particles demonstrated that non-target cells do not interact with the microposts, because of the hydrodynamic force exerted on the gap between microposts. Using these design parameters, an analysis of the force of cell rolling was conducted in a microfluidic environment. A microfluidic chip was coated with an HL-60 cell ligand, recombinant human P-selectin, as a positive control and a second device was coated with 1% BSA (bovine serum albumin) as a negative control. We anticipated that the HL-60 cells in the ligand-coated microposts and in the 1% BSA coated microfluidic channel would have different trajectories and we were able to verify this. Also, using sequential images, we analyzed the average trajectory angle of cells and the cell rolling effect in a micropillar array.
 |
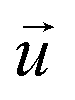
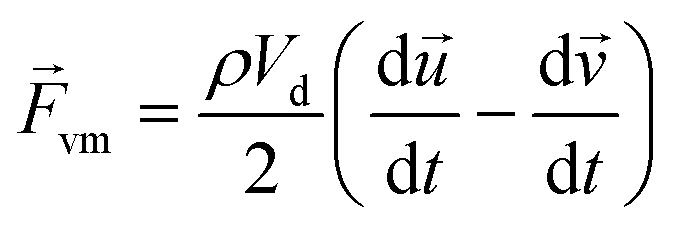
| | Fig. 1 Combined cell sorting method using a microfluidic channel integrated with micropillars to shift cell trajectories. (a) Schematic of the proposed cell sorting design by cell rolling (G: the gap between the posts, d: the relative shift between the adjacent post rows, λ: spacing (center to center) between the posts). (b) Illustration of a cell rolling, the cell rolls under linear shear flow on the ligands. (c) Simulated velocity fields on xy cross-sections. (d) Particle traces of the proposed cell separation system. (e) Velocity vectors between micropillars. | |
Model description
Design of a micropillar-integrated microfluidic channel.
The Austin group developed a method for cell separation using micropillars.13 In this method, the direction of the microfluid is controlled by a micropillar array in the microfluidic channel. The size and width of the micropillar array affects the direction of the particles in fluidics. Particles with sizes smaller than a critical hydrodynamic diameter, Dc, which predicts the separation of particles, flow along a stream line. But oversized particles bump into the micropillars and are transported through a configuration of micropillars. There are two factors which adjust the displacement of these particles. One is the width of each micropillar, λ, and the other is the space between the lines, d = ελ, as shown in Fig. 1a. The spacing factor, ε, is the coefficient defining the space between the lines of the micropillar array, and affects the critical hydrodynamic diameter. Based on the work of Inglis et al.14Dc determines the direction of the particle and is determined by the formula below:| | 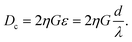 | (1) |
In this formula, η is the variable used to correct the non-uniform profile of the fluid formed by the micropillar. Also, η depends on the spacing factor, ε, and specific η value is acquired using the graph by assuming a parabolic flow profile.14 Based on the formula, Dc has to be greater than 11 μm since the target HL-60 cell which we want to separate has a 10 to 11 μm diameter. However, when the Dc value increases, the target cell will be able to flow along the pathway intended for non-target cells. Consequently, we set an 11 μm for Dc. The G factor, the width between micropillars, was set as twice the target cell diameter, 20 μm, in order to prevent blocking of cells by the micropillar. We then calculated the shift value, ‘d’, between the micropillar array lines. As a result, d was 5 μm when G was 20 μm and, naturally, λ becomes 40 μm.
Theory for the prediction of microparticle flow in the microchannel.
The interacting forces between particles and fluid such as drag, virtual mass, and Saffman and Magnus lift forces are considered in tracking the trajectories of particles, and brief descriptions are described in the following sections. The trajectories of particles are estimated using eqn (2).| | 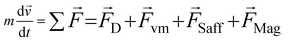 | (2) |
where m represents the particle mass.
When there is a difference in velocity between fluid and a particle, the drag force acts on the particle to decrease it. The drag force is a function of the fluid density, ρ, fluid velocity,  , particle velocity,
  , the frontal area of the particle, A, as well as the drag coefficient CD which depends on the particle Reynolds number, as shown in eqn (3). The particle Reynolds number is defined as
  , where D and μ represent the particle diameter and dynamic viscosity of the fluid.
| | 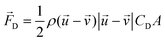 | (3) |
When a particle accelerates in fluid, the fluid accelerated in the opposite direction by reaction. The corresponding force is called the virtual mass force as shown in eqn (4).
| | 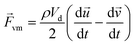 | (4) |
where
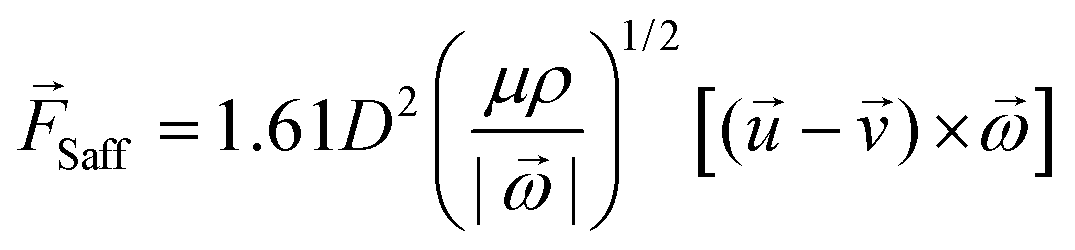
Vd is the volume of the particle. The velocity gradient in the flow field rotates a particle to result in the relative velocity difference across the particle between the particle and fluid in the direction of the gradient, which causes the pressure difference in the same direction. The force due to the pressure difference is called Saffman lift force and it moves the particle normal to the flow direction.
| | 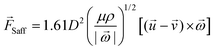 | (5) |
where

is the rotational velocity vector. The particle could either rise up or sink down depending on the angle between the relative velocity and the rotational velocity vector.
The pressure difference across a particle could arise due to the particle rotation caused by external forces other than the velocity gradient, and the resulting force is called the Magnus lift force as shown in eqn (6).
| | 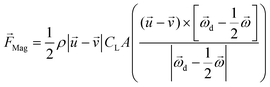 | (6) |
where

is the rotational velocity vector of the particle, and
CL is the lift coefficient due to rotation and is a function of the spin rate defined as

.
Interaction of cell rolling.
In a shear increased viscosity fluid profile, the torque caused by the interaction of the cell surface affinity and the shear force makes the cell roll; this phenomenon is called “cell rolling” and is shown in Fig. 1b. In 2008, Rohit Karnik et al. reported a method for separating cells using this principle.15 Having a ligand coating at an angle between 5–10° makes that the target cells flow in the direction of the ligand coating, while the rest of the cells flow away in the fluid. Also, a numerical method has been reported in which the calculation of the receptor–ligand binding force predicts the amount required to induce cell rolling.16 This paper provided a comparison of the efficiency of cell attachment using both experimental and simulation data, and reported that cell attachment occurred in three states; the ligand attached state, the rolling state, and the free movement state. Now it is possible to simulate the required ligand concentration and the amount of fluidic forces for cell rolling. Moreover, the study conducted by Bose et al. described the parameters of the forces applied to the cell in the rolling state in greater detail.17 Based on the formula below, the cortical tension, Tc, affecting the binding force is influenced by complex parameters. In addition, parameters, like microvillus spring constant, are difficult to measure directly.| | | Fbinding = f(R,Tc,Ac), | (7) |
| | | Tc = f(Kc,r,NL,Nm,Am,l), | (8) |
where R is the cell radius, Tc is the cortical tension, Ac is the contact area, r = the contact length (contact radius), Kc is the microvillus spring constant, NL is the ligand density on substrate, Nm is the microvillus density on a cell, Am be the area of microvillus tip, and l is the extension of microvillus.
However, the study by Lomakina et al. showed that the cortical tension is predictable using the reaction force from the substrate, Freac.18 The formula is shown below:
| |  | (9) |
Based on the idea, the shear force which affects a cell rolling can be optimized according to the application. In our model, since the shear force can affect a stream line position of non-target cells, the shear force can be optimized with the angle of the pillar post array. Also, the receptor–ligand binding force affects the efficiency of cell attachment and the displacement of cells. This binding force can be varied dynamically by the deformation of the cell.19 To observe the effect of each parameter, we conducted experiments in a controlled manner of external flow field and cell-post interaction.
Materials and methods
Numerical analysis
Prediction of the velocity of the fluid using numerical analysis.
The fluid flow and particle trajectories are simulated using the commercial computational fluid dynamics package, Fluent 6.3 (Ansys, USA), and the grids are prepared by the pre-processor, Gambit 2.6 (Ansys, USA) considering the array of micropillars, inlet, exit and the channel depth, 40 μm as shown in ESI Fig. S1.† Grid points are clustered near the wall region to resolve the boundary layer and particle trajectories well, and the overall grids are refined enough not to show the grid dependence of the solution. Velocity inlet boundary conditions (u = 1.5 m s−1) were imposed for buffer flow and the particle-laden flow inlets, while pressure outlet conditions (p = 0 Pa) were applied for the exits. No slip condition was enforced for walls. In this experiment, cells were diluted to 105 cells per ml in a DPBS, and as the solution had the same properties as water including density and viscosity due to the low concentration of cells, water was selected as the working fluid in the simulation. The flow regime was identified to be laminar based on the Reynolds number, and the implicit pressure-based solver was selected for use.
Fig. 1c and d show the contour and vector plot of velocity in the microchannel respectively, where the fluid seems to prefer to flow along a slanted direction along the array of posts, and the fluid between posts in the slanted direction tends to flow downwards (+x, −y). To predict an appropriate flow rate for cell rolling on the micropost, three parameters which are shear stress, the location of average velocity and fluid viscosity should be calculated for the flow rate. In a previous study, rolling of a model cell, HL-60, was stably achieved at 2.5 to 3.5 dyne per cm2 shear force on P-selectin coated areas.8 Also, as shown in Fig. 1d, the shape of the fluid profile is roughly parabolic between the microposts. This indicates that the position of average velocity is located about one half and half the gap of the microposts. The velocity of fluid, v, is 0.00138 m s−1 can be calculated with the conditions of three flow parameters where the shear force substitutes 3 dyn cm−2, the position of average velocity is 5 μm, and the fluid viscosity of buffer, μ, is 0.00108 kg m−1 s−1. Multiplication of the velocity and area results in the amount of flow, 0.06624 μL min−1.
Particle pathway analysis using numerical model
The trajectories of non-target cells were calculated using the Lagrangian particle tracking method in Fluent 6.3 assuming one-way coupling between the particle and fluid flow, which presumes that fluid flow affects particle motion but not the other way around. The proposed model reflects the design factor of deterministic lateral displacement, so the effect influenced by the cell may be negligible.
Furthermore, the solution was assumed to be dilute so that the effect of collision between particles was neglected. Using the velocity field obtained, the trajectories of particles with 10 μm in diameter and the same density of blood cells, 1058 kg m−3, released at the center port of the inlets were traced as shown in Fig. 1c. The released particles were spread over the array of posts at the expansion of the port, and they moved down (−y) as they crossed the array of posts due to the velocity field profile.
Using the above described conditions, Fig. 1e shows particle trajectories and separation paths. Particles from the inlet spread into the system uniformly and passed by the micropillars. Most of the particles moved in the right lower direction (+x, −y) and exited through the outlet. To confirm the vector of velocity, we observe the direction of fluid flow expressed by the vectors. As shown in Fig. 1e, the vertical space between the micropillars made the fluid flow in the right direction (x-axis), but the fluid went down. Thus, non-target cells followed the direction of the fluid (+x, −y).
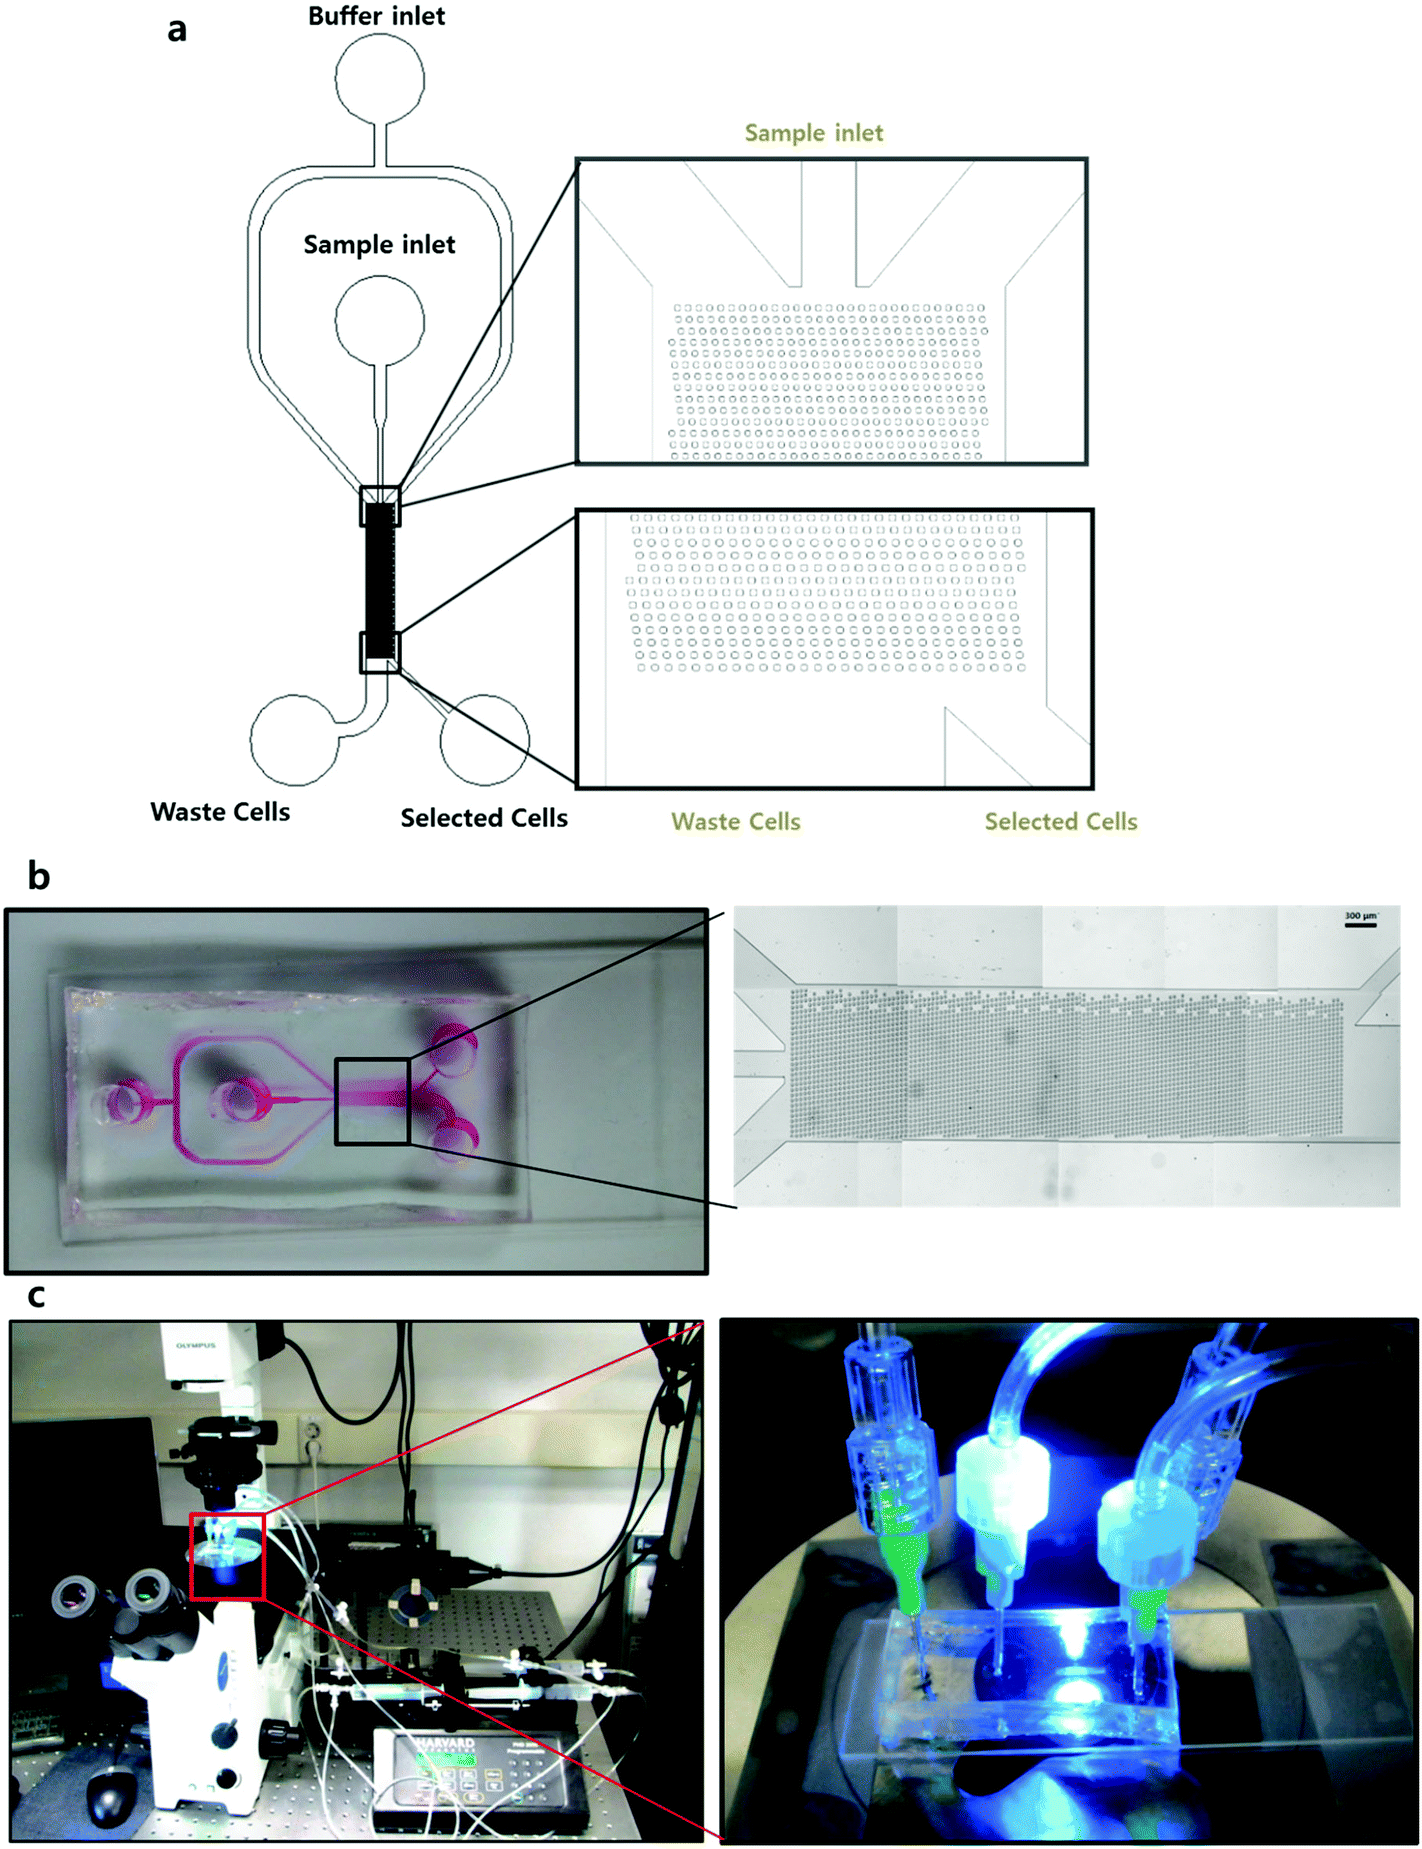
Microfluidic chip fabrication
The designed microfluidic chip was constructed with polydimethylsiloxane (PDMS) using a soft lithography method. The computer-aided design (CAD) print was used to make a photo mask as shown in Fig. 2a, and a photo resister coated 4′′ Si wafer was used as a master mold. To fabricate the PDMS chip, the well mixed PDMS soluble material was poured onto the Si wafer and baked in a 90 °C oven for 40 minutes. After the detachment of PDMS, 2 mm diameter holes were punched to make two inlets for the sample and buffer, and two outlets for non-target cells and target cells. The final PDMS chip was attached to a slide glass using an oxidized plasma device. The image of Fig. 2b shows the stitched images obtained using microscopy and the overall scheme of the microfluidic chip. This image demonstrates that at an aspect ratio of 1![[thin space (1/6-em)]](https://www.rsc.org/images/entities/char_2009.gif) :2, the micropillars are aligned and configured without bending on the chip.
:2, the micropillars are aligned and configured without bending on the chip.
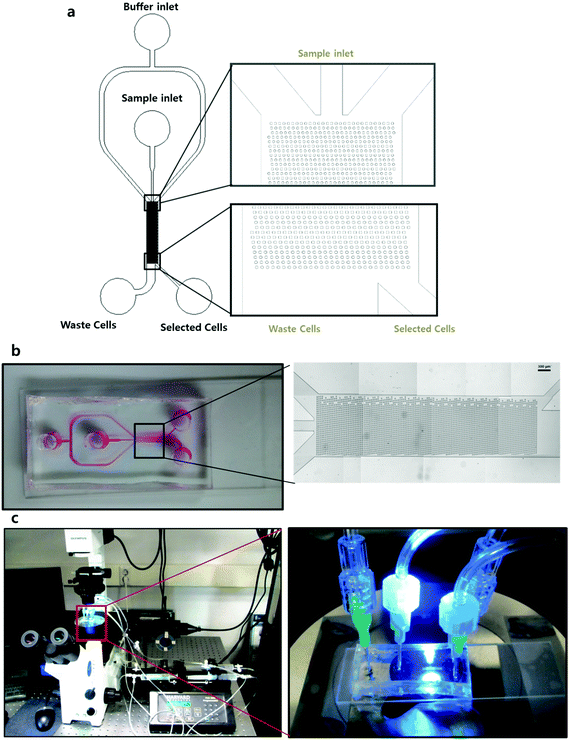 |
| | Fig. 2 Microfluidic chip fabrication and experimental setup. (a) CAD drawing of the cell separation system with integrated microposts. (b) Chip fabricated using soft lithography and the overall images of the fabricated microfluidic chip integrated with microposts. (c) Overall experimental setup for cell separation in micropost integrated microchannel and blunt-ended needle connecting the microchip and tube. | |
During these processes, a bending phenomenon can occur on the micropillars, as shown in ESI Fig. S2a.† There are two main reasons why bending occurs. First, when the PDMS chip mold is peeled from the Si wafer, the shear force can be exerted on the micropillars. However, this problem can be solved by relocating the structure of the PDMS chip to face upward when cutting a PDMS chip. Second, when a PDMS chip is attached to the slide, pressure is exerted on the micropillar patterned area. For this reason, during the process of sticking the PDMS chip onto the slide, pressure should be applied to the area where the pattern does not exist.
Ligand coating
The target HL-60 cell ligand, recombinant human P-selectin/CD62P, was purchased from R&D Systems (Minnesota, USA). The concentration of P-selectin used was 1.5 μg mL−1, based on previous representative research.8 Also, many studies were successfully conducted in the closed and open systems by using this condition.9,15,20 The P-selectin solution was injected into the completed PDMS chip using an injection pump, and the chip was incubated at room temperature for three hours. After that, the P-selectin injected chip and a negative control group were washed with 1% BSA (bovine serum albumin). When 1% BSA is injected into the chip, the materials suspended in the solution will accumulate at the entrance of the channel inlet as shown in ESI Fig. S2b.† Because the 1% BSA solution contains a number of floating substances, the 1% BSA was filtered through a porous cellulose equipped steric cup to eliminate the materials suspended in the fluid.21 Using this procedure, we were able to minimize the number of floating materials and prevent blockage of the inlet.
Cell preparation
Since, the rolling mechanism of HL-60 as a suspension cell line is well-defined in many studies,22–24 we used this cell line for the reliable experiment. The target HL-60 cells (a human WBC cell line) were purchased from the Korean cell line bank (Seoul, Korea). The medium was composed of a mixture of RPMI 1640 (with L-glutamine, 25 mM HEPES), 10% FBS (fetal bovine serum) and 1% penicillin–streptomycin (penicillin–streptomycin, P/S). HL-60 cells were incubated in this medium at 37 °C and in 5% CO2. After three days, cells were divided at a 1:3 ratio. The cell passage number was between 5 and 20. Cells were centrifuged at 1300 rpm (246g) for 5 min, and diluted in DPBS to achieve a cell concentration of between 105 and 106 cells mL−1. The average diameter of HL-60 cells using Image J was 10.678 μm (ESI Fig. S3†).
Experimental procedure
After ligand coating on the chip and cell preparation, four 20 mL syringes (the buffer and cell loaded syringes, and two empty syringes for the discrimination of the selected and waste cells) were mounted on the PHD2000 injection pump (Harvard Apparatus, USA). Additionally, the ligand coated chip was placed on the observation instruments, which included an IX71 inverted fluorescence microscope (Olympus, Japan) and a CCD camera (Zeiss, Germany), to allow for the observation of cell movement. Subsequently, the fluid flow of cells and the buffer solution were injected at 72 μL min−1 into the chip through the injection pump. A negative control group was also used in an equivalent experiment.
Image analysis of the cell rolling pathway
To observe the path of a sample cell, we captured 14 frames over 7 seconds. To acquire the average angle of the cell trajectories, we captured serial pictures with a 0.2 second interval (ESI Fig. S4†). 100 pictures were taken over 20 seconds and analyzed using the MTrack J (Image J) freeware to establish the pathway taken by the cells.
Results and discussion
Analytical results on the effect of the arrayed geometry of micropillars on cell rolling and separation
1% BSA coated micropillars.
When the bare PDMS microfluidic chip is used without any surface passivation, even the non-target cells could interact with the chip walls and micropillars because of the hydrophobicity of PDMS that can make nonspecific adhesion.10,25 To prevent this phenomenon, we coated the microfluidic chip with 1% BSA which blocks the specific interaction and observed the path of the HL-60 cells. Fig. 3a shows the trajectory of the non-target cells which have no surface interaction. Once cells flow in from the left inlet, cells move to in a right lower direction (+x, −y). This picture was merged with the images of the cell path at regular intervals. Additionally, we observed that the moving angle of a sample cell was −9.47°. At the indicated region, *, in Fig. 3a, the distance intervals between cells were very close. This means that the velocity of cells was slow. The reason why cells move slowly is similar to that in the simulation result presented in Fig. 1d, where the velocity of the fluid between micropillars was decreased.
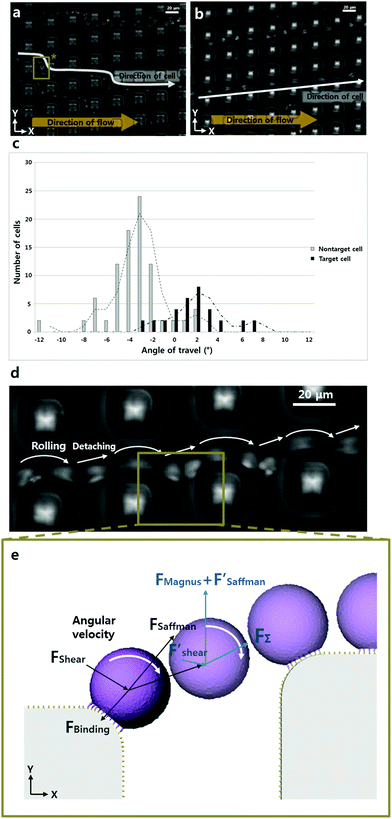 |
| | Fig. 3 Cell rolling and separation are affected by the arrayed geometry of the micropillars. (a) Overlay image showing the direction of HL-60 cell movement in 1% BSA-coated channels. (b) Overlay image showing the direction of HL-60 cell movement in P-selectin-coated channels (a total of 14 frames captured over 7 seconds with a 20× objective lens). (c) Trajectories of the HL60 cells in P-selectin-coated channels. (d) Overlay image showing the rolling dynamics of HL-60 cells (a total of 12 frames captured over 3 seconds with a 40× objective lens), (e) schematic illustration showing the rolling dynamics of an HL-60 cell. The direction of forces is estimated by velocity vectors. | |
Ligand-coated micropillars.
To observe the path of the target cells we wanted to separate, a P-selectin solution was used to coat the channel walls and micropillars to induce an attachment between the channel wall and cells. Afterward, we checked the path of HL-60 cells through the same manner as described above. As shown in Fig. 3b, most cells entered from the left side and flowed toward the upper right direction with a +5.97° moving angle. This finding differed from the result obtained in the negative control experiment using micropillars coated with only 1% BSA. To investigate the principle more closely, we observed the trajectory of HL-60 cells using additional frames (12 frames within 3 s). Fig. 3d shows that a cell is rolling with repeated attachments to a micropillar and detachments at the corner of the micropillar. As this process is repeated, cells move along the configuration of micropillars.
Analysis of cell paths using the micropillar separation system.
To obtain the average angle of the cell trajectories, one hundred pictures captured over 20 seconds were analyzed using MTrack J freeware. ESI Fig. S4a† depicts the result of the analysis of the cell paths in a 1% BSA coated microfluidic channel. After injection of the HL60 cells from the left side, most cells moved to the right center (+x) or to the lower right side (+x, −y). This is similar to the simulation result we obtained for particle trajectories and fluid vectors between micropillars. ESI Fig. S4b† shows the analysis of the cell paths in a P-selectin coated microfluidic channel. Most cells flowed from the left side to the upper right side (+x, +y). In most cases, cells followed the direction of the micropillar arrangement. In the comparison chart of the path differences shown in Fig. 3c, the measurement result indicates that the angle of the trajectory has an average value of +1.5° in the ligand coated microfluidic channel and of −3.1° in the non-coated channel. This indicates that the cell rolling effect enables a shift in the path of the cells.
Analysis of cell rolling.
Cells that detached from the micropillars had different degrees of rolling caused by external forces and the velocity of the fluid. So, to elevate the efficiency of cell separation, we needed to analyze the cell rolling effect. A previous paper had already shown the optimized shear force for HL-60 cell rolling.9 However, our system needed to be analyzed in a different manner because the attachment and detachment are repeated. In order to predict the movement of cells due to cell rolling, we analyzed the forces on a cell when a cell is detached, as shown in Fig. 3e. Three forces are applied to a cell before detachment. One is the shear force exerted by the fluid. Another is the binding force between P-selectin and the cell surface. The last is the Saffman lift force exerted in the vertical direction of the wall. Among these forces, shear force and binding force mainly affect the cell rolling effect.9 Also, this effect changes the contact length of a cell with a micropillar by moving the cell to the micropost corner. The contact length between a cell and a micropillar is relatively long on the flat side of the micropillar, but the binding area gets smaller because the corner is round. When the value of the Saffman lift force is bigger than the value of the binding force which is altered by the contact length, cell detachment from a micropillar occurs. Therefore, we can express the contact length, r, when a cell is detached.| |  | (10) |
After detachment, a cell is affected by the Magnus lift force according to the angular velocity, Saffman lift force and shear force. Since the influence of the Saffman lift force decreases when a cell is away from the wall, it becomes insignificant. Based on the simulation result shown in Fig. 1d, the direction of the shear force is towards the lower right side (+x, −y) at the location between the micropillars. So, the Magnus lift force and Saffman lift force are together larger than the shear force and the cell moves to the upper right side (+x, +y). We can express the minimum value of the fluid velocity, if we divide the y axis value of the shear force.
where,
B is a decoupling factor of shear stress, and it can be derived by numerical analysis.
| |  | (12) |
Moreover, through displacement observation of rolling cells in the P-selectin coated microfluidic channel shown in Fig. 3b and d, we identified the velocity of cell rolling as ∼50 μm s−1. This result indicates that this microfluidic chip is more efficient in the speed aspect than in the previous research.9 That is because our method uses a smaller contact length with the cell ligand than the contact length used in other methods.
Conclusions
In summary, we developed a modified cell separation method using the cell rolling effect in a micropillar integrated microfluidic channel. This method is a useful approach to distinguish different cells of the same size using differences in cell surface characteristics. Before performing the experiment, we conducted a simulation to validate the proposed microfluidic chip. By predicting the fluid velocity and the particle path, we found that when a hydrodynamic force was applied the non-target cells moved toward the waste outlet. After coating the device with a ligand or 1% BSA, the HL-60 cell trajectories after injection into the fabricated PDMS chip which has two different surface conditions, revealed that the cell trajectories in the P-selectin coated micropillars and 1% BSA micropillars had different path angles. In particular, in the P-selectin coated microposts, we observed that cells move along the array of micropillars by repeated detachment and attachment to the micropillars. Additionally, we analyzed this phenomenon through the analysis of the forces applied on a single cell. Using this analysis, we obtained the contact length when a cell surface interaction is broken and the minimum value of fluid velocity is required to overcome shear stress at the location between the micropillars. We believe that our proposed design using the cell rolling effect and our analysis will contribute to research on cell manipulation techniques in biology. Furthermore, this model will be potentially useful for biomedical applications such as cell-based therapy, point-of-care testing and cell sorting techniques in research laboratories.
Acknowledgements
This study was supported by a grant of the Korean Health Technology R&D Project, Ministry of Health & Welfare, Republic of Korea (HI14C1632, HI15C1027). This research was also supported by the National Research Foundation of Korea (NRF-2016R1A1A1A05005348).
Notes and references
- H. Yun, K. Kim and W. G. Lee, Cell manipulation in microfluidics, Biofabrication, 2013, 5(2), 022001 CrossRef PubMed.
- C. W. Shields, C. D. Reyes and G. P. Lopez, Microfluidic cell sorting: a review of the advances in the separation of cells from debulking to rare cell isolation, Lab Chip, 2015, 15(5), 1230–1249 RSC.
- E. L. Jackson and H. Lu, Advances in microfluidic cell separation and manipulation, Curr. Opin. Chem. Eng., 2013, 2(4), 398–404 CrossRef PubMed.
- J. Chen, J. Li and Y. Sun, Microfluidic approaches for cancer cell detection, characterization, and separation, Lab Chip, 2012, 12(10), 1753–1767 RSC.
- P. Sajeesh and A. K. Sen, Particle separation and sorting in microfluidic devices: a review, Microfluid. Nanofluid., 2014, 17(1), 1–52 CrossRef.
- M. Ohlin,
et al., Temperature-controlled MPa-pressure ultrasonic cell manipulation in a microfluidic chip, Lab Chip, 2015, 15(16), 3341–3349 RSC.
- W. Zhao,
et al., Label-Free Microfluidic Manipulation of Particles and Cells in Magnetic Liquids, Adv. Funct. Mater., 2016, 26(22), 3916–3932 CrossRef.
- S. Choi, J. M. Karp and R. Karnik, Cell sorting by deterministic cell rolling, Lab Chip, 2012, 12(8), 1427–1430 RSC.
- S. Choi,
et al., A cell rolling cytometer reveals the correlation between mesenchymal stem cell dynamic adhesion and differentiation state, Lab Chip, 2014, 14(1), 161–166 RSC.
- S. Hong,
et al., Covalent immobilization of p-selectin enhances cell rolling, Langmuir, 2007, 23(24), 12261–12268 CrossRef PubMed.
- A. W. Greenberg and D. A. Hammer, Cell separation mediated by differential rolling adhesion, Biotechnol. Bioeng., 2001, 73(2), 111–124 CrossRef PubMed.
- T. Yamaoka and A. Mahara, Cell rolling column in purification and differentiation analysis of stem cells, React. Funct. Polym., 2011, 71(3), 362–366 CrossRef.
- J. A. Davis,
et al., Deterministic hydrodynamics: Taking blood apart, Proc. Natl. Acad. Sci. U. S. A., 2006, 103(40), 14779–14784 CrossRef PubMed.
- D. W. Inglis,
et al., Critical particle size for fractionation by deterministic lateral displacement, Lab Chip, 2006, 6(5), 655–658 RSC.
- R. Karnik,
et al., Nanomechanical control of cell rolling in two dimensions through surface patterning of receptors, Nano Lett., 2008, 8(4), 1153–1158 CrossRef PubMed.
- X. J. Zheng,
et al., Cell receptor and surface ligand density effects on dynamic states of adhering circulating tumor cells, Lab Chip, 2011, 11(20), 3431–3439 RSC.
- S. Bose,
et al., A Semianalytical Model to Study the Effect of Cortical Tension on Cell Rolling, Biophys. J., 2010, 99(12), 3870–3879 CrossRef PubMed.
- E. B. Lomakina,
et al., Rheological analysis and measurement of neutrophil indentation, Biophys. J., 2004, 87(6), 4246–4258 CrossRef PubMed.
- Z. Y. Luo,
et al., Two-dimensional numerical study of flow dynamics of a nucleated cell tethered under shear flow, Chem. Eng. Sci., 2014, 119, 236–244 CrossRef.
- C. H. Lee,
et al., Examining the lateral displacement of HL60 cells rolling on asymmetric P-selectin patterns, Langmuir, 2011, 27(1), 240–249 CrossRef PubMed.
- X. Cui,
et al., A volumetric meter chip for point-of-care quantitative detection of bovine catalase for food safety control, Anal. Chim. Acta, 2016, 935, 207–212 CrossRef PubMed.
- L. Wu,
et al., Impact of carrier stiffness and microtopology on two-dimensional kinetics of P-selectin and P-selectin glycoprotein ligand-1 (PSGL-1) interactions, J. Biol. Chem., 2007, 282(13), 9846–9854 CrossRef PubMed.
- W. C. Chang, L. P. Lee and D. Liepmann, Biomimetic technique for adhesion-based collection and separation of cells in a microfluidic channel, Lab Chip, 2005, 5(1), 64–73 RSC.
- C. Dong and X. X. Lei, Biomechanics of cell rolling: shear flow, cell-surface adhesion, and cell deformability, J. Biomech., 2000, 33(1), 35–43 CrossRef PubMed.
- I. Wong and C. M. Ho, Surface molecular property modifications
for poly(dimethylsiloxane) (PDMS) based microfluidic devices, Microfluid. Nanofluid., 2009, 7(3), 291–306 CrossRef PubMed.
Footnote |
| † Electronic supplementary information (ESI) available. See DOI: 10.1039/c6an01506a |
|
| This journal is © The Royal Society of Chemistry 2017 |
Click here to see how this site uses Cookies. View our privacy policy here. 
 Open Access Article
 This Open Access Article is licensed under a Creative Commons Attribution-Non Commercial 3.0 Unported Licence
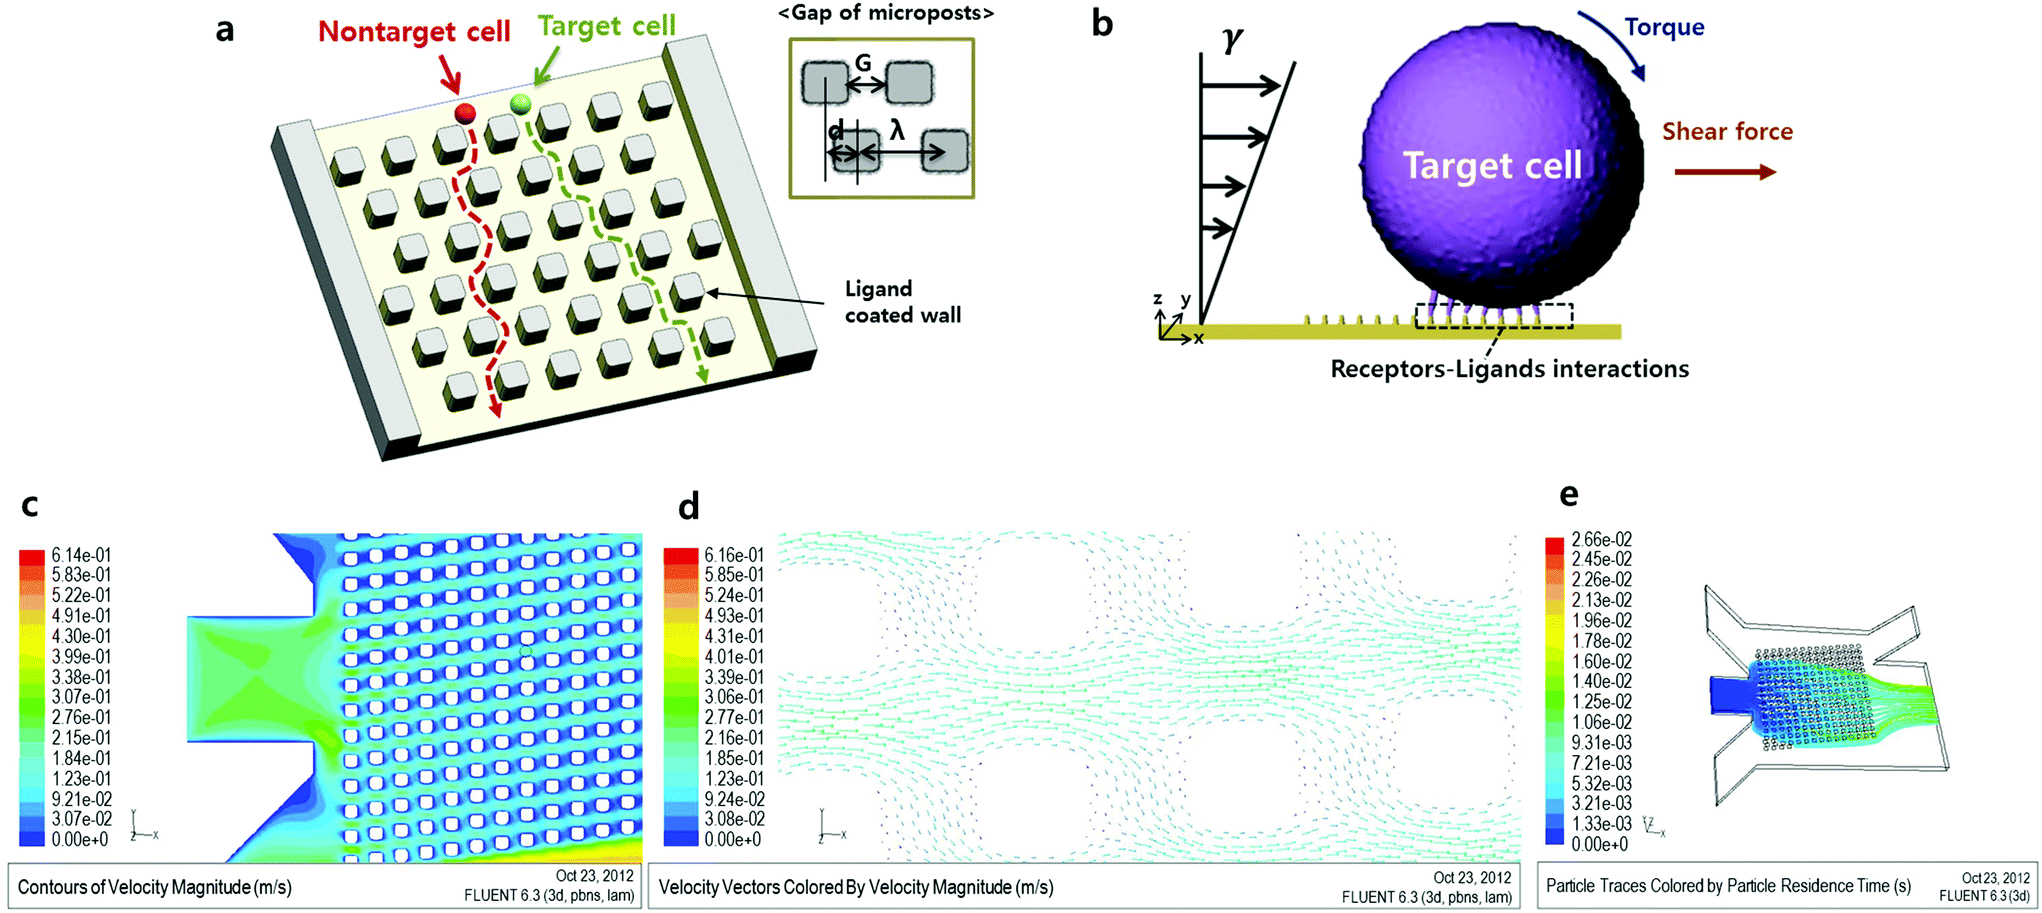


 , particle velocity,
 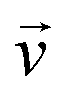 , the frontal area of the particle, A, as well as the drag coefficient CD which depends on the particle Reynolds number, as shown in eqn (3). The particle Reynolds number is defined as
  , where D and μ represent the particle diameter and dynamic viscosity of the fluid.
 is the rotational velocity vector. The particle could either rise up or sink down depending on the angle between the relative velocity and the rotational velocity vector.

 is the rotational velocity vector of the particle, and CL is the lift coefficient due to rotation and is a function of the spin rate defined as
  .
.