DOI:
10.1039/C7RA07066G
(Paper)
RSC Adv., 2017,
7, 39480-39489
Extracting the inner wall from nested double-walled carbon nanotube by platinum nanowire: molecular dynamics simulations
Received
26th June 2017
, Accepted 6th August 2017
First published on 14th August 2017
Abstract
The sliding behavior of interwalls between double-walled carbon nanotubes (DWCNTs) is studied by molecular dynamics (MD) simulations. The results show that a platinum (Pt) nanowire (NW) is able to push out a single wall from the DWCNT. The pushout process is strongly dependent on the match level of the NW radius and the inner wall CNT radius. The match radius of the Pt NW and the inner CNT wall will form perfect single-walled CNT (SWCNT) and Pt/CNT core/shell nanostructure. In addition, the bonding interactions between the Pt NW and the CNT are also studied. The shear stress between the Pt NW and CNT is in megapascal magnitude. The chirality has little effect on the interfacial bonding and the shear stress between the Pt NW and the CNT. This study will shed light on the understanding of the lubrication mechanism of the multi-walled CNT and the metal NWs in realistic situations.
Introduction
Multi-walled carbon nanotubes (MWCNTs)1,2 are composed of coaxial cylindrical graphene layers, where the interwall interaction is predominantly van der Waals (vdW) force rather than chemical bonds.3,4 Therefore, the nest walls tend to slide or rotate easily against the others under external axial load.5 The well-defined geometry and extreme structural anisotropy of MWCNTs have brought qualitatively new characters to their physical and mechanical behaviors,6 for example, nanoscale friction.4,7–9 To date, the exceptional interwall friction behaviors of MWCNTs have attracted widespread attention in various fields of nanoengineering. Especially, Cumings and Zettl,3 and Ruoff and colleagues,10 have realized the sliding behavior through telescoping or drawing the inner tube out of the outer shell, confirming the ultralow interwall friction and wear-free interlayer sliding, which makes MWCNTs an ideal candidate for the fabrication of self-optimistic smoothest bearing,11,12 wear-free linear spring3,13 and gigahertz-nano-oscillators,8,14,15 actuators,16 etc.
To utilize MWCNTs in micro/nanomechanical systems, achieving a comprehensive understanding of their nanomechanical and nanotribological properties is of significant importance. So far, plenty of studies have focused on the mechanical and nanotribological properties of MWCNTs. Kim and his colleagues successfully manipulated the MWCNTs by using atomic force microscopy.17 Ultralong MWCNTs were extracted shell-by-shell allowing the exposure of the innermost single-walled carbon nanotube (SWCNT), which changed the electrical characteristics of the MWCNTs. Wei and his colleagues pulled out the inner shells from centimeters-long double-walled carbon nanotubes (DWCNTs) by a steady gas flow under ambient condition,18 which show the superlubricity in centimeters-long DWCNTs. Because of the difficulty of nanomanipulation, more theoretical studies were performed regarding the sliding behavior between nested walls in MWCNTs than the direct experimental observation.9,19–21 Hu et al. studied the pullout process of some outer walls against other inner walls in MWCNTs and investigated the sliding behavior between nested walls.19 Curtin et al. studied the pullout forces and friction in MWCNTs.20 The key conclusion of these simulation studies showed that the pullout force was dominated by the end effect. Local pressure can generate local frictional sliding, and distributed pressure or defects in the nanotube walls can increase or decrease the pullout force, depending on the defect geometry, permitting stick-slip behavior as observed experimentally. In spite of these intriguing results, the extracted sliding behavior of the outmost wall in a MWCNT is still unclear. In particular, there is no general theory addressing the pushout behavior related to spontaneous sliding in a MWCNT by metal nanowires.
In this study, molecular dynamics (MD) simulations on the pushout process of the inner walls of various DWCNTs by platinum nanowires (Pt NWs) are carried out, aiming at understanding the inherit mechanism of the extracting sliding between nested walls and Pt NW. Because there is no chemical bond among DWCNT walls, the DWCNTs show structural superlubricity.22 When the interaction energy between the outmost wall and the Pt NW is larger than that between nested walls, the Pt NW is able to push out the inner wall in DWCNTs. The results show that the diameter of the inner wall of DWCNTs affects the pushout process significantly. However, the chirality of both the inner and outer wall has little effect on the extraction. In addition, the Pt NW with match diameter can also successfully extract the outmost wall in a corresponding MWCNT. The Pt NW length has little effect on the extraction sliding. The study here will help us understanding the inherit mechanism of the extracting sliding, which is essential for nano-mechanical engineering system. Since the successful pushout will result in a SWCNT and a Pt NW/CNT core/shell nanostructure for a DWCNT. This may provide potential applications in many new areas, for example, artificial muscle application.23
Computational methods
The condensed-phased optimized molecular potentials for atomic simulation studies (COMPASS) are employed in conducting force-field computations.24,25 The COMPASS is a first ab initio force-field that enables accurate prediction of various gas phase and condensed phase properties of most of the common organic and inorganic materials. The force field can be expressed as a sum of valence (or bond), cross-term, and non-bond interactions:26–28| | |
Etotal = Evalence + Ecross-term + Enon-bond
| (1) |
The valence energy, Evalence, is generally accounted for diagonal terms, including bond stretching, valence angle bending, dihedral angle torsion, inversion, also called out-of-plane interactions (oop) terms and a Urey–Bradley (UB) term.
| | |
Evalence = Ebond + Eangle + Etorsion + Eoop + EUB
| (2) |
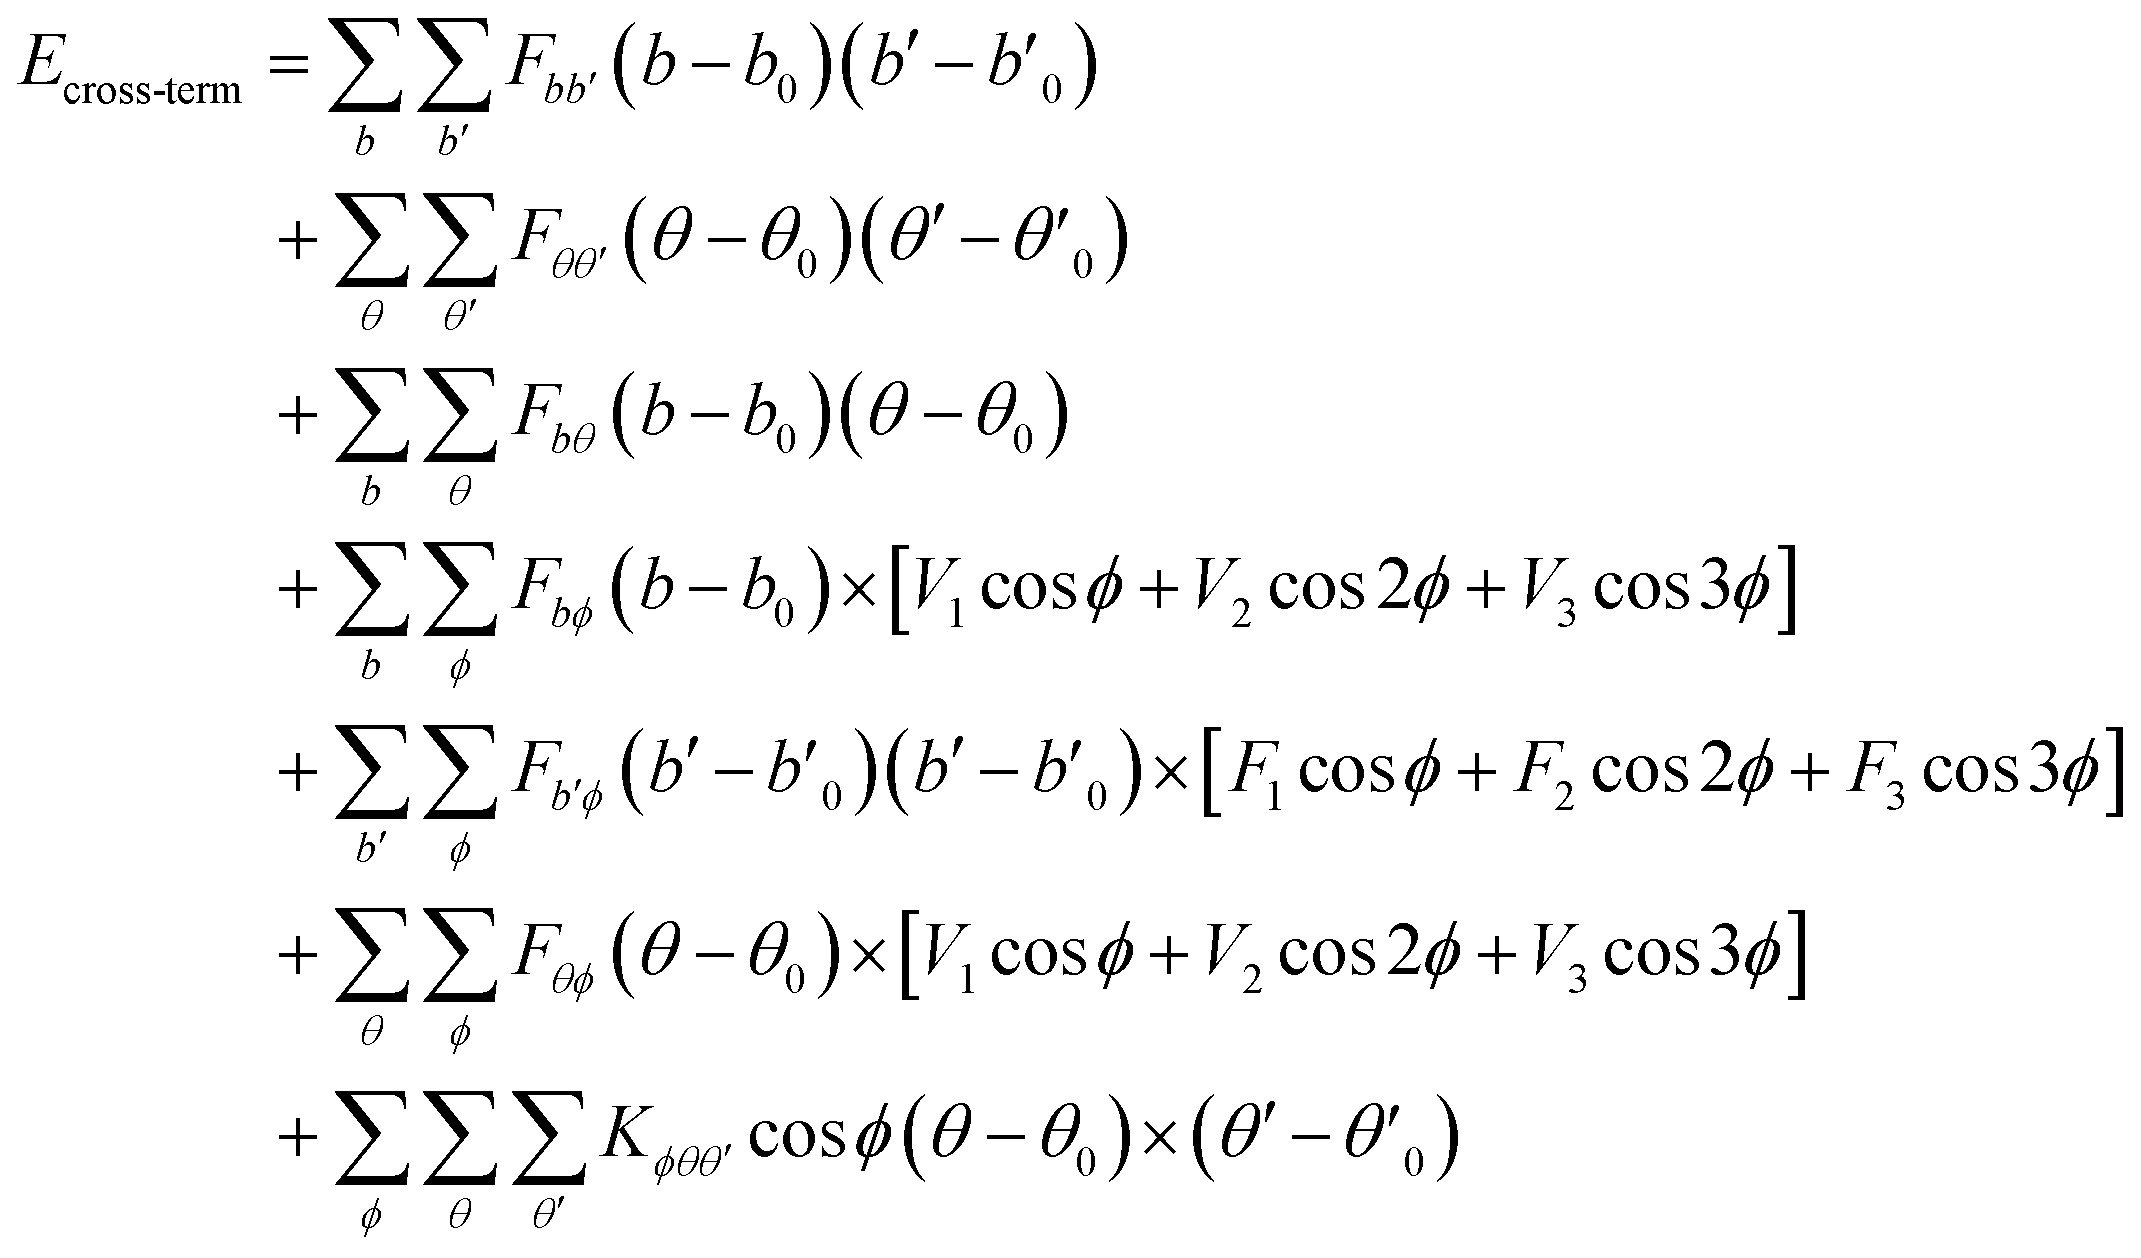
The cross-term interaction energy, Ecross-term, accounts for factors such as bond or angle distortions caused by nearby atoms to accurately reproduce experimental vibrational frequencies and the dynamic properties of molecules. Cross terms can include the following: stretch–stretch, stretch–bend–stretch, bend–bend, torsion–stretch, torsion–bend–bend, bend–torsion–bend and stretch–torsion–stretch.
| | |
Ecross-term = Ebond–bond + Eangle–angle + Ebond–angle + Eend-bond–torsion + Emiddle-bond–torsion + Eangle–torsion + Eangle–angle–torsion
| (3) |
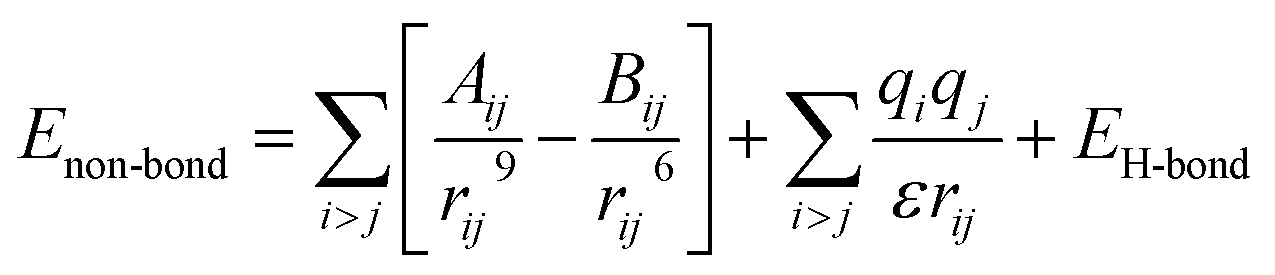
The non-bond interaction term, Enon-bond, accounts for the interactions between non bonded atoms, including vdW, electrostatic and hydrogen bond.
| | |
Enon-bond = EvdW + ECoulomb + EH-bond
| (4) |
The equation of Evalence, Ecross-term and Enon-bond are listed as following:
| |
 | (5) |
| |
 | (6) |
| |
 | (7) |
where
q is the atomic charge,
ε is the dielectric constant and
rij is the
i–
j atomic separation distance.
b and
b′ are the lengths of two adjacent bonds,
θ is the two-bond angle,
ϕ is the dihedral torsion angle and
χ is the out of plane angle.
b0,
Ki (
i = 2–4),
θ0,
Hi (
i = 2–4),
ϕ0i (
i = 1–3),
Vi (
i = 1–3),
Fbb′,
b′0,
Fθθ′,
θ′0,
Fbθ,
Fbϕ,
Fb′ϕ,
Fi (
i = 1–3),
Fθϕ,
Kϕθθ′,
Aij and
Bij are fitted from quantum mechanics calculations.
The main modeling system is composed of a DWCNT and a Pt NW (Fig. 1a). Periodic boundary conditions are applied in the x and y-directions of the modeling system. The length of all the DWCNTs is around 50 Å while the diameter is various. The unsaturated boundary effect is avoided by adding hydrogen atoms at both ends of the DWCNTs. The Pt NW was constructed by the atom selection of the Pt supercell. The Pt unit cell with the face-centered cubic structure parameter (a = b = c = 3.924 Å; α = β = γ = 90°) was imposed from the Materials Studio software. The length of the Pt NW is 54.9 Å while the radius is various.
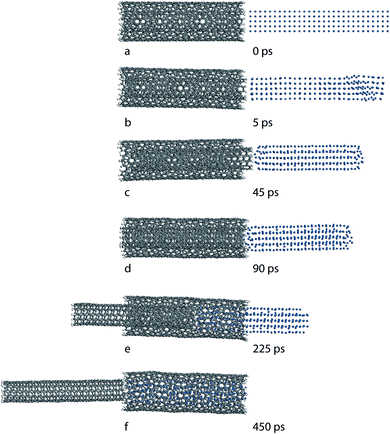 |
| | Fig. 1 Snapshots of the pushout process. A Pt NW (r = 5 Å) pushes out the inner wall of a DWCNT at (a) 0, (b) 5, (c) 45, (d) 90, (e) 225 and (f) 450 ps, respectively. | |
In the simulations, all the models are subjected to a canonical (NVT) ensemble, carried out at a temperature of 300 K and an integration time step of 1 fs. Temperature control is achieved using an Andersen feedback thermostat. The energy of the system is minimized to achieve the strongest bonding between the CNT and Pt NW. To elucidate the results of the MD simulations, the interaction energy, the interaction bonding energy and interfacial shear stress between the CNT and NW are calculated and discussed accordingly.
Results and discussions
The bonding strength between the DWCNT and the Pt NW can be evaluated by the interfacial energy in the models. Generally, the interaction energy can be estimated by the difference between the potential energy of the composite system and the potential energy of the DWCNT and the corresponding Pt NW:| | |
ΔE = Ecom − (ECNT + ENW)
| (8) |
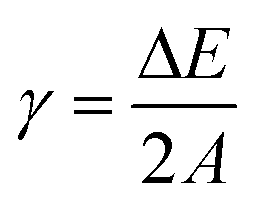
where Ecom is the total potential energy of the composite, ECNT is the potential energy of the CNT without the Pt NW and ENW is the energy of the Pt NW without the CNT. In other words, the interaction energy can be calculated as the difference between the minimum energy and the energy at an infinite separation of the DWCNT and the Pt NW. The total interaction energy (ΔE) is twice the interfacial bonding energy γ scaled by the contact area A.29| |
 | (9) |
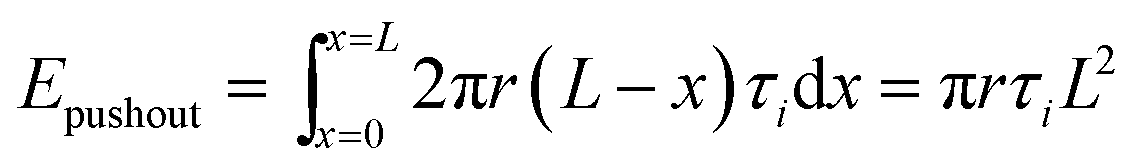
The process of pushing out is achieved by pushing out the inner wall using a Pt NW. The pushout energy (Epushout) is defined as the energy difference between the fully embedded nanotube and the completed pushout configuration.
| | |
Epushout = E1 − E0 = (ΔE1 + ECNT1 + ENW1) − (ΔE0 + ECNT0 + ENW0) = (ΔE1 − ΔE0) + (ECNT1 − ECNT0) + (ENW1 − ENW0)
| (10) |
The pushout energy can be divided into three terms, where E1 and E0 are the potential energy of the composite after and before the pushout process, respectively. ECNT and ENW are the potential energy of the CNT and the Pt NW, respectively. ΔE is the interaction energy between the DWCNT and Pt NW. The pushout energy can be related to the interfacial shear stress, τi, by the following relation:
| |
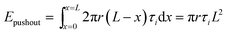 | (11) |
| |
 | (12) |
where
r and
L are the radius of the inner wall and the length of the DWCNT, respectively, and
x is the coordinate along the longitudinal tube axis.
Pushout process
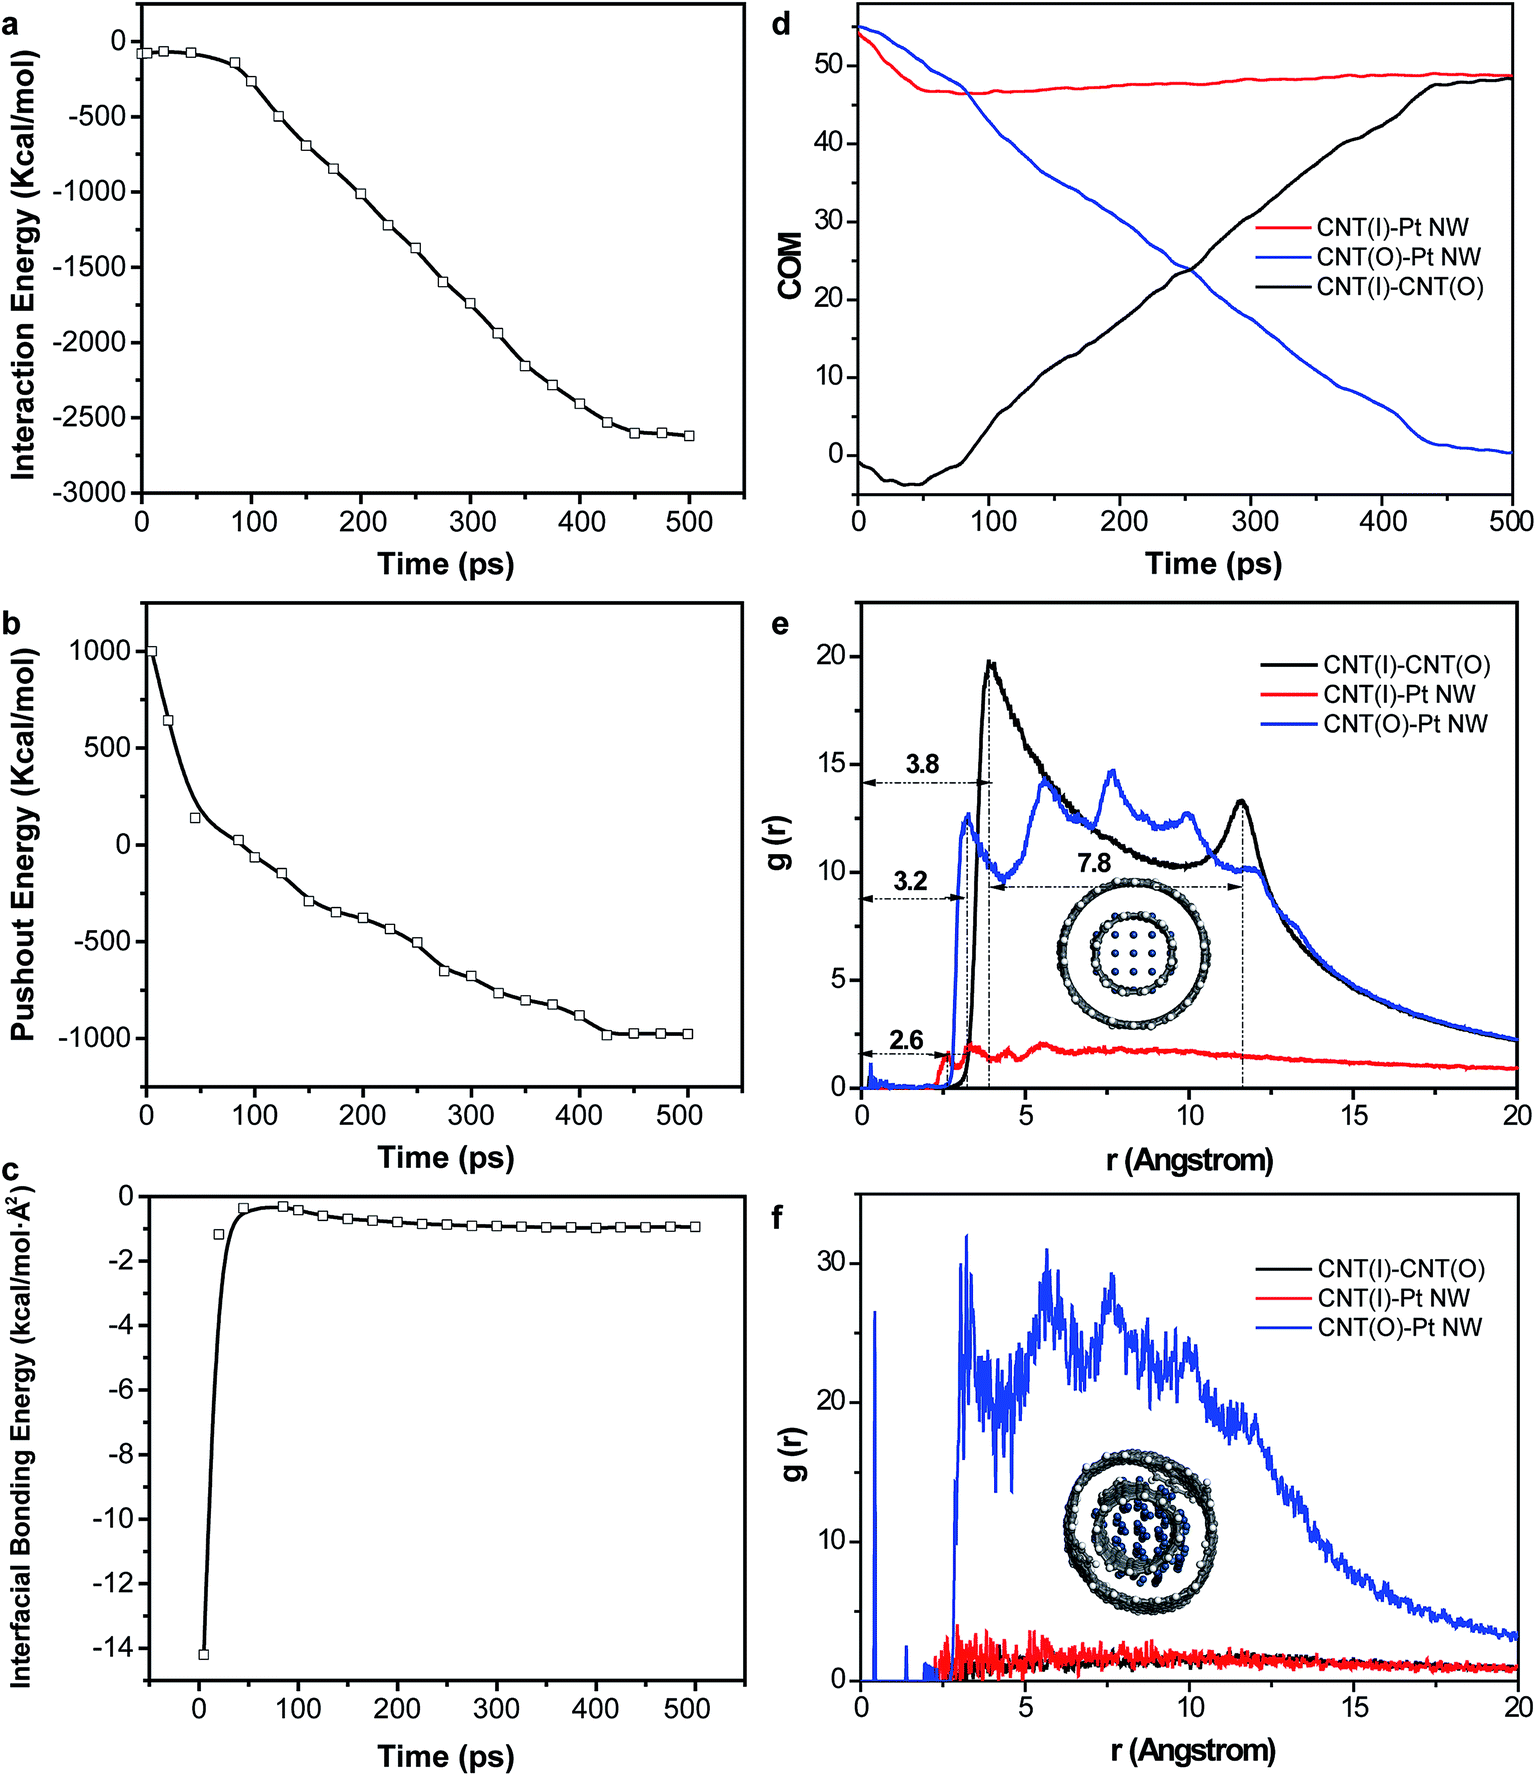
The snapshots of the pushout the inner wall of a DWCNT (6, 6)/(16, 6) by a Pt NW (length, L = 54.9 Å; radius, r = 5 Å) is shown in Fig. 1. In the beginning (t = 0 ps), a Pt NW is placed beside a DWCNT (6, 6)/(16, 6) (Fig. 1a). As the simulation goes on, the DWCNT and the Pt NW get close to each other due to the attraction interaction. At t = 5 ps, the far-from-CNT end of the Pt NW start to deform to lean against CNT, while the inner wall of DWCNT attracted towards the Pt NW (Fig. 1b). At t = 45 ps, the Pt NW reformed to a closely packed NW, pulling the inner wall off the outer shell to the largest distance (Fig. 1c). As the compacted Pt NW moving toward the DWCNT step by step, the interaction energy between the outer wall and the Pt NW become stronger and stronger. When the interaction energy between the outer wall and the Pt NW is larger than that between the inner wall and the Pt NW, Pt NW began to push the inner wall towards the opposite direction (after 45 ps) (Fig. 1d and e). At t = 450 ps, the Pt NW totally pushed out the inner wall, forming a SWCNT and a Pt NW/SWCNT core/shell nanostructure (Fig. 1f).
The energy plots during the pushout process are shown in Fig. 2a–c. Before t = 45 ps, the interaction energy increases slightly, because of the domination of the interaction between the inner wall and the Pt NW, inducing the attraction of the inner wall towards the Pt NW. However, the pushout energy decreases dramatically from 1000 kcal mol−1 to 139 kcal mol−1. The interfacial bonding energy drops from −14 kcal mol−1 Å2 to −0.36 kcal mol−1 Å2. After t = 45 ps, the interaction energy between the DWCNT and Pt NW starts to increase dramatically, due to pushing the inner wall back to outer wall. Meanwhile, the pushout energy continues to decrease with a smaller decreasing slope and the interfacial bonding energy starts to increase slightly. At t = 90 ps, the Pt NW pushes the inner wall back to the outer wall. The pushout energy starts to change from positive value to negative value while the interaction energy and the interfacial bonding energy continue to increase. Afterwards, the Pt NW continues to push the inner wall along the axial direction. The interaction energy, the pushout energy and the interfacial bonding energy are all increased. The only difference is the interfacial bonding energy reaches the equilibrium at a shorter time (around t = 300 ps) compared to that of the interaction energy and the interfacial bonding energy (around t = 450 ps).
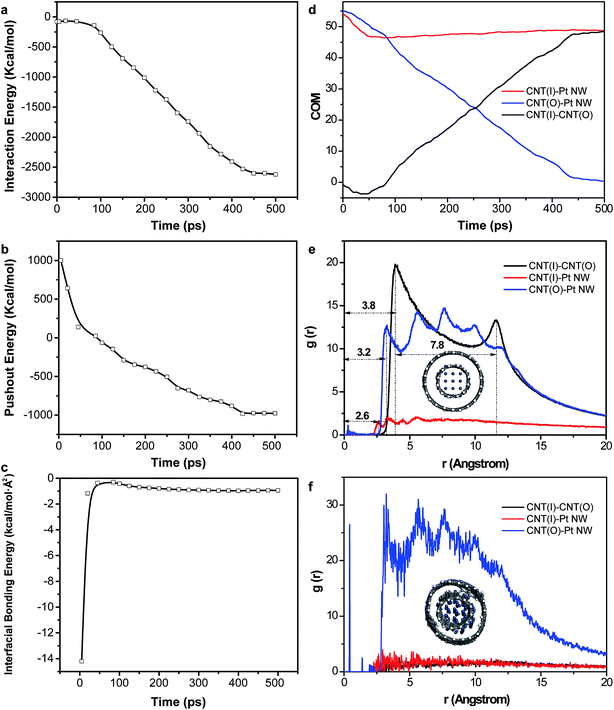 |
| | Fig. 2 Energy plots during the pushout of inner wall of DWCNT (6, 6)/(16, 6) from the outer shell. (a) Interaction energy; (b) pushout energy; (c) interfacial bonding energy; (d) the COM distance between each CNT and Pt NW and between nested walls; (e and f) the radius distribution function of the whole system before (c) and after (d) the pushout process; the insets are the snapshots of the model before and after the pushout process. | |
The center of mass (COM) distances between each CNT and Pt NW and between nested walls in DWCNT are shown in Fig. 1d. It clearly shows that the COM distance between the inner wall and Pt NW decreases in the beginning because of the reform of the Pt NW. At t = 45 ps, the inner wall and the Pt NW reaches the optimum state and keep this optimum distance till the completion of the remaining pushout process. The initial negative value and the later positive value of the COM distance between the inner wall and the outer wall indicates the opposite movement direction of both CNTs. The COM distance between the outer wall and the Pt NW decreases along the whole pushout process and reaches the equilibrium at t = 450 ps. The radius distribution functions of the whole system before and after the pushout process are shown in Fig. 1e and f. Before the pushout process, the Pt NW is well organized. The projected radius distance between the outer shell and the Pt NW is ∼3.2 Å while the projected radius distance between the nested walls is ∼3.8 Å, which is a bit larger than the ideal value of 3.4 Å.30,31 In addition, the projected radius distance between the inner wall and the second row of Pt particle in Pt NW is 2.6 Å, and the projected diameter of the inner wall is 7.8 Å, which is smaller than the ideal value of 8.1 Å. After the completing of the pushout process, the re-organized Pt NW inserted into the outer wall inducing pushing out of the inner wall. The projected radius distance between the outer wall and the Pt NW is almost the same as before the pushout process, and so does the projected radius distance between the inner wall and the second row of Pt particle in Pt NW. As the inner wall has been pushed out from the outer shell, these two SWCNTs are no longer packed parallel, thus the two peaks disappeared. All the small peaks along the line plot (Fig. 1f) indicate the badly organized of the model along the project radius direction.
Pushout mechanism
The walls of the DWCNTs, in this study, are in incommensurate contact. In other words, the two wall surfaces have no energetically preferred position with respect to each other. Therefore, sliding related to nested walls will cost little energy. The superlubricity of DWCNTs can be understood in terms of the length-independent vdW interaction between the walls. In our system, there is no external force exerted on. The interaction between the Pt NW and DWCNT is acted as the pushout force. The comparation of the system energies at two different simulation time during the pushout process, for example at t = 0 and 500 ps of the pushout of the DWCNT (6, 6)/(16, 6) by Pt NW (r = 5 Å) are demonstrated in Table 1. It shows the energy difference of the system at two different simulation time is dominated by the vdW energy of the non-bond energy.
Table 1 Contributions to total energy of the two different statuses
| Energy components (kcal mol−1) |
Status I (t = 0 ps) |
Status II (t = 500 ps) |
| Valance energy |
67![[thin space (1/6-em)]](https://www.rsc.org/images/entities/char_2009.gif) 096.361 096.361 |
68377.499 |
| Bond |
346.380 |
832.964 |
| Angle |
63.360 |
459.561 |
| Torsion |
66337.960 |
66605.121 |
| Inversion |
348.661 |
479.853 |
| Cross terms |
−1023.139 |
−828.036 |
| stretch–stretch |
74.445 |
16.228 |
| stretch–bend–stretch |
−51.327 |
−46.173 |
| stretch–torsion–stretch |
−1578.263 |
−1145.741 |
| Separated–stretch–stretch |
123.131 |
56.971 |
| Torsion–stretch |
200.623 |
130.171 |
| Bend–bend |
0.000 |
0.000 |
| Torsion–bend–bend |
−0.892 |
−0.056 |
| Bend–torsion–bend |
209.143 |
160.565 |
| Non-bond energy |
605.842 |
−18204.903 |
| van der Waals |
561.520 |
−18228.571 |
| Long range correction |
−4.578 |
−6.177 |
| Electrostatic |
48.901 |
29.846 |
| Total energy |
66679.064 |
49344.561 |
The schematic mechanism of the pushout process is shown in Fig. 3. For an ideal DWCNT with partly extruded inner wall by Pt NW, the vdW interaction between the DWCNT and the Pt NW can be divided into three sections (Fig. 3a). Section I indicates the overlapped region between adjacent walls (including the vdW interaction length region where the inner wall is not covered by the outer wall); section II indicates the overlapped region between outer wall and Pt NW (including the vdW interaction length region where the Pt NW is not covered by the outer wall); section III indicates the interface between the inner wall and Pt NW covered by the outer wall. In sections I and II, the axial component of vdW force is nearly zero as a direct consequence of the counteraction of multiple vdW interactions during the pushout process. The pushout force which equals the total shear force induced by the shear stress τi on the sliding surface is in equilibrium with the axial component of vdW force. Therefore, the pushout force is nearly zero which induces zero pushout energy (sections I and II). Since the whole process is dynamic, section I region will decrease while section II region will increase during the pushout process. Considering the cut-off distance of the vdW interaction of 0.95 nm, it will repetitive breaking and reforming of vdW interaction between adjacent walls and between outer wall and Pt NW during the dynamic pushout process. Mainly the axial component of vdW force difference (FvdW2 − FvdW1) in section III contributes to the pushout force completing the pushout process. When the vdW force between the outer wall and the Pt NW, FvdW2, is larger than that between the nested walls, FvdW1, the Pt NW can push out the inner wall due to the low friction between nested walls in the DWCNTs. The vdW energy evolution during the pushout process is shown in Fig. 3b. It shows that the vdW energy changes from positive value to negative value due to the vdW interaction changing from the DWCNT dominant to DWCNT outer wall-Pt NW dominant.
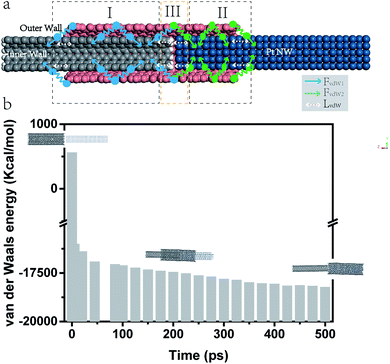 |
| | Fig. 3 Mechanism of the pushout process. (a) Scheme of the vdW interaction sections between a DWCNT and a Pt NW during the inner wall pushout process; FvdW2, the vdW force between the outer wall and the Pt NW; FvdW1, the vdW force between the nested walls; LvdW, the project length of the vdW interaction distance; (b) vdW energy evolution of the pushout of the DWCNT (6, 6)/(16, 6) by Pt NW (r = 5 Å); the insets are the snapshots of the pushout process at different simulation time. | |
Diameter effect
The interaction between the Pt NW (L = 54.9 Å; r = 5 Å) and different diameters of DWCNTs is shown in Fig. 4. The parameters of the diverse sequence DWCNTs are shown in Table 2. The final configuration of the pushout of diverse inner walls out of the outer walls induced by the Pt NWs are shown in Fig. 4a. It demonstrates that the Pt NW with the radius of 5 Å can successfully push the inner wall CNT (6, 6) out of the outer shell CNT (16, 6). With the increasing of DWCNT diameters, the Pt NW can only pushout part of the diverse inner walls, because of the stronger interaction between nested walls than that between the outer walls and Pt NWs. When the DWCNT diameter is a bit larger than the diameter of Pt NW, the Pt NW neither can find the balance to push out the inner wall CNT nor can insert into the inner CNT, thus forming the configuration shown in Fig. 4a labled by (10, 10) and (11, 11). Further increasing the diameter of DWCNTs, the inner wall diameter is larger enough to encapsulate the Pt NW. Therefore, the push out process changes to the inserting process. The final configuration is formed as a Pt NW/DWCNT core/shell nanostructure.
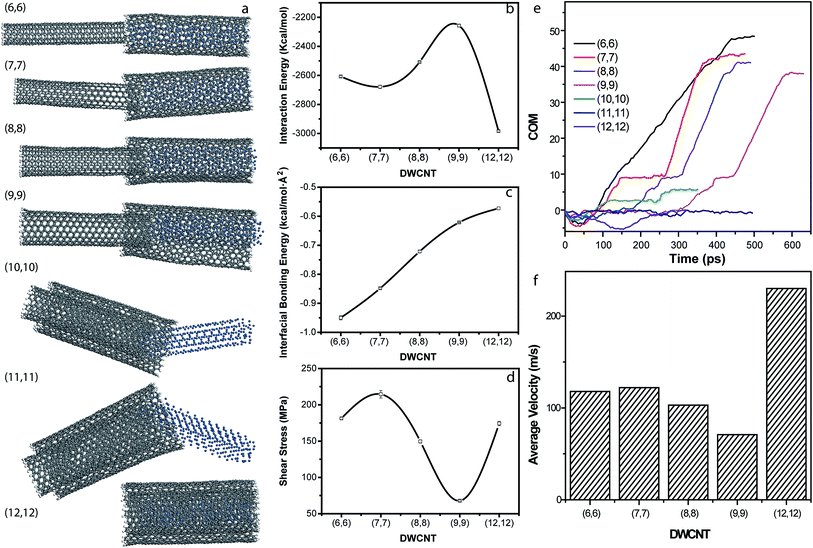 |
| | Fig. 4 The interaction between the Pt NW and different diameter of sequence DWCNTs. (a) The snapshots of the radius effect on the pushout process; (b) the interaction energy, (c) interfacial bonding energy, and (d) shear stress during the pushout process; (e) the COM distance between the nested walls in diverse DWCNTs; (f) the average velocity of the pushout process. | |
Table 2 The parameters of diverse sequence DWCNTs
| DWCNTs |
Diameter of inner CNT Di (Å) |
Diameter of outer CNT Do (Å) |
Diameter difference ΔD (Å) |
| DWCNT (6, 6)/(16, 6) |
8.14 |
15.42 |
7.28 |
| DWCNT (7, 7)/(17, 7) |
9.49 |
16.74 |
7.25 |
| DWCNT (8, 8)/(18, 8) |
10.85 |
18.06 |
7.21 |
| DWCNT (9, 9)/(19, 9) |
12.20 |
19.38 |
7.18 |
| DWCNT (10, 10)/(20, 10) |
13.56 |
20.71 |
7.15 |
| DWCNT (11, 11)/(21, 11) |
14.92 |
22.05 |
7.13 |
| DWCNT (12, 12)/(22, 12) |
16.27 |
23.38 |
7.11 |
Meanwhile, the energy plots of the interaction between the Pt NW and different diameter of sequence DWCNTs are shown in Fig. 4b–d. Since DWCNT (10, 10)/(20, 10) and DWCNT (11, 11)/(21, 11) are not able to complete the pushout process, the energy plots are not shown. The interaction energies between diverse DWCNTs and Pt NWs are shown in Fig. 4b. During all the pushout process, the interaction energy increases in the beginning and then decrease gradually. When the pushout process changed to the inserting process, the interaction energy starts to increase. The interfacial bonding energy (Fig. 4c) decreases linearly with increasing the diameter of the DWCNTs. The shear stress (Fig. 4d) shows the same tendency as the interaction energy, which increases in the beginning and then decreases with increasing diameters of DWCNTs, finally increase when the diameter of inner wall is larger enough than that of Pt NW.
The COM distances between the inner and outer walls are shown in Fig. 4e. The negative value indicates the pullout process while the positive value indicates the pushout process. The platform indicates the steady status of the system. It is obvious that some of the pushout process experience the medium steady state before the completion of the pushout process (the final platform). The smaller COM values of the DWCNT (7, 7)/(17, 7), DWCNT (8, 8)/(18, 8) and DWCNT (9, 9)/(19, 9) than that of the DWCNT (6, 6)/(16, 6) indicate partly pushout of the inner walls. According to the COM distances between the nested walls, the average velocity of the pushout process are obtained (Fig. 4f). It apparently shows that the average velocity of the pushout process increases when the diameter of inner wall increases from 8.14 Å to 9.49 Å, which may be due to the less resistance with the increasing diameter. Further increase the diameter, the interaction between the nested walls become larger. Thus it become more and more difficult for Pt NW pushing out the inner walls completely. When the diameter of the inner wall is larger enough than the Pt NW diameter, the pushout process changes to the inserting process. In this consequences, all the resistance during the pushout process become the power benefit for the inserting process. Therefore, the average velocity increases dramatically.
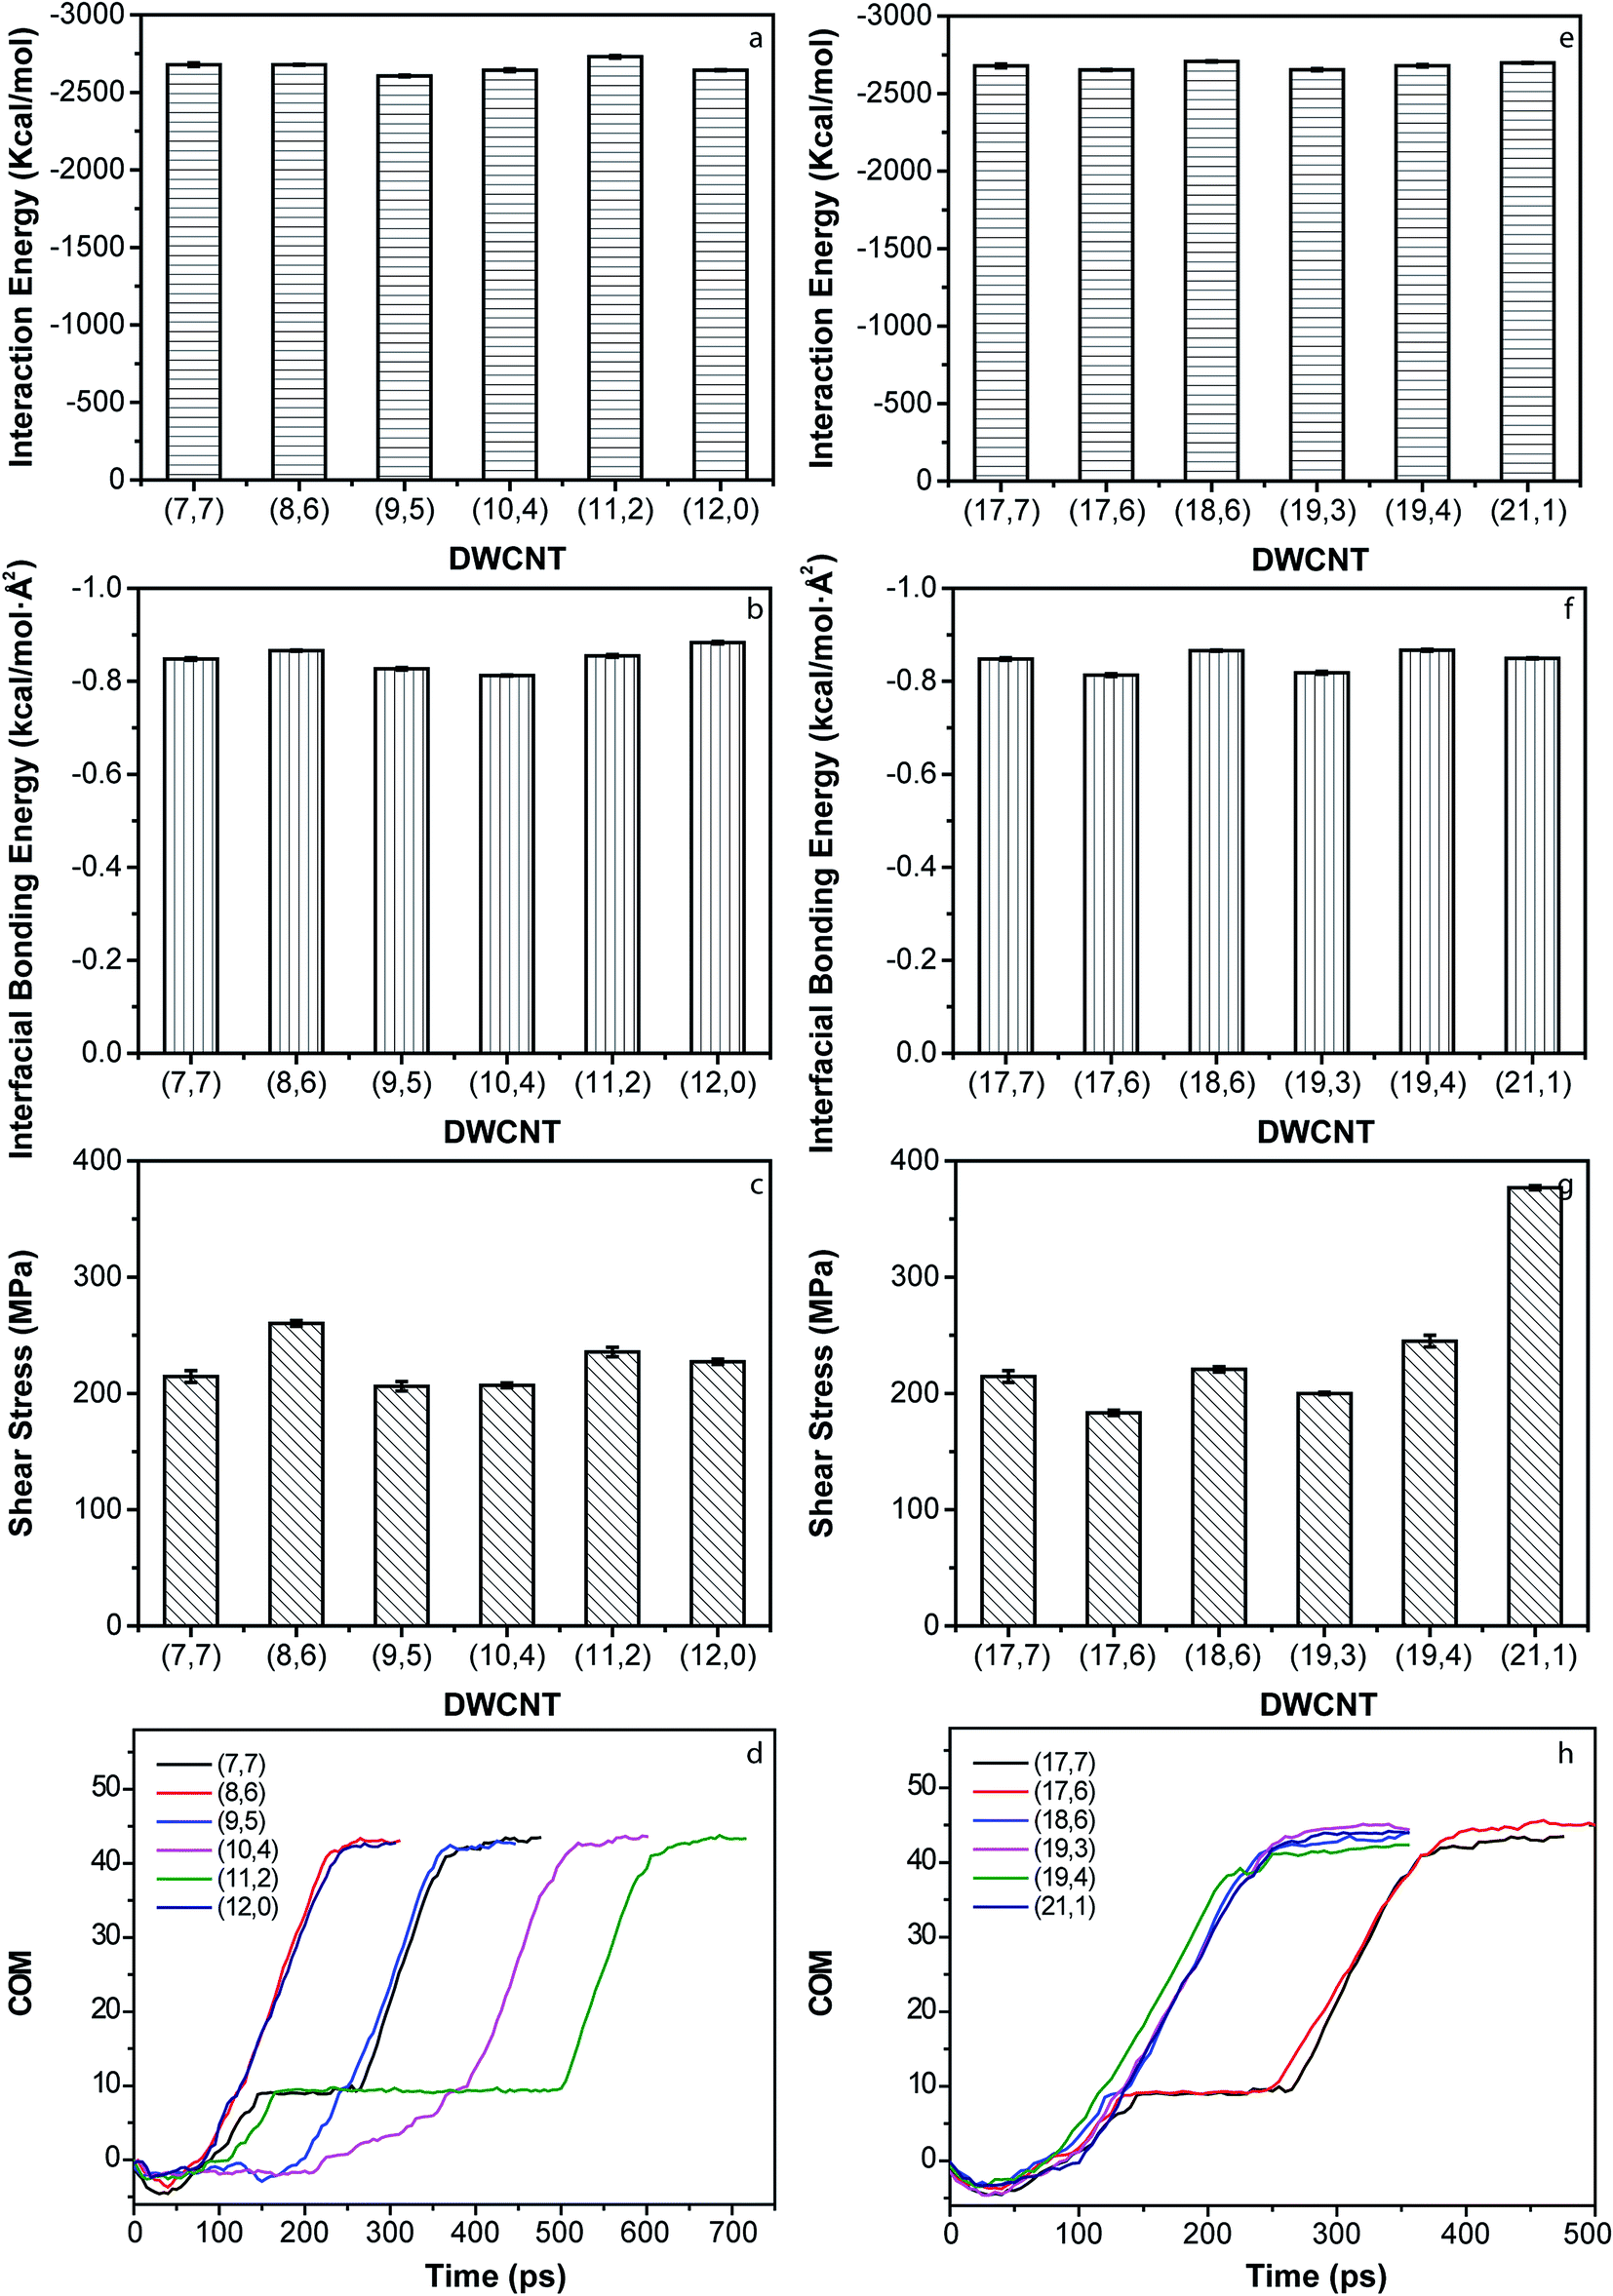
Chirality effect
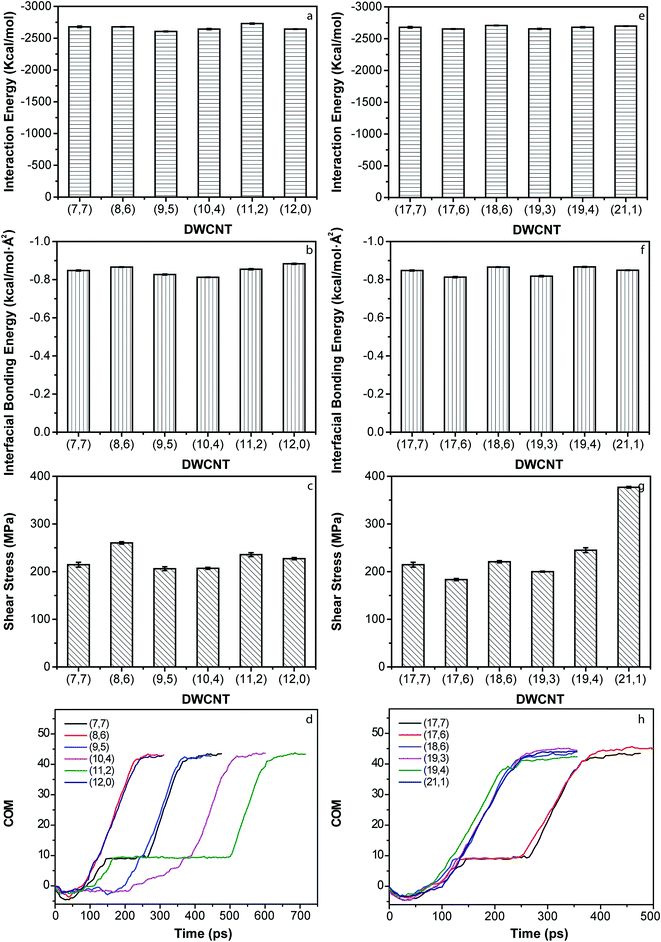
The CNT can be viewed as rolled-up graphene sheets and their structure can be expressed by the chiral index (n, m).32–34 For DWCNTs, the chiral indices of different walls are independent to each other. To investigate the chirality effect on the pushout process, the interaction between the Pt NW and different chiral DWCNTs are investigated (Fig. 5). Since DWCNT has two walls, the chirality effect should consider both the inner wall and the outer wall. First, the chirality of the outer walls keeps the same while that of the inner walls changes and vice versa. The parameters for different chirality of DWCNTs are demonstrated in Table 3. The energy plots of the chirality effect of both walls on the pushout process are shown (Fig. 5a–c and e–g). The interaction energies between Pt NWs and DWCNTs with different chirality are more or less the same (Fig. 5a and e). The maximum interaction energy difference between the Pt NWs and DWCNTs with diverse inner wall chirality is 72 kcal mol−1 (accounts for 2.69%) while that between the Pt NWs and DWCNTs with diverse outer wall chirality is 71 kcal mol−1 (accounts for 2.65%). The inner wall chirality also has little effect on the interfacial bonding energy between diverse DWCNTs and Pt NWs (Fig. 5b and f). The maximum difference among the interfacial bonding energies between the Pt NW and DWCNTs with diverse inner wall chirality and that between the Pt NW and the DWCNTs with diverse outer wall chirality are both 0.04 kcal mol−1 Å−2 (accounts for 4.7%). However, both the inner and outer wall chirality has positive effect on the shear stress of Pt NW/DWCNT interface (Fig. 5c and g). For the inner wall chirality, the DWCNT (8, 6)/(17, 7) has the highest shear stress of Pt NW/DWCNT interface, increasing to 121.3%; while for the outer wall chirality, the DWCNT (7, 7)/(21, 1) has the highest shear stress of Pt NW/DWCNT interface, increased to 175.7%. According to eqn (5), the shear stress is proportional to Epushout and is inversely proportional to L2. Thus the pushout length, L, plays a significant role to the shear stress of Pt NW/DWCNT interface. The curves of COM versus simulation time are shown in Fig. 5d and h. The slopes of these curves indicate the instantaneous velocity of the pushout process. Apparently, some DWCNTs can be pushed out continuously while some are not. It is worth noting that the highest shear stress appears in the continuously pushout process.
 |
| | Fig. 5 The interactions between Pt NW and the DWCNTs with either different inner wall chirality or different outer wall chirality. Energy plots of the pushout of DWCNTs with different inner CNT chirality: (a) interaction energy, (b) interfacial bonding energy, and (c) shear stress; (d) the COM distance between nested walls in DWCNTs with different inner wall chirality; energy plots of the pushout of DWCNTs with different outer wall chirality: (e) interaction energy, (f) interfacial bonding energy, and (g) shear stress; (h) the COM distance between nested walls in DWCNTs with different outer wall chirality. | |
Table 3 The parameters of diverse chiral DWCNTs
| DWCNTs |
Inner wall chiral index (n, m) |
Outer wall chiral index (n, m) |
Di (Å) |
Do (Å) |
ΔD (Å) |
| 1 |
(7, 7) |
(17, 7) |
9.49 |
16.74 |
7.25 |
| 2 |
(8, 6) |
(17, 7) |
9.52 |
16.74 |
7.22 |
| 3 |
(9, 5) |
(17, 7) |
9.62 |
16.74 |
7.12 |
| 4 |
(10, 4) |
(17, 7) |
9.78 |
16.74 |
6.96 |
| 5 |
(11, 2) |
(17, 7) |
9.49 |
16.74 |
7.25 |
| 6 |
(12, 0) |
(17, 7) |
9.39 |
16.74 |
7.35 |
| 7 |
(7, 7) |
(17, 6) |
9.49 |
16.18 |
6.69 |
| 8 |
(7, 7) |
(18, 6) |
9.49 |
16.94 |
7.45 |
| 9 |
(7, 7) |
(19, 3) |
9.49 |
16.18 |
6.69 |
| 10 |
(7, 7) |
(19, 4) |
9.49 |
16.66 |
7.17 |
| 11 |
(7, 7) |
(21, 1) |
9.49 |
16.85 |
7.36 |
Wall number and NW length effect
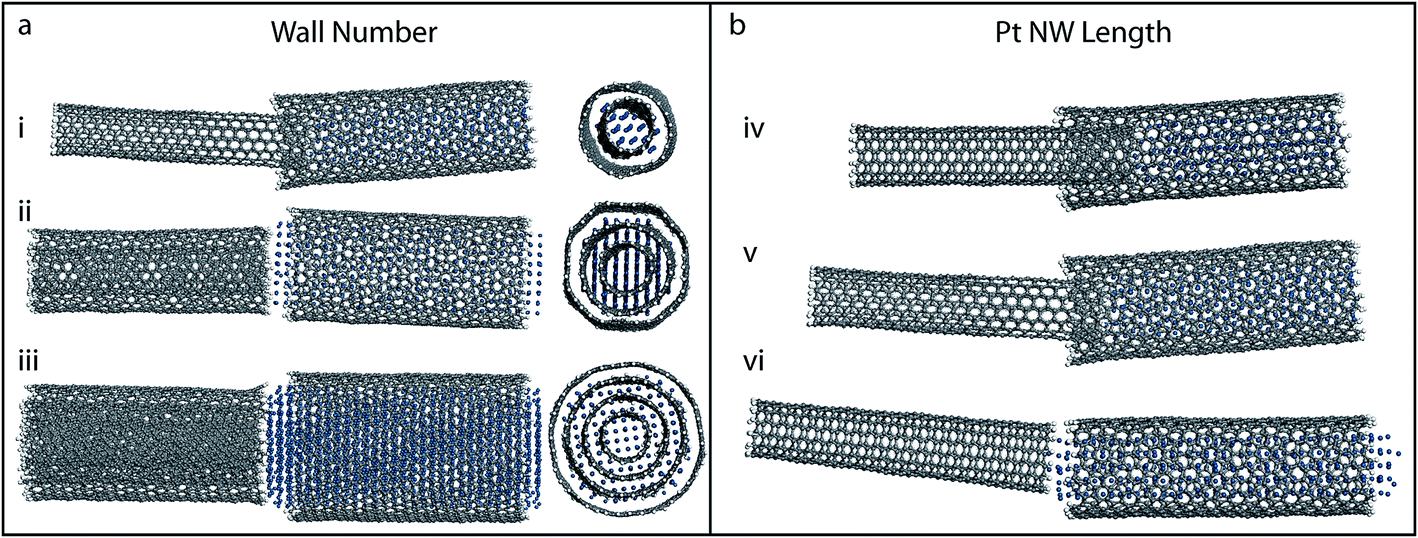
CNTs mainly exist as the MWCNTs. In this study, the triple-walled CNT and the quadruple-walled CNT are selected representing the MWCNTs. The configurations of different MWCNTs pushed out by different sizes of Pt NWs are shown in Fig. 6a. With the increasing of the wall number, only when the corresponding diameters of Pt NWs increase, the pushout process can be completed successfully. For the triple-walled CNT (7, 7)/(17, 7)/(26, 7), the Pt NW with the radius of 9 Å can perfectly push the inner DWCNT out of the outer shell. As for the quadruple-walled CNT (7, 7)/(17, 7)/(26, 7)/(35, 7), the Pt-NW with larger radius (13 Å) can successfully push out the inner triple-walled CNT out of the outer wall. Interestingly, the Pt-NW with proper radius can only extract the outermost wall in MWCNT, neither DWCNT nor triple-walled CNT nor even more. The reason for this phenomenon is obvious. If the inner wall expected to be pushed out, the corresponding Pt NW should be smaller, thus the interaction energy between the Pt NW (smaller diameter) and MWCNT is smaller than that between the nested MWCNT walls inducing the failure of the pushout process. For the larger Pt NWs (radius = 9 Å & 13 Å), they can maintain the structure very well both during the pushout and after the completion of the pushout process. This may be because the energy among the Pt particles is strong enough, which is not easily be deformed by other energy.
 |
| | Fig. 6 (a) The snapshots of pushout of (i) DWCNT (7, 7)/(17, 7), (ii) triple-walled CNT (7, 7)/(17, 7)/(26, 7) and (iii) quadruple-walled CNT (7, 7)/(17, 7)/(26, 7)/(35, 7) by Pt-NWs with the radius of (i) 5 Å, (ii) 9 Å and (iii) 13 Å; (left, side view; right, top view); (b) the NW length effect on the pushout process of DWCNT (7, 7)/(17, 7) by Pt NW with 5 Å radius and length of (iv) 45.1 Å, (v) 54.9 Å and (vi) 74.6 Å. | |
To completely push the inner wall out of DWCNT outer shell, the length of the DWCNTs and Pt NWs are almost the same. The length of the Pt NW has little effect on the pushout process compared with the Pt NW diameter. Fig. 6b shows the inner wall of DWCNT (7, 7)/(17, 7) pushed out by the Pt NW with different lengths. It shows that the Pt NWs with different lengths are all able to push out the inner wall from the outer shell though the pushout length varies. Specifically the shorter Pt NW length, the shorter length of the inner wall was pushed out (Fig. 6b-iv). When the Pt NW length is longer than the DWCNT length, the inner wall is able to completely push out (Fig. 6b-vi).
Conclusions
In summary, we have systematically investigated the pushout process of diverse DWCNTs and MWCNTs by Pt NWs using MD simulations. When the interaction energy between the outmost wall and the Pt NW is larger than that between the nested walls, the Pt NW is able to push out the inner wall/s. The diameter of the inner wall of DWCNTs affects the pushout process significantly while the chirality of both the inner and outer wall has little effect on the extraction. In addition, the Pt NW can also successfully extract the outmost wall in a MWCNT with proper diameter. The Pt NW length has little effect on the pushout process compared with the Pt NW diameter. This study is benefit for understanding the pushout sliding mechanism between MWCNTs and Pt NWs and may shed light on the potential applications in nano-mechanical engineering system and other new areas.
Conflicts of interest
There are no conflicts of interest to declare.
Acknowledgements
The authors gratefully acknowledge the support by the National Natural Science Foundation of China (Project No. 51201056, 51171058, 51401146), Natural Science Foundation of Hebei Province of China (Project No. E2013202021, E2013202022, E2015202037), Outstanding Youth Foundation of Hebei Province of China (Project No. E2015202282), and Science and Technology Correspondent Project of Tianjin (No. 14JCTPJC00496, 15JCYBJC29900). D. X. acknowledges the financial support from the National Natural Science Foundation of China (No. 31600753), from the Natural Science Foundation of Tianjin (No. 16JCYBJC43400) and from the National Science Foundation of Hebei (No. C2017202206).
References
- A. L. Higginbotham, D. V. Kosynkin, A. Sinitskii, Z. Sun and J. M. Tour, ACS Nano, 2010, 4, 2059–2069 CrossRef CAS PubMed.
- T.-K. Hong, D. W. Lee, H. J. Choi, H. S. Shin and B.-S. Kim, ACS Nano, 2010, 4, 3861–3868 CrossRef CAS PubMed.
- J. Cumings and A. Zettl, Science, 2000, 289, 602–604 CrossRef CAS PubMed.
- R. H. Baughman, A. A. Zakhidov and W. A. de Heer, Science, 2002, 297, 787–792 CrossRef CAS PubMed.
- A. Belikov, Y. E. Lozovik, A. Nikolaev and A. Popov, Chem. Phys. Lett., 2004, 385, 72–78 CrossRef CAS.
- J. Y. Huang, F. Ding and B. Yakobson, Phys. Rev. Lett., 2008, 100, 035503 CrossRef CAS PubMed.
- R. F. Service, Science, 1998, 281, 940–942 CrossRef CAS.
- Q. Zheng and Q. Jiang, Phys. Rev. Lett., 2002, 88, 045503 CrossRef PubMed.
- M. Huhtala, A. Krasheninnikov, J. Aittoniemi, S. Stuart, K. Nordlund and K. Kaski, Phys. Rev. B: Condens. Matter Mater. Phys., 2004, 70, 045404 CrossRef.
- M.-F. Yu, B. I. Yakobson and R. S. Ruoff, J. Phys. Chem. B, 2000, 104, 8764–8767 CrossRef CAS.
- J. C. Charlier and J. P. Michenaud, Phys. Rev. Lett., 1993, 70, 1858–1861 CrossRef CAS PubMed.
- A. N. Kolmogorov and V. H. Crespi, Phys. Rev. Lett., 2000, 85, 4727–4730 CrossRef CAS PubMed.
- J. Cumings, P. G. Collins and A. Zettl, Nature, 2000, 406, 586 CrossRef CAS PubMed.
- W. Guo, Y. Guo, H. Gao, Q. Zheng and W. Zhong, Phys. Rev. Lett., 2003, 91, 125501 CrossRef PubMed.
- S. B. Legoas, V. R. Coluci, S. F. Braga, P. Z. Coura, S. O. Dantas and D. S. Galvão, Phys. Rev. Lett., 2003, 90, 055504 CrossRef CAS PubMed.
- A. M. Fennimore, T. D. Yuzvinsky, W.-Q. Han, M. S. Fuhrer, J. Cumings and A. Zettl, Nature, 2003, 424, 408–410 CrossRef CAS PubMed.
- B. H. Hong, J. P. Small, M. S. Purewal, A. Mullokandov, M. Y. Sfeir, F. Wang, J. Y. Lee, T. F. Heinz, L. E. Brus and P. Kim, Proc. Natl. Acad. Sci. U.S.A., 2005, 102, 14155–14158 CrossRef CAS PubMed.
- R. Zhang, Z. Ning, Y. Zhang, Q. Zheng, Q. Chen, H. Xie, Q. Zhang, W. Qian and F. Wei, Nat. Nanotechnol., 2013, 8, 912–916 CrossRef CAS PubMed.
- Y. Li, N. Hu, G. Yamamoto, Z. Wang, T. Hashida, H. Asanuma, C. Dong, T. Okabe, M. Arai and H. Fukunaga, Carbon, 2010, 48, 2934–2940 CrossRef CAS.
- Z. Xia and W. A. Curtin, Phys. Rev. B: Condens. Matter Mater. Phys., 2004, 69, 233408 CrossRef.
- W. Guo, W. Zhong, Y. Dai and S. Li, Phys. Rev. B: Condens. Matter Mater. Phys., 2005, 72, 075409 CrossRef.
- M. Hirano, K. Shinjo, R. Kaneko and Y. Murata, Phys. Rev. Lett., 1997, 78, 1448–1451 CrossRef CAS.
- S. Lu and B. Panchapakesan, Nanotechnology, 2006, 17, 888 CrossRef CAS.
- J. R. Maple, M. J. Hwang, T. P. Stockfisch, U. Dinur, M. Waldman, C. S. Ewig and A. T. Hagler, J. Comput. Chem., 1994, 15, 162–182 CrossRef CAS.
- H. Sun, J. Comput. Chem., 1994, 15, 752–768 CrossRef CAS.
- D. Xia, Q. Li, Q. Xue, C. Liang and M. Dong, Phys. Chem. Chem. Phys., 2016, 18, 18406–18413 RSC.
- K. Yan, Q. Xue, D. Xia, H. Chen, J. Xie and M. Dong, ACS Nano, 2009, 3, 2235–2240 CrossRef CAS PubMed.
- D. Xia, Q. Xue, J. Xie, H. Chen, C. Lv, F. Besenbacher and M. Dong, Small, 2010, 6, 2010–2019 CrossRef CAS PubMed.
- V. Lordi and N. Yao, J. Mater. Res., 2000, 15, 2770–2779 CrossRef CAS.
- S. Iijima, Nature, 1991, 354, 56 CrossRef CAS.
- Y. Saito, T. Yoshikawa, S. Bandow, M. Tomita and T. Hayashi, Phys. Rev. B: Condens. Matter Mater. Phys., 1993, 48, 1907 CrossRef CAS.
- M. J. O'Connell, E. E. Eibergen and S. K. Doorn, Nat. Mater., 2005, 4, 412–418 CrossRef PubMed.
- S. Bandow, S. Asaka, Y. Saito, A. M. Rao, L. Grigorian, E. Richter and P. C. Eklund, Phys. Rev. Lett., 1998, 80, 3779–3782 CrossRef CAS.
- H. Telg, J. Maultzsch, S. Reich, F. Hennrich and C. Thomsen, Phys. Rev. Lett., 2004, 93, 177401 CrossRef CAS PubMed.
|
| This journal is © The Royal Society of Chemistry 2017 |
Click here to see how this site uses Cookies. View our privacy policy here. 
 Open Access Article
 This Open Access Article is licensed under a
  a,
Yongchao Luoa,
Qiang Li*b,
Qingzhong Xuec,
Xiaomin Zhanga,
Chunyong Liang*a and
Mingdong Dong
a,
Yongchao Luoa,
Qiang Li*b,
Qingzhong Xuec,
Xiaomin Zhanga,
Chunyong Liang*a and
Mingdong Dong