 Open Access Article
The influence of hydrogen bonding on N-methyldiethanolamine-extended polyurethane solid–solid phase change materials for energy storage
Hongwei Caoa,
Feixuanyu Qib,
Ruowang Liu*b,
Fengtao Wanga,
Caixia Zhanga,
Xiaoni Zhanga,
Yuye Chaib and
Lanlan Zhai *b
*b
aState Grid Henan Electric Power Research Institute, Zhengzhou 450052, PR China
bKey Laboratory of Leather Engineering of Zhejiang Province, College of Chemistry and Materials Engineering, Wenzhou University, Wenzhou 325027, PR China. E-mail: wzlrw@163.com; zhaill@wzu.edu.cn
First published on 14th February 2017
Abstract
Hydrogen bonding was used to enhance the crystallinity and thus increase the phase change enthalpy of thermoplastic poly(ethylene glycol)-based polyurethane. With novel hydrogen bonding between two hard segments (NH⋯N) in N-methyldiethanolamine-extended polyurethane (NPU), the intensity of the NH⋯O![[double bond, length as m-dash]](https://www.rsc.org/images/entities/char_e001.gif) C hydrogen bond between two hard segments increased, while that of the NH⋯O hydrogen bond between soft and hard segments decreased. The crystallinity and energy storage capability of NPU benefited from these and was thus enhanced. The phase change enthalpy was approximately 140 J g−1, which is very close to the highest value reported for cross-linked polyurethane. In addition, the crystallinity and crystallite perfection of NPU increased with the regular arrangement of soft segments and the microphase separation between soft and hard domains. The influence of the three different hydrogen bonds on the phase change enthalpy, crystallinity, crystallization morphology and microphase structure of the soft segment was discussed.
C hydrogen bond between two hard segments increased, while that of the NH⋯O hydrogen bond between soft and hard segments decreased. The crystallinity and energy storage capability of NPU benefited from these and was thus enhanced. The phase change enthalpy was approximately 140 J g−1, which is very close to the highest value reported for cross-linked polyurethane. In addition, the crystallinity and crystallite perfection of NPU increased with the regular arrangement of soft segments and the microphase separation between soft and hard domains. The influence of the three different hydrogen bonds on the phase change enthalpy, crystallinity, crystallization morphology and microphase structure of the soft segment was discussed.
1. Introduction
As the energy crisis and greenhouse gas emissions become increasingly serious, scientists all over the world are exploiting renewable energy sources and using present energy sources more economically. Energy storage materials, which are important for developing new sources of energy, have received increased attention in energy saving technologies. Recently, poly(ethylene glycol)-based polyurethane (PEG-PU) has been the focus of study for solid–solid phase change materials (PCMs)1–10 due to its capacity to store energy as latent heat of fusion and the excellent integrated performances of polyurethane (PU). This material employs urethane groups as the skeleton (hard segment) to keep the material in the solid state after melting of the poly(ethylene glycol) (PEG) segment, which is chemically bonded to the hard segment. In addition, PEG acts as a phase change ingredient (soft segment). The energy is mainly obtained from the latent heat resulting from the phase change between the crystalline state and the amorphous state of the soft segment. Therefore, the energy storage capacity of PEG-PU depends on the crystallinity of the soft segment (PEG) in PEG-PU.Much attention has been paid to the crystallinity of PEG-PU for its enhanced energy storage capabilities.1–3,7 It was noted that the existence of a hard segment was detrimental to the crystallinity of the soft segment and its transition enthalpy, though the hard segment plays a very important role in maintaining polyurethane phase change material (PUPCM) in the solid state.2,10 The soft segment is confined near the hard segment2,3,6,11,12 through chemical bonds between the active hydroxyl end groups of PEG and the diisocyanate moieties in 4,4-diphenylmethane diisocyanate (MDI). Thus, the interaction between the soft and hard segments affects the fusing behavior of PEG and hinders its crystallization and arrangement.2,3,12 In addition, research on thermoplastic PU elastomers revealed that the soft and hard segments interacted through hydrogen bonds13–15 and chemical bonds in PU, both of which confined the arrangement and orientation of PEG and consequently suppressed the crystallization of PEG.3,8 Moreover, hydrogen bonds between the urethane NH groups and the oxygens in PEG (NH⋯O hydrogen bond) result in the dissolution of some of the hard segment into the soft segment matrix.16,17 The dissolved hard segment acts as an impurity within the PEG domains.2,18 Accordingly, the crystalline perfection of PEG is destroyed, and the crystalline regions decrease, both of which cause the phase change temperature and enthalpy to fall by a certain degree. Therefore, minimizing the negative impact of hydrogen bonding on the latent heat (phase change) of PEG-PU may be an effective way to increase the phase change enthalpy and thus increase the energy storage capability of PEG-PU PCMs.
Though hydrogen bonds are important structural features of PEG-PU, their influence on energy storage has not been reported. The above research has given most of its attention to preparing PEG-PU with different novel chain extenders to improve the phase transition enthalpy,1,3,5–7 ignoring interactions between the soft and hard segments, which are the primary factors influencing PEG's crystallinity, as was noted in the above research. Furthermore, the synthetic routes for these novel chain extenders are complex with high costs.1,5,7 In addition, the reported PEG-PU cannot be directly processed into energy storage materials because cross-linking easily occurs.7,8
In our previous study,9 it was shown that the obvious enhancement in the phase change enthalpy of linear PEG-PU ionomers was closely related to hydrogen bonding, but this was not investigated further. Therefore, in this study, hydrogen bonding was used to enhance the crystallinity and thus increase the phase change enthalpy of thermoplastic PEG-PU. Hydrogen bonding between the soft and hard segments was weakened to minimize hindrances to the crystallization of the soft segment. In addition, hydrogen bonding between hard segments was strengthened to promote aggregation of the hard segment away from the soft domain to enhance the purity and crystalline perfection of the soft domain. The influence of hydrogen bonding on the phase change enthalpy, crystallinity, crystallization morphology and microphase structure of N-methyldiethanolamine-extended polyurethane (NPU) was investigated with differential scanning calorimetry (DSC), Fourier transform infrared spectroscopy (FT-IR), wide angle X-ray diffraction (WAXD), polarization optical microscopy (POM), nuclear magnetic resonance spectroscopy (NMR) and atomic force microscopy (AFM).
2. Experimental
2.1 Materials
Polyethylene glycol (PEG, Mn = 6000 g mol−1 and 10![[thin space (1/6-em)]](https://www.rsc.org/images/entities/char_2009.gif) 000 g mol−1), N-methyldiethanolamine (MDEA) and 4,4′-diphenylmethane diisocyanate (MDI) were purchased from Aladdin (China). 1,4-Butane diol (BDO) and N,N-dimethylformamide (DMF) were purchased from Sinopharm (China). DMF was dried using a 4 Å molecular sieve before use.
000 g mol−1), N-methyldiethanolamine (MDEA) and 4,4′-diphenylmethane diisocyanate (MDI) were purchased from Aladdin (China). 1,4-Butane diol (BDO) and N,N-dimethylformamide (DMF) were purchased from Sinopharm (China). DMF was dried using a 4 Å molecular sieve before use.
2.2 Sample preparation
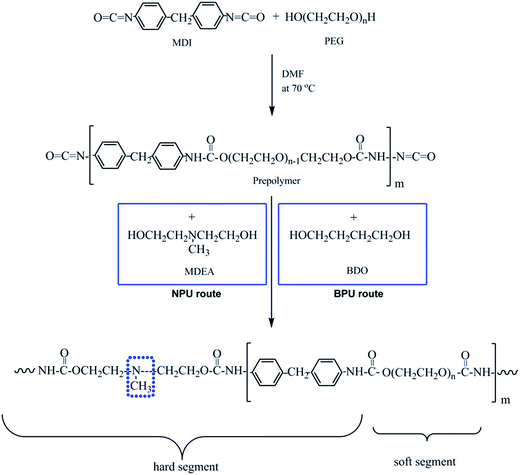
PEG was placed into a 500 mL round-bottom, four-necked separable flask equipped with a mechanical stirrer, condenser, nitrogen inlet, and thermometer. Residual water was evaporated under reduced pressure at 110 °C in an oil bath for 2 h. MDI in distilled DMF was added after the PEG was cooled to 70 °C under nitrogen atmosphere. The reaction mixture was stirred for 3 h to obtain an NCO-terminated prepolymer. Then, MDEA and DMF were fed into the reactor. After that, the mixture was stirred for another 2 h. To obtain linear polyurethane, the molar ratio of [NCO]MDI![[thin space (1/6-em)]](https://www.rsc.org/images/entities/char_2009.gif) :
:![[thin space (1/6-em)]](https://www.rsc.org/images/entities/char_2009.gif) ([OH]MDEA + [OH]PEG) was strictly fixed to 1
([OH]MDEA + [OH]PEG) was strictly fixed to 1![[thin space (1/6-em)]](https://www.rsc.org/images/entities/char_2009.gif) :
:![[thin space (1/6-em)]](https://www.rsc.org/images/entities/char_2009.gif) 1. Finally, the NPU solution was obtained. Additionally, PEG-PU with BDO as a chain extender (BPU) was prepared for comparison. The process was similar to that of NPU, except that BDO was used as a chain extender. The synthetic routes and molar proportions to obtain NPU and BPU are shown in Fig. 1 and Table 1, respectively. The polymer solutions were placed on release paper and kept at room temperature for 2 weeks. Then, they were dried in a vacuum oven at 60 °C before characterization.
1. Finally, the NPU solution was obtained. Additionally, PEG-PU with BDO as a chain extender (BPU) was prepared for comparison. The process was similar to that of NPU, except that BDO was used as a chain extender. The synthetic routes and molar proportions to obtain NPU and BPU are shown in Fig. 1 and Table 1, respectively. The polymer solutions were placed on release paper and kept at room temperature for 2 weeks. Then, they were dried in a vacuum oven at 60 °C before characterization.
| Sample designation | PEG (mol) | MDI (mol) | MDEA (mol) | BDO (mol) |
|---|---|---|---|---|
| NPU-6000 | 0.003 | 0.006 | 0.003 | 0 |
NPU-10![[thin space (1/6-em)]](https://www.rsc.org/images/entities/char_2009.gif) 000 000 |
0.003 | 0.010 | 0.007 | 0 |
| BPU-6000 | 0.003 | 0.007 | 0 | 0.004 |
BPU-10![[thin space (1/6-em)]](https://www.rsc.org/images/entities/char_2009.gif) 000 000 |
0.003 | 0.011 | 0 | 0.008 |
2.3 Characterization
The phase change enthalpies and temperature of the samples were measured by DSC (Q-1000, TA Instruments, USA) under nitrogen atmosphere. The flow rate of N2 was maintained at 50 mL min−1. All samples (5–10 mg) were sealed in aluminum pans before heating and cooling between −40 and 120 °C at a rate of 10 °C min−1. The samples were heated from −40 to 120 °C and kept at 120 °C for 3 min to erase the thermal history and were then subsequently cooled to −40 °C. Then, the samples were reheated to 120 °C at the same heating rate. The crystallinity (Xc)1,19,20 of the samples was calculated according to eqn (1),
 | (1) |
 = 196.8 J g−1 represents 100% crystalline PEG,21,22 ΔHPEG-PU is the enthalpy of fusion of the second heating run of PEG-PU determined by DSC and SSC% is weight percentage of the soft segment.
WAXD was employed to study the crystallinity at room temperature using a Bruker D8 Advance X-ray diffractometer. The incident X-ray was Cu Kα radiation using a curved graphite monochromator. The Bragg's angle 2θ was set from 10° to 80° with a step of 0.02° at a speed of 4° min−1. The crystallinities of the samples were calculated using the method described by Young and Lovell.23 The areas of the X-ray diffraction curve corresponding to scattering from the crystalline phase (Ac) and the amorphous phase (Aa) could be separated, and the crystallinities of the samples could be calculated by the following equation:
| Xc (%) = Ac/(Aa + Ac) × 100% | (2) |
POM (Guangzhou Liss Optical Instrument Ltd, China) was used to observe the morphology of pure PEG and PEG-PU at room temperature. The prepared PEG-PU was characterized by FT-IR (EQUINOX-55, Bruker). Each sample was scanned 64 times at a resolution of 4 cm−1. All NMR experiments were carried out with a Bruker Avance 500 M spectrometer at room temperature at a resonance frequency of 500.13 MHz for 1H analysis. The 1H NMR spectra were obtained in approximately 30% solutions in deuterated dimethylsulphoxide (DMSO-d6, 99.5% deuterated). The DMSO-d6 peak at 2.50 ppm was used as the reference line. Cast films of PEG-PU were observed by AFM. Tapping-mode AFM was used to obtain phase imaging data on a Nanoscope IIIa AFM (Veeco, Santa Barbara, CA). The scans were taken in air at ambient temperature. The silicon probes had nominal lengths of 125 μm with force constants in the range of 10–130 N m−1 and were used with resonance frequencies of 204–497 kHz.
3. Results and discussion
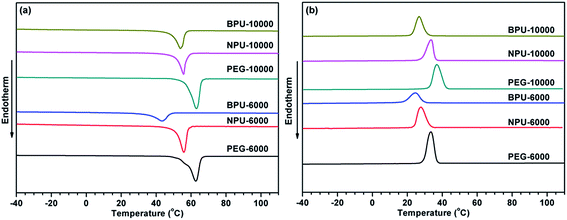
The energy stored in PEG-PU is mainly obtained from the latent heat resulting from a phase change in the soft segment. To investigate the phase change enthalpy of NPU, DSC was employed. The DSC curves of pure PEG, NPU and BPU are shown in Fig. 2, and the data of their enthalpy, transition temperature and crystallinity are summarized in Table 2. The results showed that the phase change enthalpy and crystallinity of PEG decreased after the hydroxyl group of PEG reacted with the diisocyanate moiety of MDI. The reduction implied that the interaction between soft and hard segments restricted the free movement of the soft segment and partially suppressed its arrangement and orientation.2,3,8,12 Consequently, the enthalpy and crystallinity of PEG-PU decreased by a certain degree.| Sample designation | PEG weight percent (wt%) | Phase transition | Enthalpy of phase transition ΔH (J g−1) | Peak transition temperature Tr (°C) | Xc (%) | ||
|---|---|---|---|---|---|---|---|
| Heating cycle | Cooling cycle | Heating cycle | Cooling cycle | ||||
| PEG-6000 | 100 | Solid–liquid | 178.6 | 167.1 | 62.0 | 33. 5 | 90.8 |
| NPU-6000 | 90 | Solid–solid | 136.5 | 128.0 | 55.8 | 27.7 | 77.0 |
| BPU-6000 | 90 | Solid–solid | 86.0 | 83.1 | 43.4 | 24.5 | 48.6 |
PEG-10![[thin space (1/6-em)]](https://www.rsc.org/images/entities/char_2009.gif) 000 000 |
100 | Solid–liquid | 187.2 | 176.1 | 63.1 | 36.9 | 95.1 |
NPU-10![[thin space (1/6-em)]](https://www.rsc.org/images/entities/char_2009.gif) 000 000 |
90 | Solid–solid | 137.5 | 129.8 | 55.7 | 33.6 | 77.6 |
BPU-10![[thin space (1/6-em)]](https://www.rsc.org/images/entities/char_2009.gif) 000 000 |
90 | Solid–solid | 114.9 | 111.2 | 52.8 | 28.8 | 64.9 |
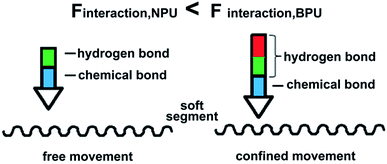
The DSC curves show that NPU and BPU underwent a phase transition. In addition, the phase change enthalpy and crystallinity of NPU were rather high compared with those of BPU (Table 2). The results suggested that the soft segments of NPU moved more freely and the interaction imposed on the soft segments by the hard segments in NPU was weaker than that in BPU. So Finteraction,NPU < Finteraction,BPU, where Finteraction,NPU and Finteraction,BPU are the interaction imposed on the soft segments in NPU and in BPU, respectively. The interaction mainly involves hydrogen bonds and chemical bonds (Fig. 3), Finteraction = Fhydrogen bond + Fchemical bond. Considering that the number of chemical bonds was invariant when the mole number of the reactive groups in NPU and BPU was the same (Fchemical bond,NPU = Fchemical bond,BPU), hydrogen bonding between the soft and hard segments of NPU was weaker than that of BPU (Fhydrogen bond,NPU < Fhydrogen bond,BPU). Therefore, it was speculated that the crystallinity and phase change enthalpy of NPU increased due to the weakened hydrogen bonding between the soft and hard segments.
Compared with other PUPCMs that use PEG-6000 as the soft segment,1,6,7 the phase transition enthalpy of NPU-6000 is 136.5 J g−1, which is close to the highest phase transition enthalpy of 138.2 J g−1 for hyperbranched PU.1 The phase change enthalpy of NPU-10![[thin space (1/6-em)]](https://www.rsc.org/images/entities/char_2009.gif) 000 is 137.5 J g−1, slightly lower than that of the cross-linked PU used in energy storage (152.97 J g−1),3 where the highest value is obtained by using PEG-10
000 is 137.5 J g−1, slightly lower than that of the cross-linked PU used in energy storage (152.97 J g−1),3 where the highest value is obtained by using PEG-10![[thin space (1/6-em)]](https://www.rsc.org/images/entities/char_2009.gif) 000 as the soft segment.2,3 The results indicated that NPU has quite good energy storage properties.
000 as the soft segment.2,3 The results indicated that NPU has quite good energy storage properties.
The crystallization was further investigated by XRD (Fig. 4). The crystallinity calculated by eqn (2) is shown in Table 3. The XRD patterns of NPU and BPU matched well with the standard data for PEG (JCPDS card No. 49-2097), suggesting that they possessed similar crystalline structures. The difference between the patterns was that the full width at half maximum (FWHM) of PEG-PU (NPU and BPU) was slightly larger than that of PEG, implying the lower crystallinity and smaller crystallite size of PEG-PU. One can deduce that the arrangement and orientation of the soft segments of PEG-PU were confined, and consequently the crystallization of the soft segments was suppressed.3,4,11 Thus, the enthalpy and crystallinity of PEG-PU were lower than those of PEG. While for PEG-PU, the crystallinity of NPU is higher than that of BPU. This meant that the soft segments in NPU were allowed to move more freely than those in BPU and that hydrogen bonding between the soft and hard segments was less restricted in NPU. These results are in good agreement with the DSC results discussed above.
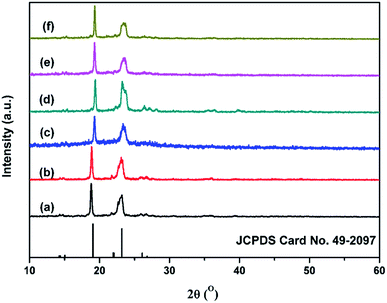 | ||
Fig. 4 WAXD spectra of (a) PEG-6000, (b) NPU-6000, (c) BPU-6000, (d) PEG-10![[thin space (1/6-em)]](https://www.rsc.org/images/entities/char_2009.gif) 000, (e) NPU-10 000, (e) NPU-10![[thin space (1/6-em)]](https://www.rsc.org/images/entities/char_2009.gif) 000, and (f) BPU-10 000, and (f) BPU-10![[thin space (1/6-em)]](https://www.rsc.org/images/entities/char_2009.gif) 000. The reference pattern is standard PEG (JCPDS Card No. 49-2097). 000. The reference pattern is standard PEG (JCPDS Card No. 49-2097). | ||
| Sample | PEG-6000 | NPU-6000 | BPU-6000 | PEG-10![[thin space (1/6-em)]](https://www.rsc.org/images/entities/char_2009.gif) 000 000 |
NPU-10![[thin space (1/6-em)]](https://www.rsc.org/images/entities/char_2009.gif) 000 000 |
BPU-10![[thin space (1/6-em)]](https://www.rsc.org/images/entities/char_2009.gif) 000 000 |
|---|---|---|---|---|---|---|
| 2θ (°) | 18.9, 23.1 | 18.9, 23.2 | 19.3, 23.5 | 19.2, 23.2 | 19.3, 23.5 | 19.3, 23.5 |
| Xc (%) | 70 | 55 | 30 | 75 | 55 | 40 |
To reveal the crystallization morphology, POM was used to investigate the micromorphology of pure PEG and PEG-PU, whose photos are shown in Fig. 5. It is clearly observed that the micrographs show a typical spherulitic morphology and cross-extinction patterns at room temperature, which suggested that both PEG and PEG-PU crystallized and their crystal structures were spherulite. The spherocrystallite size of PEG-PU was much smaller than that of pure PEG, indicating that the crystallization of the soft segments in PEG-PU was confined and that the crystalline perfection was destroyed. Thus, large spherulites could not form, and the crystallinity decreased, which resulted in the enthalpy and crystallinity decreasing. While the amount of spherulites in PEG-PU increased, the average radius of the spherulites decreased. Part of the hard segment in PEG-PU may act as a nucleating site for the formation of PEG spherulites and thus increase the amount of PEG spherulites. Moreover, the spherulites of NPU are clearly larger in diameter than those of BPU, corroborating that the soft segments of NPU moved more freely and the interaction between soft and hard segments in NPU was weaker than that in BPU.
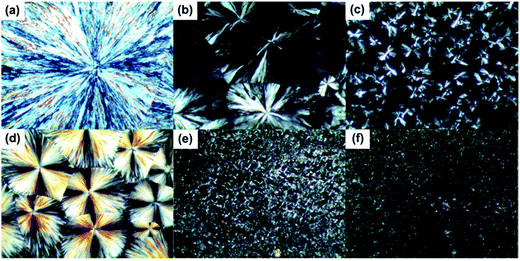 | ||
Fig. 5 POM images at 100× magnification of (a) PEG-6000, (b) NPU-6000, (c) BPU-6000, (d) PEG-10![[thin space (1/6-em)]](https://www.rsc.org/images/entities/char_2009.gif) 000, (e) NPU-10 000, (e) NPU-10![[thin space (1/6-em)]](https://www.rsc.org/images/entities/char_2009.gif) 000, and (f) BPU-10 000, and (f) BPU-10![[thin space (1/6-em)]](https://www.rsc.org/images/entities/char_2009.gif) 000. 000. | ||
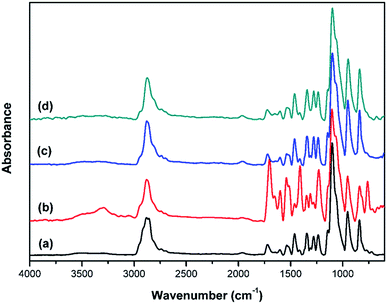
To investigate interactions in NPU, especially hydrogen bonding, NPU and BPU were characterized by FT-IR (Fig. 6). The absorption of NH⋯N hydrogen bond was not readily discussed here, because the –NH stretching generally have a strong dependence on the extinction coefficients of the absorption frequencies, which results in the conformational insensitivity of the –NH absorption, according to previous reports on polyamides and polyurethanes.24–27 Therefore, we concentrated on the carbonyl absorption region to obtain information about the NH⋯O![[double bond, length as m-dash]](https://www.rsc.org/images/entities/char_e001.gif) C hydrogen bond.
C hydrogen bond.
A reasonable estimate of the fraction of free and hydrogen-bonded carbonyl groups (C![[double bond, length as m-dash]](https://www.rsc.org/images/entities/char_e001.gif) O) can be obtained from curve fitting and by adjusting the areas (Fig. 7). Curve fitting of the carbonyl stretching region was performed using a peak fitting program. In addition, curve fitting was limited to the spectral data available between 1670 and 1770 cm−1 to minimize the effect of any absorption in the wings of the band envelope. The deconvolution procedure used a Gaussian amplitude function with a Fourier deconvolution/filtering algorithm. The complete curve-fitting analysis of the carbonyl stretching region of PEG-PU is given in Table 4. Two Gaussian bands, corresponding to free and hydrogen-bonded carbonyl groups, were employed in the curve-fitting procedure. The free carbonyl band (C
O) can be obtained from curve fitting and by adjusting the areas (Fig. 7). Curve fitting of the carbonyl stretching region was performed using a peak fitting program. In addition, curve fitting was limited to the spectral data available between 1670 and 1770 cm−1 to minimize the effect of any absorption in the wings of the band envelope. The deconvolution procedure used a Gaussian amplitude function with a Fourier deconvolution/filtering algorithm. The complete curve-fitting analysis of the carbonyl stretching region of PEG-PU is given in Table 4. Two Gaussian bands, corresponding to free and hydrogen-bonded carbonyl groups, were employed in the curve-fitting procedure. The free carbonyl band (C![[double bond, length as m-dash]](https://www.rsc.org/images/entities/char_e001.gif) O) is located at approximately 1720 cm−1, which is a result of the ether oxygen (–O–) of PEG competing with the carbonyl group to form a hydrogen bond with the N–H group (Fig. 8). The hydrogen-bonded carbonyl band at roughly 1700 cm−1 is regarded as evidence that the interurethane bonded hard segments (NH⋯O
O) is located at approximately 1720 cm−1, which is a result of the ether oxygen (–O–) of PEG competing with the carbonyl group to form a hydrogen bond with the N–H group (Fig. 8). The hydrogen-bonded carbonyl band at roughly 1700 cm−1 is regarded as evidence that the interurethane bonded hard segments (NH⋯O![[double bond, length as m-dash]](https://www.rsc.org/images/entities/char_e001.gif) C) reside in the interior of the hard domains.13,28,29 It can be seen in Table 4 that the peak area corresponding to C
C) reside in the interior of the hard domains.13,28,29 It can be seen in Table 4 that the peak area corresponding to C![[double bond, length as m-dash]](https://www.rsc.org/images/entities/char_e001.gif) O hydrogen bonding in NPU is larger than that in BPU. This meant that more C
O hydrogen bonding in NPU is larger than that in BPU. This meant that more C![[double bond, length as m-dash]](https://www.rsc.org/images/entities/char_e001.gif) O groups hydrogen bonded with NH (NH⋯O
O groups hydrogen bonded with NH (NH⋯O![[double bond, length as m-dash]](https://www.rsc.org/images/entities/char_e001.gif) C) in the hard domains in NPU and less ether oxygen groups (–O–) in the soft segments bonded with the NH groups (NH⋯O) in the hard segment in NPU compared with that in BPU. Therefore, the hydrogen bonding (NH⋯O) between the soft and hard segments of NPU were less intense than that of BPU. As shown in Fig. 3, the intensity of hydrogen bonding between the soft and hard segments of NPU decreased compared with that of BPU. Therefore, it is suspected that the soft segments of NPU gained sufficient mobility, and their molecular movement was quickened by breaking away from the hard segments in NPU. Moreover, interactions between the hard segments in NPU improved, which may cause more hard segments to aggregate, which enhances the purity and crystalline perfection of the soft domains. As a result, the soft segments of NPU crystallized more easily, and the crystalline region became bigger than that in BPU (proven by the POM results), which improved the enthalpy and crystallinity of NPU.
C) in the hard domains in NPU and less ether oxygen groups (–O–) in the soft segments bonded with the NH groups (NH⋯O) in the hard segment in NPU compared with that in BPU. Therefore, the hydrogen bonding (NH⋯O) between the soft and hard segments of NPU were less intense than that of BPU. As shown in Fig. 3, the intensity of hydrogen bonding between the soft and hard segments of NPU decreased compared with that of BPU. Therefore, it is suspected that the soft segments of NPU gained sufficient mobility, and their molecular movement was quickened by breaking away from the hard segments in NPU. Moreover, interactions between the hard segments in NPU improved, which may cause more hard segments to aggregate, which enhances the purity and crystalline perfection of the soft domains. As a result, the soft segments of NPU crystallized more easily, and the crystalline region became bigger than that in BPU (proven by the POM results), which improved the enthalpy and crystallinity of NPU.
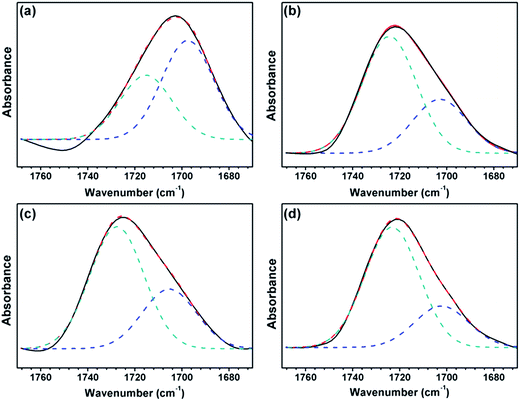 | ||
Fig. 7 FT-IR spectra of the carbonyl (C![[double bond, length as m-dash]](https://www.rsc.org/images/entities/char_e001.gif) O) stretching region of (a) BPU-6000, (b) NPU-6000, (c) BPU-10 O) stretching region of (a) BPU-6000, (b) NPU-6000, (c) BPU-10![[thin space (1/6-em)]](https://www.rsc.org/images/entities/char_2009.gif) 000, and (d) NPU-10 000, and (d) NPU-10![[thin space (1/6-em)]](https://www.rsc.org/images/entities/char_2009.gif) 000. 000. | ||
![[double bond, length as m-dash]](https://www.rsc.org/images/entities/char_e001.gif) O stretching region
O stretching region
| Sample | Free C![[double bond, length as m-dash]](https://www.rsc.org/images/entities/char_e001.gif) O O |
Hydrogen-bonded C![[double bond, length as m-dash]](https://www.rsc.org/images/entities/char_e001.gif) O O |
||
|---|---|---|---|---|
| Wavenumber (cm−1) | Area (%) | Wavenumber (cm−1) | Area (%) | |
| NPU-6000 | 1715 (ref. 32) | 39 | 1698 (ref. 24) | 61 |
| BPU-6000 | 1724 (ref. 24) | 68 | 1703 (ref. 13, 24 and 28) | 32 |
NPU-10![[thin space (1/6-em)]](https://www.rsc.org/images/entities/char_2009.gif) 000 000 |
1727 (ref. 17) | 67 | 1705 (ref. 24 and 28) | 33 |
BPU-10![[thin space (1/6-em)]](https://www.rsc.org/images/entities/char_2009.gif) 000 000 |
1723 (ref. 24) | 74 | 1702 (ref. 4) | 26 |
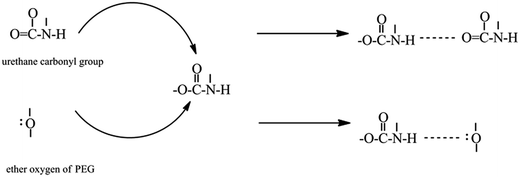 | ||
Fig. 8 Schematic representation of the ether oxygen (–O–) of PEG competing with the urethane carbonyl group (C![[double bond, length as m-dash]](https://www.rsc.org/images/entities/char_e001.gif) O) to form a hydrogen bond with the urethane N–H group. O) to form a hydrogen bond with the urethane N–H group. | ||
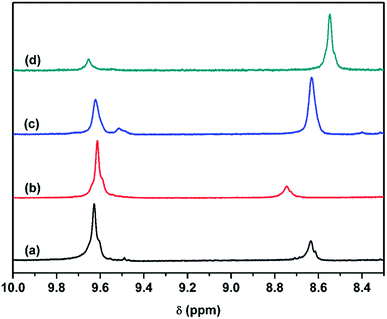
As reported by Yu and Lu,30,31 NH⋯N hydrogen bonding of two hard segments can occur between the NH groups and nitrogen atoms of MDEA when MDI was chain extended with MDEA. Further information on hydrogen bonding, especially the NH⋯N hydrogen bond, is clearly demonstrated in the 1H NMR spectra (Fig. 9). It was speculated that hydrogen bonding between NH and –O– (NH⋯O) in the soft segments may resonate at approximately 9.62 ppm, where the four samples have peaks. The resonance peak at 9.52 ppm (Fig. 9a and c) can be attributed to NH forming a hydrogen bond with the N atom of MDEA (NH⋯N) in the hard domain, and the peak at 8.63 ppm originates from NH forming a hydrogen bond with the C![[double bond, length as m-dash]](https://www.rsc.org/images/entities/char_e001.gif) O group (NH⋯O
O group (NH⋯O![[double bond, length as m-dash]](https://www.rsc.org/images/entities/char_e001.gif) C) in the hard segment.31 The resonance intensity of the NH⋯N hydrogen bond of NPU-6000 (Fig. 9a) is not as strong as that of NPU-10
C) in the hard segment.31 The resonance intensity of the NH⋯N hydrogen bond of NPU-6000 (Fig. 9a) is not as strong as that of NPU-10![[thin space (1/6-em)]](https://www.rsc.org/images/entities/char_2009.gif) 000 (Fig. 9c). The reason for this may be that the amount of tertiary amines of MDEA in NPU-6000 is lower (Table 1). Therefore, the interaction between MDI and MDEA is very weak in NPU-6000. 1H NMR results reveal that NH formed a hydrogen bond with the N atom of MDEA (NH⋯N).
000 (Fig. 9c). The reason for this may be that the amount of tertiary amines of MDEA in NPU-6000 is lower (Table 1). Therefore, the interaction between MDI and MDEA is very weak in NPU-6000. 1H NMR results reveal that NH formed a hydrogen bond with the N atom of MDEA (NH⋯N).
It can be inferred that the NH⋯O hydrogen bond between the soft and hard segments in NPU decreases, considering the increased amount of NH⋯O![[double bond, length as m-dash]](https://www.rsc.org/images/entities/char_e001.gif) C hydrogen bonds between the hard segments (proven by the FT-IR results) and the formation of NH⋯N hydrogen bonds between hard segments in NPU (proven by 1H NMR). Therefore, the interaction (depicted in Fig. 3) between hard and soft segments was weaker in NPU, which implied that the restricted movement of the soft segments by the hard segments decreased. NH⋯N and NH⋯O
C hydrogen bonds between the hard segments (proven by the FT-IR results) and the formation of NH⋯N hydrogen bonds between hard segments in NPU (proven by 1H NMR). Therefore, the interaction (depicted in Fig. 3) between hard and soft segments was weaker in NPU, which implied that the restricted movement of the soft segments by the hard segments decreased. NH⋯N and NH⋯O![[double bond, length as m-dash]](https://www.rsc.org/images/entities/char_e001.gif) C hydrogen bonds in the hard segments may favor aggregation of the hard segments as well as the purity and crystalline perfection of the soft domains. As a result, the crystallinity and phase change enthalpy of NPU increased.
C hydrogen bonds in the hard segments may favor aggregation of the hard segments as well as the purity and crystalline perfection of the soft domains. As a result, the crystallinity and phase change enthalpy of NPU increased.
AFM in tapping mode was used to study the influence of hydrogen bonding on the microphase structure of the soft and hard domains. In Fig. 10a–d, the light-colored areas represent the hard domains, while the dark-colored areas correspond to the soft polyether phase.4,33 It can be clearly seen that the soft and hard domains possessed homogeneous features and that the soft segments evidently separated from the hard segments in NPU, which enhanced the continuity and purity of the soft domains and decreased disturbances in regular arrangement of crystallization (Fig. 10a and c). The soft and hard segments aligned relatively uniformly, mostly showing a continuous layer or sheet structure with parallel arrangement. The soft domains in BPU were also clearly continuous, and the hard segments seemed to be islands or spots in the soft (Fig. 10b and d). Moreover, it seemed that mixed phases and transition phases also existed in BPU. From the AFM results, one can find that the agglomeration, arrangement and orientation of the soft segments were less suppressed in NPU than in BPU. It was suspected that NH⋯N hydrogen bonding induced aggregation of the hard segments away from the soft domains, leading to phase separation, which increased the opportunity for NH and C![[double bond, length as m-dash]](https://www.rsc.org/images/entities/char_e001.gif) O to encounter one another and form NH⋯O
O to encounter one another and form NH⋯O![[double bond, length as m-dash]](https://www.rsc.org/images/entities/char_e001.gif) C hydrogen bonds in the hard domains (shown in the FT-IR results). Thus, the soft segments gained sufficient mobility to form a parallel alignment. According to the results of DSC and AFM, it can be concluded that the ordered microstructure and microphase separation possibly improved the crystallizability of the soft segments. As a result, the crystallinity and enthalpy of NPU are higher than those of BPU.
C hydrogen bonds in the hard domains (shown in the FT-IR results). Thus, the soft segments gained sufficient mobility to form a parallel alignment. According to the results of DSC and AFM, it can be concluded that the ordered microstructure and microphase separation possibly improved the crystallizability of the soft segments. As a result, the crystallinity and enthalpy of NPU are higher than those of BPU.
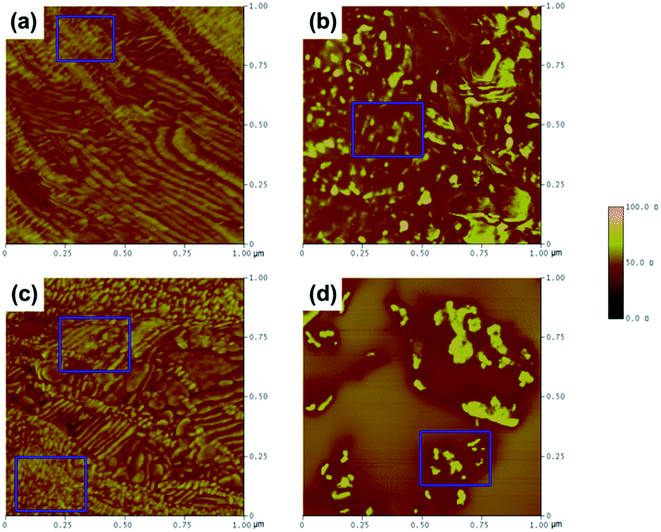 | ||
Fig. 10 AFM tapping mode phase images of the as-cast surface of PEG-PU: (a) NPU-6000, (b) BPU-6000, (c) NPU-10![[thin space (1/6-em)]](https://www.rsc.org/images/entities/char_2009.gif) 000, and (d) BPU-10 000, and (d) BPU-10![[thin space (1/6-em)]](https://www.rsc.org/images/entities/char_2009.gif) 000. The images are 1 μm × 1 μm, and the phase scale is 0–100°. 000. The images are 1 μm × 1 μm, and the phase scale is 0–100°. | ||
For NPU-6000 (Fig. 11a), it is illustrated that the soft and hard segments are both in continuous beaded-string distributions. These beaded strings were also parallel aligned, which confirmed that the soft segments gained enough mobility to increase in crystallinity. For NPU-10![[thin space (1/6-em)]](https://www.rsc.org/images/entities/char_2009.gif) 000 (Fig. 11c1), the size of the parallel-aligned beaded strings is smaller than that of NPU-6000. In addition, in some areas (Fig. 11c2), the soft segments aligned less regularly. This might be the reason why the crystal size of NPU-6000 is larger than that of NPU-10
000 (Fig. 11c1), the size of the parallel-aligned beaded strings is smaller than that of NPU-6000. In addition, in some areas (Fig. 11c2), the soft segments aligned less regularly. This might be the reason why the crystal size of NPU-6000 is larger than that of NPU-10![[thin space (1/6-em)]](https://www.rsc.org/images/entities/char_2009.gif) 000 (demonstrated by the POM results) and why the difference in enthalpy between NPU-6000 and PEG-6000 is lower than that between NPU-10
000 (demonstrated by the POM results) and why the difference in enthalpy between NPU-6000 and PEG-6000 is lower than that between NPU-10![[thin space (1/6-em)]](https://www.rsc.org/images/entities/char_2009.gif) 000 and PEG-10
000 and PEG-10![[thin space (1/6-em)]](https://www.rsc.org/images/entities/char_2009.gif) 000. For BPU-6000 (Fig. 11b), mixed phases of the soft and hard segments can be evidently found, although they align with regularity in some areas. For BPU-10
000. For BPU-6000 (Fig. 11b), mixed phases of the soft and hard segments can be evidently found, although they align with regularity in some areas. For BPU-10![[thin space (1/6-em)]](https://www.rsc.org/images/entities/char_2009.gif) 000 (Fig. 11d), the soft and hard phases separated more thoroughly, but the segments aligned less regularly than in PEG-6000. These results further indicated that the crystallinity and crystallite perfection of NPU increased due to regular arrangement of the soft segments and microphase separation of the hard and soft segments.
000 (Fig. 11d), the soft and hard phases separated more thoroughly, but the segments aligned less regularly than in PEG-6000. These results further indicated that the crystallinity and crystallite perfection of NPU increased due to regular arrangement of the soft segments and microphase separation of the hard and soft segments.
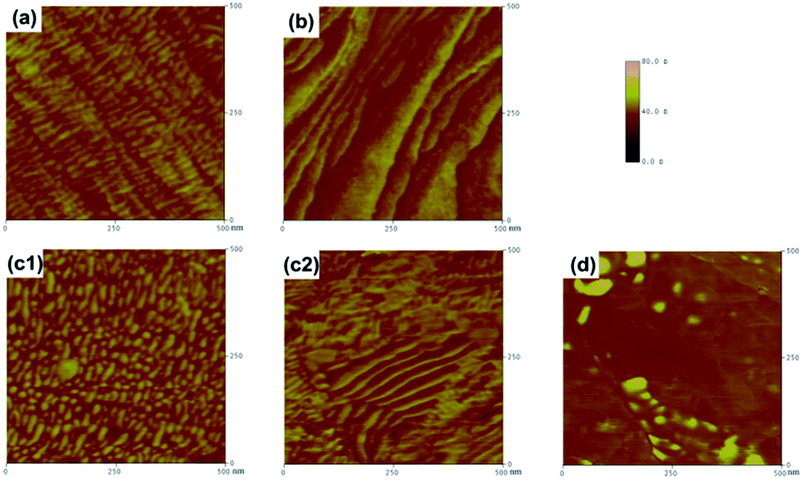 | ||
Fig. 11 AFM tapping mode phase images highlighted to delineate the detail of the boxed area in Fig. 10 for (a) NPU-6000, (b) BPU-6000, (c1) and (c2) NPU-10![[thin space (1/6-em)]](https://www.rsc.org/images/entities/char_2009.gif) 000, and (d) BPU-10 000, and (d) BPU-10![[thin space (1/6-em)]](https://www.rsc.org/images/entities/char_2009.gif) 000. The images are 500 nm × 500 nm, and the phase scale is 0–100°. 000. The images are 500 nm × 500 nm, and the phase scale is 0–100°. | ||
4. Conclusions
Adopting PEG as the soft segment and MDI and MDEA as the hard segment, NPU with different types of hydrogen bonds for high energy storage material was synthesized. NPU exhibited the high phase transition enthalpy, close to the reported highest value of branched PUPCM or cross-linked PUPCM. Higher crystallinity and larger spherulites were found in NPU than BPU. Phase-separated structures with parallel arrangement in the soft and hard domains of NPU were demonstrated. The intensity of the hydrogen bond between the soft and hard segments of NPU (NH⋯O) decreased, while that (NH⋯O![[double bond, length as m-dash]](https://www.rsc.org/images/entities/char_e001.gif) C) between two hard segments increased compared with that of BPU. The change of three types of hydrogen bonds benefits the crystallization and energy storage of NPU. The introduction of NH⋯N hydrogen bonds in NPU provide a new way to tune the phase transition enthalpy, which make it a promising candidate for thermal energy storage as a solid–solid PCM.
C) between two hard segments increased compared with that of BPU. The change of three types of hydrogen bonds benefits the crystallization and energy storage of NPU. The introduction of NH⋯N hydrogen bonds in NPU provide a new way to tune the phase transition enthalpy, which make it a promising candidate for thermal energy storage as a solid–solid PCM.
Acknowledgements
This work was supported by the National Natural Science Foundation of China [No. 51302194], the scientific fund of State Grid Corporation of China (No. 52170215000F), the Public Interest Project Foundation of Zhejiang [No. 2015C31130], and the National Training Program of Innovation and Entrepreneurship for Undergraduates [No. 201610351026].References
- Q. Cao and P. Liu, Eur. Polym. J., 2006, 42, 2931–2939 CrossRef CAS
.
- J.-C. Su and P.-S. Liu, Energy Convers. Manage., 2006, 47, 3185–3191 CrossRef CAS
.
- W.-D. Li and E.-Y. Ding, Sol. Energy Mater. Sol. Cells, 2007, 91, 764–768 CrossRef CAS
.
- Q. Meng and J. Hu, Sol. Energy Mater. Sol. Cells, 2008, 92, 1260–1268 CrossRef CAS
.
- Q. Cao, L. Liao and H. Xu, J. Appl. Polym. Sci., 2010, 115, 2228–2235 CrossRef CAS
.
- L. Liao, Q. Cao and H. Liao, J. Mater. Sci., 2010, 45, 2436–2441 CrossRef CAS
.
- P. Xi, Y. Duan, P. Fei, L. Xia, R. Liu and B. Cheng, Eur. Polym. J., 2012, 48, 1295–1303 CrossRef CAS
.
- K. Chen, X. Yu, C. Tian and J. Wang, Energy Convers. Manage., 2014, 77, 13–21 CrossRef CAS
.
- K. Chen, R. Liu, C. Zou, Q. Shao, Y. Lan, X. Cai and L. Zhai, Sol. Energy Mater. Sol. Cells, 2014, 130, 466–473 CrossRef CAS
.
- C. Chen, W. Liu, Z. Wang, K. Peng, W. Pan and Q. Xie, Sol. Energy Mater. Sol. Cells, 2015, 134, 80–88 CrossRef CAS
.
- L. Feng, J. Zheng, H. Yang, Y. Guo, W. Li and X. Li, Sol. Energy Mater. Sol. Cells, 2011, 95, 644–650 CrossRef CAS
.
- C. Alkan, E. Günther, S. Hiebler, Ö. F. Ensari and D. Kahraman, Sol. Energy, 2012, 86, 1761–1769 CrossRef CAS
.
- C. M. Brunette, S. L. Hsu and W. J. MacKnight, Macromolecules, 1982, 15, 71–77 CrossRef CAS
.
- M. M. Coleman, D. J. Skrovanek, J. Hu and P. C. Painter, Macromolecules, 1988, 21, 59–65 CrossRef CAS
.
- H. S. Lee, Y. K. Wang and S. L. Hsu, Macromolecules, 1987, 20, 2089–2095 CrossRef CAS
.
- C. B. Wang and S. L. Cooper, Macromolecules, 1983, 16, 775–786 CrossRef CAS
.
- L.-S. Teo, C.-Y. Chen and J.-F. Kuo, Macromolecules, 1997, 30, 1793–1799 CrossRef CAS
.
- Y. Fang, H. Kang, W. Wang, H. Liu and X. Gao, Energy Convers. Manage., 2010, 51, 2757–2761 CrossRef CAS
.
- Y.-L. Loo, R. A. Register, A. J. Ryan and G. T. Dee, Macromolecules, 2001, 34, 8968–8977 CrossRef CAS
.
- Y.-L. Loo, R. A. Register and A. J. Ryan, Macromolecules, 2002, 35, 2365–2374 CrossRef CAS
.
- Y. Hu, M. Rogunova, V. Topolkaraev, A. Hiltner and E. Baer, Polymer, 2003, 44, 5701–5710 CrossRef CAS
.
- C. Campbell, K. Viras, M. J. Richardson, A. J. Masters and C. Booth, Makromol. Chem., 1993, 194, 799–816 CrossRef CAS
.
- R. J. Young and P. A. Lovell, Introduction to Polymers, Chapman & Hall, London, Second edn, 1991 Search PubMed
.
- M. M. Coleman, K. H. Lee, D. J. Skrovanek and P. C. Painter, Macromolecules, 1986, 19, 2149–2157 CrossRef CAS
.
- D. J. Skrovanek, P. C. Painter and M. M. Coleman, Macromolecules, 1986, 19, 699–705 CrossRef CAS
.
- D. J. Skrovanek, S. E. Howe, P. C. Painter and M. M. Coleman, Macromolecules, 1985, 18, 1676–1683 CrossRef CAS
.
- M. M. Coleman, D. J. Skrovanek, S. E. Howe and P. C. Painter, Macromolecules, 1985, 18, 299–301 CrossRef CAS
.
- E. Yılgör, İ. Yılgör and E. Yurtsever, Polymer, 2002, 43, 6551–6559 CrossRef
.
- X. Yu, M. R. Nagarajan, C. Li, P. E. Gibson and S. L. Cooper, J. Polym. Sci., Part B: Polym. Phys., 1986, 24, 2681–2702 CrossRef CAS
.
- X. Yu, M. R. Nagarajan, T. G. Grasel, P. E. Gibson and S. L. Cooper, J. Polym. Sci., Part B: Polym. Phys., 1985, 23, 2319–2338 CrossRef CAS
.
- X. Lu, Y. Wang and X. Wu, Polymer, 1992, 33, 958–962 CrossRef CAS
.
- S.-L. Huang, R.-C. Ruaan and J.-Y. Lai, J. Membr. Sci., 1997, 123, 71–79 CrossRef CAS
.
- A. Aneja and G. L. Wilkes, Polymer, 2003, 44, 7221–7228 CrossRef CAS
.
| This journal is © The Royal Society of Chemistry 2017 |

