DOI:
10.1039/C6RA28839A
(Paper)
RSC Adv., 2017,
7, 10928-10938
Correlation between magnetic and electric properties based on the critical behavior of resistivity and percolation model of La0.8Ba0.1Ca0.1MnO3 polycrystalline
Received
30th December 2016
, Accepted 31st January 2017
First published on 9th February 2017
Abstract
We investigated the magneto-electrical properties of a La0.8Ba0.1Ca0.1MnO3 polycrystalline sample, prepared by the polymerization-complex sol–gel method. Comparison of experimental data with the theoretical models showed that in the metal-ferromagnetic region, the electrical behavior of the sample is quite well described by a theory based on electron–electron, electron–phonon and electron–magnon scattering and Kondo-like spin dependent scattering. For the high temperature paramagnetic insulating regime, the adiabatic small polaron hopping model was found to fit well with the experimental curves. The estimated critical exponents, obtained from resistivity, were (β = 0.516 ± 0.013, γ = 1.181 ± 0.005 and α = 0.004). They were very close to those predicted by the mean-field model. These results were in good agreement with the analysis of the critical exponents from magnetization measurements.
1. Introduction
Mixed valence manganites of a general formula Tr1−xAxMnO3, where Tr = rare earth and A = Sr, Ca, Ba, etc. have been widely studied to understand the physics behind their properties and to explore their practical applications.1–3 La1−xCaxMnO3 compounds have drawn much attention because of their enormous magnetoresistance (MR) and magnetocaloric effect (MCE). This makes them good candidates for a wide variety of applications.4–8 As regards the La1−xCaxMnO3 compounds, they have a disadvantage that their Curie temperatures, TC, are well below room temperature. On the other side, doping Ca sites with large ions, for example Pb, Ba and Sr, has been explored by several researchers.9–11 The general observation is that partial doping leads to an enhancement in TC. This makes them better candidates for applications near room temperatures. The substitution of Ca by Ba is interesting as the difference between ionic sizes of the two elements is significantly large and TC is observed to increase with increasing Ba content.12–14 Also, manganese oxides exhibit a metal–semiconductor transition (M–SC) accompanied by a ferromagnetic (FM)–paramagnetic (PM) transition near TC. The metallic behavior is usually described in terms of electron scattering process and electron–phonon (e–p) interaction.8 In the semiconductor region, the transport mechanism is explained by 3D Mott's variable range hopping (VRH) model, small polaron hopping (SPH) model and by the adiabatic small polaron hopping mechanism.15 Some models can explain the transport mechanism in manganites. However, most of them are only applied to fit the prominent change of the electrical resistivity curves (ρ(T)) in a finite temperature region (above or below TC). Such a model supposes that the materials are composed of PM and FM regions. Following this mechanism, ρ(T) at any temperature, is determined by the change of the volume fractions of both regions. An important part of the work on manganites aimed to present the effect of MR. However, the study of the anomalies of the various thermo physical properties, like the specific heat in the vicinity of the magnetic phase transition, with investigating the values of the universal critical parameters, has not been given the sufficient importance in research projects done on manganites. As far as manganites are concerned, there have been a lot of experiments to estimate the critical exponents of FM manganites. Systems showing a second order metal insulator phase transition obey one of the common universality classes. By contrast, the experimental estimates of the critical exponents are still controversial including those for short-range Heisenberg interaction,16,17 the mean-field values17,18 and those which cannot be classified into any universality class ever known.19
Previously,20 we have investigated in detail the structural, magnetic and MCE of our sample. In this paper, we intend to study the dependence of the electrical resistivity properties as a function of the La0.8Ba0.1Ca0.1MnO3, volume fraction, f, which is analyzed in the framework of the percolation theory. A percolation model based on the mixed phase consisting of itinerant electrons and localized magnetic polarons has been proposed to explain the observed results. We have also determined the critical temperature TC and the critical parameters β and γ. Then, we tried to investigate the critical behavior in La0.8Ba0.1Ca0.1MnO3 at its metal–semiconductor transition via the measurements of resistivity. The values of these exponents obtained from resistivity are very close to those predicted by the mean-field model.
2. Experimental details
The nano-polycrystalline sample of a nominal composition La0.8Ba0.1Ca0.1MnO3 was prepared according to the polymerization complex sol–gel method. The detailed basic physical properties are reported in ref. 20. The crystal structure of the final product was checked by X-ray diffraction, which confirmed that the sample having a single phase, crystallized in the rhombohedral structure with R![[3 with combining macron]](https://www.rsc.org/images/entities/char_0033_0304.gif) c space group.20 In the present study the electrical transport properties ρ(T) were measured by a standard four-probe method using physical property measurement system (PPMS, Quantum Design).
c space group.20 In the present study the electrical transport properties ρ(T) were measured by a standard four-probe method using physical property measurement system (PPMS, Quantum Design).
3. Results and discussions
3.1. Electrical properties
First, we discuss electrical resistivity results at an applied magnetic field of 0 to 5 T, with steps of 0.5 T. This is shown in Fig. 1. Taking the sign of the temperature derivative of dρ/dT as a criterion, we found that samples exhibit a metallic behavior dρ/dT > 0 at a low temperature (T < TM–SC) and become semiconductor like dρ/dT above the temperature TM–SC, where TM–SC is the temperature of the maximum value of resistivity. The transition temperature TM–SC occurs at TM–SC = 303 K, which is close to its TC = 282 K,20 indicating strong correlations between the magnetic and electrical properties in our sample. Therefore, we can define the FM-metallic-like and the PM-semiconductor-like behaviors as a function of temperature. It is also clearly seen that in the vicinity of TM–SC, resistivity decreases with the increase of the applied magnetic field. The values of TM–SC are found to move toward a high temperature side with increasing the magnetic field. The observed behavior may be attributed to the fact that the applied magnetic field suppresses the electrical resistivity by several orders. This is attributed to the induced magnetic ordering of the localized t2g spins and delocalization of charge carriers on the application of magnetic field.21 Due to this ordering, the FM metallic state may suppress the magnetic insulating regime. We can note that the electrical properties of manganites are generally understood according to the double exchange theory (DE).22 In this model, the Mn3+–O–Mn4+ coupling is responsible of the conduction mechanisms from the half-filled to the empty eg orbital. As a result, the conduction electrons are completely polarized inside the magnetic domains and are easily transferred between the pairs Mn3+ (3d4, ![[thin space (1/6-em)]](https://www.rsc.org/images/entities/char_2009.gif) t32g
t32g![[thin space (1/6-em)]](https://www.rsc.org/images/entities/char_2009.gif) ↑
↑![[thin space (1/6-em)]](https://www.rsc.org/images/entities/char_2009.gif) e1g↑,
e1g↑, ![[thin space (1/6-em)]](https://www.rsc.org/images/entities/char_2009.gif) S = 2) and Mn4+ (3d3,
S = 2) and Mn4+ (3d3,![[thin space (1/6-em)]](https://www.rsc.org/images/entities/char_2009.gif) t32g
t32g![[thin space (1/6-em)]](https://www.rsc.org/images/entities/char_2009.gif) ↑
↑![[thin space (1/6-em)]](https://www.rsc.org/images/entities/char_2009.gif) e0g,
e0g, ![[thin space (1/6-em)]](https://www.rsc.org/images/entities/char_2009.gif) S = 3/2) via oxygen.
S = 3/2) via oxygen.
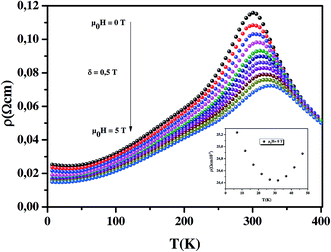 |
| | Fig. 1 Temperature dependence of the resistivity under different applied magnetic fields from 0 to 5 T, with steps of 0.5 T. The inset shows temperature dependence of electrical resistivity at very low temperature for our sample. | |
In what follows, we analyze the electrical resistivity data using different theoretical models in order to understand the contribution of different parameters to the conduction mechanism in different temperature regimes. The quality of fitting was judged by the squared linear correlation coefficients (R2). It is important to mention that the obtained values of R2 for our sample are high value.
3.1.1. T < TM–SC region. In the low-temperature, the transport properties fully show the metallic state by fitting with the following equation, which is generally used to fit the electrical resistivity data in the case of manganites:23,24| | |
ρ(T) = ρ0 + ρ2T2 + ρ4.5T4.5
| (1) |
where ρ0 is the residual resistivity arising from the temperature independent processes such as domain wall, grain boundary and vacancies, ρ2T2 (ref. 25,26) indicates electron–electron (e–e) scattering,27 whereas ρ4.5T4.5 is a combination of e–e, electron–magnon (e–m) and e–p scattering processes.28,29 However, as this model is not in a position to explain the low temperature upturn in resistivity (seen in the inset of Fig. 1), we concluded that along with the above mentioned phenomena, some other factors might have also contributed to the low temperature behavior.30Based on the strong correlated effect in manganites, one has to consider the e–e interaction, which causes a T1/2 dependence of resistivity in a disordered system.31
Therefore, in order to explain the origin of the low temperature resistivity upturn, the experimental data were analyzed by taking into account the Kondo-like scattering, e–e interaction and e–p interaction. To represent these phenomena, two more terms were included in eqn (1) and the new equation is:
| | |
ρ(T) = ρ0 − ρ1/2T1/2 + ρ2T2 + ρ4.5T4.5 + ρ5T5
| (2) |
where
ρ1/2T1/2 is in relation with e–e coulombic interactions and
ρ5T5 is due to e–p interactions. Plots of the best fits to the data are shown by red solid lines in the main panels of
Fig. 2. The best fitting parameters are listed in
Table 1.
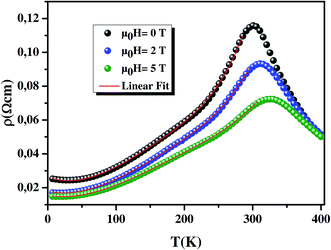 |
| | Fig. 2 The plots of the electrical resistivity ρ(T) vs. T at 0, 2 and 5 T. The red solid line in these plots represents the best fit of experimental data in the metallic regime below (TM–SC) with eqn (2). | |
Table 1 The best fit parameters obtained from the experimental resistivity data of the metallic behavior (below TM–SC)
| μ0H(T) |
0 |
1 |
2 |
3 |
4 |
5 |
| ρ0 (Ω cm) |
0.02854 |
0.02442 |
0.01891 |
0.01741 |
0.01689 |
0.01630 |
| ρ1/2 (10−4 Ω cm K−1/2) |
10.70100 |
9.46491 |
5.71586 |
4.73059 |
4.59980 |
4.52850 |
| ρ1/2 (10−7 Ω cm K−2) |
1.62043 |
1.52213 |
1.29249 |
1.18636 |
1.12878 |
1.06250 |
| ρ4.5 (10−13 Ω cm K−4.5) |
−3.72372 |
−3.24886 |
−2.31117 |
−1.98137 |
−1.81468 |
−1.65279 |
| R2 (×100) |
99.899 |
99.954 |
99.914 |
99.887 |
99.901 |
99.997 |
3.1.2. T > TM–SC region. The electrical behavior of our sample, in the semiconductor region can explained using two different models viz., SPH model and VRH model.32 The high temperature region above θD/2 (where θD is Debye's temperature33) is analyzed using the SPH model, whereas below θD/2 and above TM–SC, it is analyzed using VRH model.Firstly, we discuss the SPH model which is given by the equation:34
| |
 | (3) |
where
A′ = [
kB/
nphNe2R2C(1 −
C)exp(2
aR)],
kB is Boltzmann's constant,
N is the number of ion sites per unit volume,
R is the average intersite spacing obtained from the relation
R = (1/
N)
1/3,
C is the fraction of sites occupied by the polaron, a is the electron wave function decay constant,
nph is the optical phonon frequency (
nph =
kBθD/
h),
T is the absolute temperature and
Ea is the activation energy. The temperature dependent polaron hopping, verified by calculating
θD/2, presents the deviation from linearity which occurs in the ln(
ρ/
T)
vs. T−1 plot. For the validity of this model, a plot of ln(
ρ/
T)
vs. T−1 is expected to be a straight line, shown in
Fig. 3(a). From the interception and the slope of the linear curve above
θD/2,
A′ and
Ea are estimated, respectively, using
eqn (3) (
Table 2). The value of
A′ increases with the increase in the magnetic field, which facilitates the hopping of the electrons to the nearby neighboring states. Also, we can see that
θD increases, whereas
Ea decreases gradually as the magnetic field increases. This can be explained on the basis of the delocalization of e
g electrons due to the application of magnetic field.
35
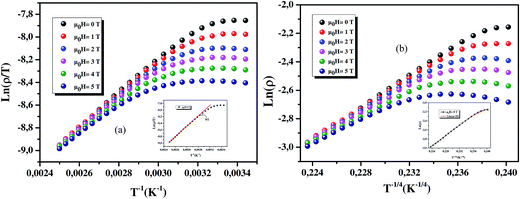 |
| | Fig. 3 (a) Plot ln(ρ/T) versus (T−1) for sample in the presence and the absence of the magnetic field. Solid lines are the best fit to eqn (3). The inset of (a) shows as an example of the ln(ρ/T) versus (T−1) at 0 T. (b) Plot ln(ρ) versus (T−1/4) for sample in the presence and the absence of the magnetic field. Solid lines are the best fit to eqn (4). The inset of (b) shows as an example of the ln(ρ) versus (T−1/4) at 0 T. | |
Table 2 The best fit parameters obtained from the experimental resistivity data for semi-conductor behavior (above TM–SC)
| μ0H(T) |
0 |
1 |
2 |
3 |
4 |
5 |
| θD/2 |
650.813 |
660.767 |
670.734 |
680.765 |
690.661 |
710.576 |
![[thin space (1/6-em)]](https://www.rsc.org/images/entities/char_2009.gif) |
| SPH |
| A′ (10−6 Ω cm) |
2.73707 |
3.34612 |
3.373235 |
4.33607 |
5.06174 |
5.37541 |
| Ea/kB (K) |
1541.19162 |
1456.73030 |
1420.23404 |
1361.11196 |
1292.74212 |
1262.75730 |
| R2 (×100) |
99.838 |
99.974 |
99.954 |
99.883 |
99.931 |
99.897 |
![[thin space (1/6-em)]](https://www.rsc.org/images/entities/char_2009.gif) |
| VRH |
| R2 (×100) |
91.721 |
80.962 |
56.680 |
40.237 |
19.512 |
1.168 |
To verify the conduction mechanism in the low temperature region (T < θD/2), we fitted the temperature dependence of electrical resistivity using VRH model. The VRH model is applicable when the thermal energy is insufficient to excite the electrons to hop to their nearest neighbors. It is more favorable for the electrons to hop further to find a site with a smaller potential difference. The VRH model for three dimensional systems is given by:27
| |
ρ = ρ0![[thin space (1/6-em)]](https://www.rsc.org/images/entities/char_2009.gif) exp(T0/T)1/4 exp(T0/T)1/4
| (4) |
where
T0 is the characteristic temperature which is expressed as
T0 = (16
α3/
kBN(
EF)),
α which is the inverse of the localization length of the trapped charge carriers, was taken as 2.22 nm
−1,
27 N(
EF) is the density of state at Fermi level and
ρ0 is the residual resistivity. Here,
Fig. 3(b) shows ln(
ρ)
versus (
T−1/4) for our sample in the presence and the absence of the magnetic field. Solid lines are the best fit to
eqn (4). The fitting parameters in this model are listed in
Table 2. We can see weak values of the square linear correlation coefficients (
R2). This is due to the invalidity of VRH model, to describe the
TM–SC <
T <
θD/2 region.
Both models describe quite well our results in the semiconductor behavior, although the SPH model gives the best square linear correlation coefficients (R2). We may conclude then, that the transport properties are dominated by the SPH mechanism.
3.2. Percolation model
None of the mentioned models can explain the significant change in ρ vs. T curves near TM–SC. Later, Goodenough36 showed that in CMR materials, a metallic conductivity exists in the FM regions and a conductivity semiconductor at above TM–SC in the PM regions. Recently, based on the phase segregation mechanism Li et al.37 have suggested that the FM and PM group co-exist in MR regions (percolation model) and at any temperature, ρ is determined by the variation volume fractions of the two regions. Under this scenario, a complete expression for resistivity can be written as follows:37| | |
ρ = ρFMf + (1 − f)ρPM
| (5) |
where f and (1 − f) are the volume concentrations of the FM domains and PM regions, respectively. The volume concentrations of FM and PM phases satisfy Boltzman's distribution:| |
 | (6) |
and| |
 | (7) |
where ΔU is the energy difference between FM and PM states, it may be expressed as:| |
 | (8) |
TmodC means a temperature in the vicinity of which the resistivity reaches a maximum value.38 U0 is taken as the energy difference for temperatures well below TmodC.37
From eqns (6)–(8), one can find that:
| f = 0 for T ≫ TmodC, f = 1 for T ≪ TmodC and f = fc = ½ at T = TmodC.37,38 |
| 1 − f = 1 for T ≫ TmodC, 1 − f = 0 for T ≪ TmodC and 1 − f = fc = ½ at T = TmodC.37,38 |
where
fC is the percolation threshold. To conclude, when
f is less than
fC, the sample remains semiconducting and when
f is larger than
fC, it becomes metallic. Hence the complete expression describing the resistivity dependence on the temperature can be written in the form:
| |
 | (9) |
The total (ρ) can be represented as:
| |
 | (10) |
Fig. 4 shows the simulated and the experimental results for the ρ(T) curve obtained in zero field and with an applied magnetic field 2 T and 5 T for La0.8Ba0.1Ca0.1MnO3. The best fit parameters are listed in Table 3. It is worth mentioning that this model is suitable to explain the electrical transport of La0.8Ba0.1Ca0.1MnO3. From Table 3, the reduction in ρ2 and ρ9/2 could be attributed to the decrease in electron spin fluctuations in the presence of a magnetic field. One also can notice the decrease of Ea and U0 with increasing the magnetic field. This is due to the spin attempt to align along the magnetic field, which favors the conduction and decrease the ability of charge localization. Morever, the electrons jumping requires less energy. This implies that eg electron hopping becomes easier and needs less energy. TmodC shows an increasing behavior as a function of the applied field due to the enhancement of metallic tendencies which shifts TM–SC to higher values and so TmodC from 299.661 to 327.863 K, respectively at an applied magnetic field of 0 and 5 T.
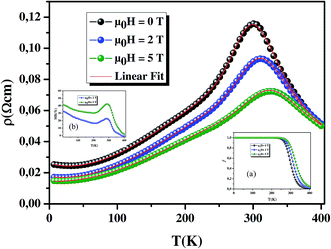 |
| | Fig. 4 The temperature dependence of resistivity under various magnetic fields of 0, 2 and 5 T, as an example. Symbols are the experimental data and solid lines are the resistivity calculated using eqn (10). The inset (a) shows the temperature dependence of FM phase volume fraction f for our sample under applied magnetic field of 2 and 5 T. The inset (b) shows the variation of MR vs. T curves. | |
Table 3 Obtained parameters corresponding to the best fit to eqn (9) of the experimental data of our sample at 0 to 5 T, with steps of 1 T
| U0H(T) |
0 |
1 |
2 |
3 |
4 |
5 |
| ρ0 (Ω cm) |
0.02755 |
0.02309 |
0.01793 |
0.01635 |
0.01543 |
0.01469 |
| ρ1/2 (10−4 Ω cm K0.5) |
8.11099 |
6.14486 |
3.28384 |
1.66104 |
1.30253 |
1.08611 |
| ρ2 (10−7 Ω cm K−2) |
13.239 |
11.9077 |
10.5331 |
9.45765 |
8.85296 |
8.21711 |
| ρ4.5 (10−13 Ω cm K−4.5) |
−9.40284 |
−6.09755 |
−4.64322 |
−3.98003 |
−3.62861 |
−3.27784 |
| ρ5 (10−15 Ω cm K−5) |
35.6269 |
18.6148 |
13.1506 |
11.2931 |
9.52693 |
7.1674 |
| ρ0 (10−6 Ω cm) |
2.35031 |
2.91272 |
3.17748 |
3.64326 |
4.14958 |
4.72169 |
| Ea/kB (K) |
1592.62715 |
1515.48663 |
1476.0954 |
1420.12229 |
1363.35483 |
1315.27449 |
| U0/kB (K) |
5667.05496 |
5601.49997 |
5565.38411 |
5522.66875 |
5475.50923 |
5427.73582 |
| R2 (×100) |
99.838 |
99.974 |
99.954 |
99.883 |
99.931 |
99.897 |
The inset (a) of Fig. 4 shows the temperature dependence of the volume fraction of the FM phase f in a zero magnetic field and in an applied magnetic field of 2 T and 5 T. When the temperature is considerably below TC, f is close to 1, which means that the sample is completely FM. By increasing the temperature, f decreases slowly and reaches the percolation threshold fC = 0.5 at TmodC. In the high temperature region, the value of f becomes equal to zero, which means that the sample is completely PM. Increasing the applied magnetic field value will certainly enhance f value due to the enhancement of FM metallic interactions attributed to zener DE mechanism.
3.3. Study of magnetoresistance
The coexistence of ferromagnetism and metallic conductivity causes the relatively strong effect of magnetoresistance (MR). The MR (T) at a given temperature is defined as:| |
 | (11) |
where ρ(0) is the resistivity under a zero magnetic field and ρ(μ0H) is the resistivity under an applied field of 2 and 5 T.
The MR dependence on the temperature is shown in the inset (b) of Fig. 4 for the studied sample at different applied magnetic fields (2 and 5 T), over a temperature range of 4–400 K. We can see that our results could even be better that those found in ref. 39–43.
3.4. Critical parameters
3.4.1. Critical parameters determined from magnetization data. To analyze the nature of the magnetic transition in La0.8Ba0.1Ca0.1MnO3 sample, the critical behavior near TC is analysed. According to the scaling hypothesis, a continuous phase transition near the critical temperature TC shows a power law dependence of spontaneous magnetization (MS(T)), and inverse initial susceptibility (χ0−1(T)) on the reduced temperature with a set of interdependent critical exponents β, γ and δ. The mathematical definitions of the critical exponents from magnetization measurements are given by the following relations:44–47| | |
MS(T) = M0|ε|_β, ε < 0, T < TC
| (12) |
| |
χ0−1(T) = (h0/M0)εγ, ε > 0, T > TC![[thin space (1/6-em)]](https://www.rsc.org/images/entities/char_2009.gif)
| (13) |
| | |
M = DH1/δ, ε = 0, T = TC
| (14) |
where β is the spontaneous magnetization exponent, γ is the isothermal magnetic susceptibility exponent, δ is the critical isotherm exponent, M0 and h0 are the critical amplitudes and ε = (T − TC)/TC is the reduced temperature.Therefore, to obtain the right values of β and γ exponents, we have included the analysis of the critical exponents using a modified Arrott plot (MAP) expression. This method was based on the Arrott–Noakes equation of state:48
| | |
(μ0H/M)1/γ = a(T − TC)/T + bM1/β
| (15) |
where
a and
b are considered to be constants in the mean-field theory, values of
β = 0.5 and
γ = 1 should generate the regular Arrott's plots,
M2 vs. μ0H/
M.
The (M)1/β vs. (μ0H/M)1/γ Arrott–Noakes plots are constructed for our compound using different kinds of trial exponents. The curves are displayed in Fig. 5(a–d) mean-field model (β = 0.5, γ = 1), tricritical mean-field model (β = 0.25, γ = 1), 3D-Heisenberg model (β = 0.365, γ = 1.336) and 3D-Ising model (β = 0.325, γ = 1.241), respectively. To distinguish which model better describes this system, we calculated the so-called relative slope (RS) defined at the critical point: RS = S(T)/S(TC). The S(T) and S(TC) are the slope for a given T close to TC and the slope at T = TC, successively. The considered TC = 282 K is determined from the Arrott–Nokaes curves, where at T = 282 K, the curves M1/β vs. (μ0H/M)1/γ for our model is a linear curve crossing the origin. If the MAP shows a series of absolute parallel lines, the relative slope of the most satisfactory model should be kept to 1 irrespective of temperatures.49 RS vs. T curves for all models are shown in Fig. 6. One can see that the mean field model is the best one for the determination of the critical exponents for our sample. Following a standard procedure, the spontaneous magnetization vs. temperature, would be obtained from the linear extrapolation in the high magnetic field region for the isotherms to the coordinate axis of M1/β. Similarly, χ0−1(T), is also obtained from the intersections with the (μ0H/M)1/γ axis. By fitting the MS(T) and χ0−1(T) data to eqns (12) and (13), respectively, new values of β and γ will be obtained. These values are then re-introduced to the scaling of the MAP. After several times of such scaling, β and γ converge to their optimal values. Concurrently, the Curie temperatures associated with the fitting of the MS(T) and χ0−1(T) data to eqns (12) and (13), respectively, are also determined MS vs. T and χ0−1(T) vs. T are plotted in Fig. 7. Eqn (12) gives the value of β = 0.491 ± 0.014 with TC = 280.501 ± 0.165 K and eqn (13) gives the value of γ = 1.151 ± 0.064 with TC = 282.123 ± 0.527 K.
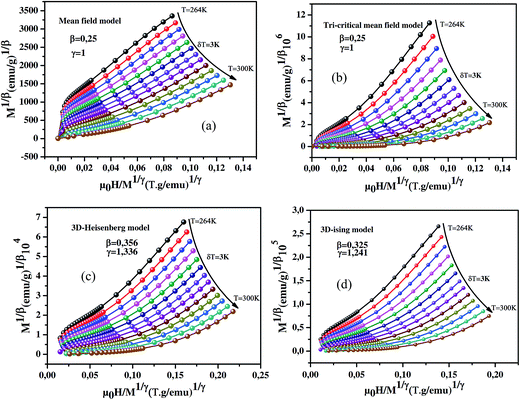 |
| | Fig. 5 MAP for our sample: isotherms of M1/β vs. (μ0H/M)1/γ; (a) mean field model (β = 0.25, γ = 1), (b) tri-critical mean-field model (β = 0.25, γ = 1), (c) 3D-Heisenberg model (β = 0.365, γ = 1.336) and (d) 3D-Ising model (β = 0.325, γ = 1.24). | |
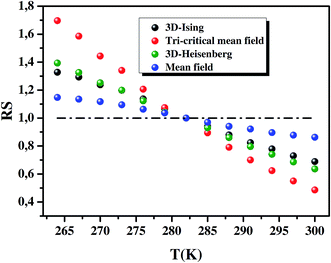 |
| | Fig. 6 RS of our sample as a function of temperature defined as RS = S(T)/S(TC), using several methods. | |
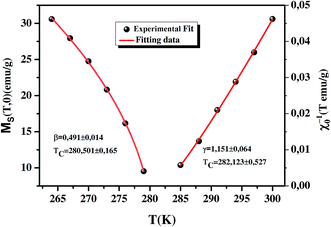 |
| | Fig. 7 Temperature dependence of the spontaneous magnetization MS(T, 0) (left) and the inverse initial susceptibility χ0−1(T) (right), with the fitting curves based on the power laws. | |
Such critical exponents and TC can be obtained more accurately by analyzing the MS(T) and χ0−1(T) with the Kouvel–Fisher (KF) method:50,51
| | |
MS(T)/[dMS(T)/dT] = (T − TC)/β
| (16) |
| | |
χ0−1(T)/[dχ0−1(T)/dT] = (T − TC)/γ
| (17) |
The plots of MS(T)/[dMS(T)/dT] vs. T and χ0−1(T)/[dχ0−1(T)/dT]vs. T should yield straight lines with slopes of 1/β and 1/γ, respectively, and the intercepts on the axes are equal to TC. The linear fitting to the plots following the KF method gives β = 0.481 ± 0.020 with TC = 280.442 ± 0.428 K and γ = 1.181 ± 0.042 with TC = 281.823 ± 0.413 K (Fig. 8). Obviously, the obtained values of the critical exponents and TC, using the KF method, are in agreement with that using the MAP of the mean-field model. Concerning the value of δ, it can be directly obtained from plotting the critical isotherm at TC. In Fig. 9, the M vs. μ0H curve at 282 K was chosen as the critical isotherm based on the previous discussion. The inset of Fig. 9 shows the same curve M vs. μ0H on a ln–ln scale. The high-field region of the data is fitted by a straight line with a slope 1/δ using eqn (14). The value of δ is equal to 3.341 ± 0.003 in our case.
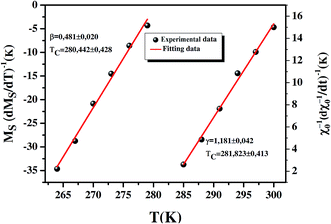 |
| | Fig. 8 KF plots for the spontaneous magnetization (left) and the inverse initial susceptibility χ0−1(T) (right). | |
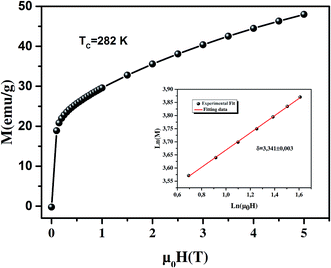 |
| | Fig. 9 Isothermal M(TC, μ0H) plot for our sample at TC = 282. The inset shows the same plot in ln–ln scale and the solid line is the linear fit following eqn (14), for the determination of the critical exponent δ. | |
The critical exponents have to fulfill the Widom scaling relation:52,53
Using the above determined values of exponents β and γ, eqn (18) yields δ = 3.344 for β, γ evaluated from MAP and δ = 3.455 for β, γ obtained by the KF method. Thus, the critical exponents found in this study obey the Widom scaling relation remarkably well (Table 4).
Table 4 Comparison of critical exponents for our sample with various models; MAP, KF, Critical Isotherm (CI)
| System |
Method |
TC (K) |
β |
γ |
δ |
Ref. |
| La0.8Ba0.1Ca0.1MnO3 |
MAP |
281.312 ± 0.144 |
0.491 ± 0.014 |
1.151 ± 0.064 |
3.344 |
This work |
| La0.8Ba0.1Ca0.1MnO3 |
KF |
381.133 ± 0.42 |
0.481 ± 0.02 |
1.181 ± 0.042 |
3.455 |
This work |
| La0.8Ba0.1Ca0.1MnO3 |
CI |
— |
— |
— |
3.341 ± 0.003 |
This work |
| Mean-field model |
Theory |
— |
0.5 |
1 |
3 |
57 |
| 3D Ising model |
Theory |
— |
0.325 ± 0.002 |
1.241 ± 0.002 |
4.82 ± 0.002 |
57 |
| Tri-critical mean-field model |
Theory |
— |
0.25 |
1 |
5.0 |
57 |
| 3D Heisenberg model |
Theory |
— |
0.365 ± 0.003 |
1.336 ± 0.004 |
4.80 ± 0.04 |
57 |
| La0.8Sr0.2MnO3 |
— |
315 |
0.05 ± 0.02 |
1.08 ± 0.03 |
3.13 ± 0.20 |
58 |
| La0.67Ba0.33Mn0.98Ti0.02O3 |
— |
310 |
0.551 ± 0.008 |
1.020 ± 0.024 |
2.851 |
59 |
| La0.7Ca0.3Mn0.95Ti0.05O3 |
— |
136 |
0.601 ± 0.02 |
1.171 ± 0.01 |
2.95 ± 0.01 |
60 |
| La0.7Ca0.05Sr0.25MnO3 |
— |
344 |
0.42 |
1.14 |
3.7 |
61 |
| La0.67Ba0.33Mn0.9Cr0.1O3 |
— |
324 |
0.378 ± 0.05 |
1.357 ± 0.002 |
4.589 |
62 |
| La0.67Ba0.33MnO3 |
— |
306 |
0.356 ± 0.004 |
1.120 ± 0.003 |
4.15 ± 0.05 |
63 |
3.4.2. Critical parameters determined from electrical resistivity. For a better understanding of the nature of phase transition, we tried to determine the values of the critical exponents close to second order metal–semiconductor transition and to assign one of these models to second order systems. According to the Fisher–Langer theory,54 specific heat at constant pressure (Cp) and at the phase transition temperature is proportional to the temperature derivative of the resistivity at T = TM–SC. The thermal derivative of the resistivity is given by Fisher–Langer as:| | |
Cp ∝ (dρ/dT) = (dρ/dη) = η − α
| (19) |
here, α is the specific heat critical exponent and η = (T − TM–SC)/TM–SC is reduced temperature.The two power law forms of eqn (19) below and above TM–SC given by Geldart et al.55 are:
| |
 | (20) |
| |
 | (21) |
where
A′′ and
B are constants,
α and
α′ are specific heat critical exponents below and above
TM–SC. The temperature derivative of resistivity normalized with respect to its value at
TM–SC, [1/
ρ(
TM–SC)d
ρ/d
T] against
η is shown in
Fig. 10 for our sample, and
eqns (20) and
(21) are fitted below and above
TM–SC in the same figures. The solid lines passing through the data the are best fits in the two regions. The values of constants
A′′,
B and the specific heat critical exponents below and above
TM–SC are obtained from the fitting analysis for the sample (seen in
Table 5). Consequently, our model could be any one of the models such as mean field, 3D-Ising or tricritical mean-field.
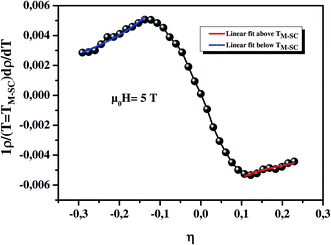 |
| | Fig. 10 Thermal derivative of resistivity normalized with respect to resistivity value at TM–SC as a function of reduced temperature, η. | |
Table 5 Values of different parameters used to fit the experimental data to eqns (20) and (21)
| System |
Region |
A′′ |
B |
α and α′ |
Ref. |
| La0.8Ba0.1Ca0.1MnO3 |
T < TM–SC |
0.00311 ± 1.90479 × 10⁻⁴ |
−9.92385 ± 3.03029 × 10⁻⁴ |
0.004 |
This work |
| T > TM–SC |
−0.00114 ± 1.52525 × 10⁻⁴ |
−0.00286 ± 2.79734 × 10⁻⁴ |
0.004 |
This work |
Thus, it is somehow difficult to distinguish which one of them is the best for the determination of the critical exponents. Other critical exponents β and γ are calculated from the Suezaki–Mori model56 which relates the temperature derivative of the electrical resistivity to the reduced temperature (η) magnetic ordering as follows:
| | |
[dρ/dT] = −B+η−(α+γ−1) for T > TM–SC
| (22) |
| | |
[dρ/dT] = −Bgη−(α+γ)/2 + B−η−(α+γ−1) for T < TM−SC
| (23) |
where the constant
B+ and B
− incorporates term involving the zone boundary energy gap
Bg, as already denoted. Taking natural logarithm on both the sides,
eqn (22) can be rewritten as:
| | |
ln(dρ/dT) = (α + γ − 1)ln(η) for T > TM–SC
| (24) |
The slope of ln(dρ/dT) versus ln(η) plot gives the value of (α + γ − 1) (seen in Fig. 11). As α is obtained from the fit with Fisher–Langer method, we can obtain the value of γ. Substituting the value of a (derived from the figure in this relation), the critical exponent γ was obtained as γ = 1.181 ± 0.005. The first term in eqn (23) involving Bg will be dominant at temperatures less than TM–SC because the scaling law gives (α + γ)/2 − (α + γ − 1) = β. As done earlier, eqn (23) can also be rewritten by taking natural logarithm on both sides as:
| | |
ln(dρ/dT) = [(α + γ)/2 − (α + γ − 1)]ln(η) for T < TM–SC
| (25) |
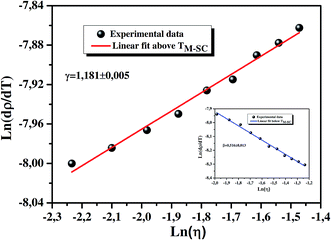 |
| | Fig. 11 ln(dρ/dT) vs. ln[(T − TM–SC)/TM–SC] above TM–SC under 5 T. The inset shows ln(dρ/dT) vs. ln[(T − TM–SC)/TM–SC] below TM–SC under 5 T. | |
Using scaling relation, (α + γ)/2 − (α + γ − 1) = β is equal to the value of critical exponent β. Hence, the direct slope of the plot ln(dρ/dT) versus ln(η) below TM–SC will give β value. The inset of Fig. 11 presents ln(dρ/dT) versus ln(η) below TM–SC for our sample, and the obtained value of slope is 0.516 ± 0.013. The critical exponents are determined in our case and listed in Table 6. Finally, one can see that Rushbrooke scaling relation α + 2β + γ = 2 (theory), which gives 2.217 for our sample is also satisfied. The estimated critical exponents from these experimental data and critical exponents from theoretical models such as the mean field, 3D Heisenberg, 3D-Ising and tricritical mean-field are listed in Table 6, and the estimated values for our sample are completely consistent with the mean field model.
Table 6 Estimated critical exponents for our sample and theoretical models
| System |
α |
β |
γ |
δ |
Ref. |
| La0.8Ba0.1Ca0.1MnO3 |
0.004 |
0.516 ± 0.013 |
1.181 ± 0.005 |
— |
This work |
| Pr0.6Ca0.4Mn0.96Co0.04O3 |
−0.115 |
0.336 ± 0.04 |
1.304 ± 0.02 |
— |
66 |
| Pr0.6Ca0.4Mn0.96Cr0.04O3 |
0.001 |
0.502 ± 0.003 |
1.192 ± 0.001 |
— |
66 |
| Mean-field model |
0 |
0.5 |
1 |
3.0 |
18,19 |
| Tri-critical mean-field model |
0 |
0.25 |
1 |
5 |
65 |
| 3D-Ising model |
0 |
0.325 |
1.24 |
4.82 |
65 |
| 3D-Heisenberg model |
−0.115 |
0.365 |
1.336 |
4.8 |
16,64 |
4. Conclusion
The electrical properties of La0.8Ba0.1Ca0.1MnO3 have been studied. An important magnetoresistance at a 5 T applied magnetic field is achieved in the low-temperature region of our sample. Analyses of the electrical transport data found that SPH model is operative in the high temperature (T > TM–SC) regime in this manganite. The electrical conduction mechanism of low temperature (T < TM–SC) can be explained by a theory based on Kondo-like spin dependent scattering, e–e, e–m, and e–p scattering. Then, to study the transport mechanism in the entire range of temperature, we have used the theoretical percolation model, including the FM-metallic and PM-semiconductor region. Finally, we have examined the critical behavior of resistivity in La0.8Ba0.1Ca0.1MnO3 sample under different applied magnetic fields. The estimated critical exponents, obtained from resistivity, are (β = 0.516 ± 0.013, γ = 1.181 ± 0.005 and α = 0.004). The values deduced from the critical exponents are close to the theoretical prediction of mean-field model. These results are in good agreement with the analysis of the critical exponents from magnetization measurements.
References
- P. A. Yadav, A. V. Deshmukh, K. P. Adhi, B. B. Kale, N. Basavaih and S. I. Patil, Role of grain size on the magnetic properties of La0.7Sr0.3MnO3, J. Magn. Magn. Mater., 2013, 328, 86 CrossRef CAS
 .
. - I. Mansuri and D. Varshney, Structure and electrical resistivity of La1−x BaxMnO3 (0.25 ≤ x ≤ 0.35) perovskites, J. Alloys Compd., 2012, 513, 256 CrossRef CAS
 .
. - M. D. Daivajna, A. Rao and G. S. Okram, Electrical, thermal and magnetic properties of Bi doped La0.7−xBixSr0.3MnO3 manganites, J. Alloys Compd., 2014, 617, 345 CrossRef CAS
 .
. - P. Zhang, P. Lampen, T. L. Phan, S. C. Yu, T. D. Thanh, N. H. Dan, V. D. Lam, H. Srikanth and M. H. Phan, Influence of magnetic field on critical behavior near a first order transition in optimally doped manganites: the case of La1−xCaxMnO3 (0.2 ≤ x ≤ 0.4), J. Magn. Magn. Mater., 2013, 348, 146 CrossRef CAS
 .
. - N. Sdiri, M. Bejar and E. Dhahri, The effect of the B-site size on the structural, magnetic and electrical properties of La0.7Ca0.3MnO3−δ compounds, J. Magn. Magn. Mater., 2007, 311, 512 CrossRef CAS
 .
. - N. Kambhala and S. Angappane, Anisotropic magnetoresistance studies of polycrystalline La0.67Ca0.33MnO3, Phys. B, 2013, 411, 72 CrossRef CAS
 .
. - R. Skini, A. Omri, M. Khlifi, E. Dhahri and E. K. Hlil, Large magnetocaloric effect in lanthanum-deficiency manganites La0.8−x□xCa0.2 MnO3 (0.00 ≤ x ≤ 0.20) with a first-order magnetic phase transition, J. Magn. Magn. Mater., 2014, 364, 5 CrossRef CAS
 .
. - M. Khlifi, M. Bejar, E. Dhahri, P. Lachkar and E. K. Hlil, Influence of Ca-deficiency on the magneto-transport properties in La0.8Ca0.2MnO3 perovskite and estimation of magnetic entropy change, J. Appl. Phys., 2012, 111, 103909 CrossRef CAS PubMed
 .
. - M. S. Islam, D. T. Hanh, F. A. Khan, M. A. Hakim, D. L. Minh, N. N. Hoang, N. H. Hai and N. Chau, Giant magneto-caloric effect around room temperature at moderate low field variation in La0.7(Ca1−xSrx)0.3MnO3 perovskites, Phys. B, 2009, 404, 2495 CrossRef CAS
 .
. - D. T. Hanh, M. S. Islam, F. A. Khan, D. L. Minh and N. Chau, Large magnetocaloric effect around room temperature in La0.7Ca 0.3−xPbxMnO3 perovskites, J. Magn. Magn. Mater., 2007, 310, 2826 CrossRef CAS
 .
. - A. N. Ulyanov, D. S. Yang and S. C. Yu, Anomaly of local structure of La0.7Ca0.3−xBaxMnO3 manganites at Curie temperature, J. Appl. Phys., 2003, 93, 7376 CrossRef CAS
 .
. - M. H. Phan, S. B. Tian, S. C. Yu and A. N. Ulyanov, Magnetic and magnetocaloric properties of La0.7Ca 0.3−xBaxMnO3 compounds, J. Magn. Magn. Mater., 2003, 256, 306 CrossRef CAS
 .
. - R. Tripathi, V. P. S. Awana, N. Panwar, G. L. Bhalla, H. U. Habermier, S. K. Agarwal and H. Kishan, Enhanced room temperature coefficient of resistance and magnetoresistance of Ag-added La0.7Ca0.3−xBaxMnO3 composites, J. Phys. D: Appl. Phys., 2009, 42, 17 Search PubMed
 .
. - T. D. Thanh, T. H. Lee, T. L. Phan, D. A. Tuan and S. C. Yu, Influences of the first-to-second order magnetic phase transformation on the transport properties of La0.7Ca0.3−xBaxMnO3 compounds, J. Appl. Phys., 2014, 115, 17C706 CrossRef
 .
. - U. L. Shinde, L. N. Singh and N. B. Srivastava, Small polaron transport and magnetoresistance in sol–gel prepared Nd0.7Sr0.3−xCaxMnO3 (0 ≤ x ≤ 0.3) nanomanganite system, Phys. B, 2014, 452, 13 CrossRef CAS
 .
. - B. Padmanabhan, H. L. Bhat, S. Elizabeth, S. Rößler, U. K. Rößler, K. Dörr and K. H. Müller, Critical properties in single crystals of Pr1−xPbxMnO3, Phys. Rev. B: Condens. Matter Mater. Phys., 2007, 75, 024419 CrossRef
 .
. - S. Taran, B. K. Chaudhuri, S. Chatterjee, H. D. Yang, S. Neeleshwar and Y. Y. Chen, Critical exponents of the La0.7Sr0.3MnO3, La0.7Ca0.3MnO3, and Pr0.7Ca0.3MnO3 systems showing correlation between transport and magnetic properties, J. Appl. Phys., 2005, 98, 8 CrossRef
 .
. - M. Ziese, Critical scaling and percolation in manganite films, J. Phys.: Condens. Matter, 2001, 13, 2919 CrossRef CAS
 .
. - D. Kim, B. L. Zink, F. Hellman and J. M. D. Coey, Critical behavior of La0.75Sr0.25MnO3, Phys. Rev. B: Condens. Matter Mater. Phys., 2002, 65, 214424 CrossRef
 .
. - M. A. Gdaiem, S. Ghodhbane, A. Dhahri, J. Dhahri and E. K. Hlil, Effect of cobalt on structural, magnetic and magnetocaloric properties of La0.8Ba0.1Ca0.1Mn1−xCoxO3 (x = 0.00, 0.05 and 0.10) manganites, J. Alloys Compd., 2016, 681, 547 CrossRef CAS
 .
. - G. Venkataiah, V. Prasad and P. Venugopal Reddy, Influence of A-site cation mismatch on structural, magnetic and electrical properties of lanthanum manganites, J. Alloys Compd., 2007, 429, 1 CrossRef CAS
 .
. - C. Zener, Interaction between the d-shells in the transition metals II. Ferromagnetic compounds of manganese with perovskite structure, Phys. Rev., 1951, 82, 403 CrossRef CAS
 .
. - S. Hcini, S. Khadhraoui, S. Zemni, A. Triki, H. Rahmouni, M. Boudard and M. Oumezzine, Percolation model of the temperature dependence of resistivity in Pr0.67A0.33MnO3 (A = Ba or Sr) manganites, J. Supercond. Novel Magn., 2013, 26, 2181 CrossRef CAS
 .
. - S. Hcini, S. Zemni, A. Triki, H. Rahmouni and M. Boudard, Size mismatch, grain boundary and bandwidth effects on structural, magnetic and electrical properties of Pr0.67Ba0.33MnO3 and Pr0.67Sr0.33MnO3 perovskites, J. Alloys Compd., 2011, 509, 1394 CrossRef CAS
 .
. - A. Urushibara, Y. Moritomo, T. Arima, A. Asamitsu, G. Kido and Y. Tokura, Insulator-metal transition and giant magnetoresistance in La1−xSrxMnO3, Phys. Rev. B: Condens. Matter Mater. Phys., 1995, 51, 14103 CrossRef CAS
 .
. - D. C. Worledge, G. J. Snyder, M. R. Beasley and T. H. Geballe, Anneal-tunable Curie temperature and transport of La0.67Ca0.33MnO3, J. Appl. Phys., 1996, 80, 5158 CrossRef CAS
 .
. - M. Viret, L. Ranno and J. M. D. Coey, Magnetic localization in mixed-valence manganites, Phys. Rev. B: Condens. Matter Mater. Phys., 1997, 55, 8067 CrossRef CAS
 .
. - G. J. Synder, R. Hiskes, S. DiCarolis, M. R. Beasley and T. H. Geballe, Intrinsic electrical transport and magnetic properties of La0.67Ca0.33MnO3 and La0.67Sr0.33MnO3 MOCVD thin films and bulk material, Phys. Rev. B: Condens. Matter Mater. Phys., 1996, 53, 14434 CrossRef
 .
. - G. Venkataiah and P. V. Reddy, Structural, magnetic and magnetotransport behavior of some Nd-based perovskite manganites, Solid State Commun., 2005, 136, 114 CrossRef CAS
 .
. - M. Ziese, Searching for quantum interference effects in La0.7Ca0.3MnO3 films on SrTiO3, Phys. Rev. B: Condens. Matter Mater. Phys., 2003, 68, 132411 CrossRef
 .
. - Y. Xu, J. Zhang, G. Cao, C. Jing and S. Cao, Low-temperature resistivity minimum and weak spin disorder of polycrystalline La2/3Ca1/3MnO3 in a magnetic field, Phys. Rev. B: Condens. Matter Mater. Phys., 2006, 73, 224410 CrossRef
 .
. - G. F. Dionne, Magnetic exchange and charge transfer in mixed-valence manganites and cuprates, J. Appl. Phys., 1996, 79, 5172 CrossRef CAS
 .
. - N. F. Mott, Conduction in glasses containing transition metal ions, J. Non-Cryst. Solids, 1968, 1, 1 CrossRef CAS
 .
. - B. S. Nagaraja, A. Rao and G. S. Okram, Structural, electrical, and colossal thermoelectric properties of Dy1−xSrxMnO3 manganites, J. Supercond. Novel Magn., 2015, 28, 223 CrossRef CAS
 .
. - S. Mollaha, H. L. Huang, H. D. Yang, S. Pal, S. Taran and B. K. Chaudhuri, Non-adiabatic small-polaron hopping conduction in Pr0.65Ca0.35−xSrxMnO3 perovskites above the metal–insulator transition temperature, J. Magn. Magn. Mater., 2004, 284, 383 CrossRef
 .
. - J. B. Goodenough and J. S. Zhou, New forms of phase segregation, Nature, 1997, 386, 229 CrossRef CAS
 .
. - G. Li, H. D. Zhou, S. J. Feng, X. J. Fan and X. G. Li, Competition between ferromagnetic metallic and paramagnetic insulating phases in manganites, J. Appl. Phys., 2002, 92, 1406 CrossRef CAS
 .
. - M. Pattabiramana, G. Rangarajana and P. Murugaraj, Electrical conduction through bond percolation in Nd0.67Sr0.33MnO3, Solid State Commun., 2004, 132, 7 CrossRef
 .
. - N. Zaidi, S. Mnefgui, A. Dhahri, J. Dhahri and E. K. Hlil, Study of electrical transport and magnetoresistive properties of La0.67−xDyxPb0.33MnO3 (x = 0.00, 0.10 and 0.15), J. Alloys Compd., 2014, 616, 378 CrossRef CAS
 .
. - Y. Sun, W. Tong, X. Xu and Y. Zhang, Tuning colossal magnetoresistance response by Cr substitution in La0.67Sr0.33MnO3, Appl. Phys., 2001, 78, 5 Search PubMed
 .
. - F. Elleuch, M. Triki, M. Bekri, E. Dhahri and E. K. Hlil, A-site deficiency-dependent structural, magnetic and magnetoresistance properties in the Pr0.6Sr0.4MnO3 manganites, J. Alloys Compd., 2015, 620, 249 CrossRef CAS
 .
. - N. Kallel, K. Frohlich, S. Pignard, M. Oumezzine and H. Vincent, Structure, magnetic and magnetoresistive properties of La0.7 Sr0.3Mn1−xSnx O3 samples (0 ≤ x ≤ 0.20), J. Alloys Compd., 2005, 399, 20 CrossRef CAS
 .
. - W. Cheikh-Rouhou Koubaa, M. Koubaa and A. Cheikhrouhou, Structural, magnetotransport, and magnetocaloric properties of La0.7Sr0.3−xAgxMnO3 perovskite manganites, J. Alloys Compd., 2008, 453, 42 CrossRef CAS
 .
. - N. Moutis, I. Panagiotopoulos, M. Pissas and D. Niarchos, Structural and magnetic properties of La0.67(BaxCa1−x)0.33MnO3 perovskites (0 < ∼x < ∼1), Phys. Rev. B: Condens. Matter Mater. Phys., 1999, 59, 1129 CrossRef CAS
 .
. - X. Zhu, Y. Sun, X. Luo, H. Lei, B. Wang, W. Song, Z. Yang, J. Dai, D. Shi and S. Dou, Crossover of critical behavior in La0.7Ca0.3Mn1−xTixO3, J. Magn. Magn. Mater., 2010, 322, 242 CrossRef CAS
 .
. - J. Yang and Y. P. Lee, Critical behavior in Ti-doped manganites LaMn1−xTixO3 (0.05 ≤ x ≤ 0.2), Appl. Phys. Lett., 2007, 91, 142512 CrossRef
 .
. - D. Kim, B. Revaz, B. L. Zink, F. Hellman, J. J. Rhyne and J. E. Mitchell, Tricritical point and the doping dependence of the order of the ferromagnetic phase transition of La1−xCaxMnO3, Phys. Rev. Lett., 2002, 89, 227202 CrossRef CAS PubMed
 .
. - A. Arrott and J. E. Noakes, Approximate equation of state for nickel near its critical temperature, Phys. Rev. Lett., 1967, 19, 786 CrossRef CAS
 .
. - A. Schwartz, M. Scheffler and S. M. Anlage, Determination of the magnetization scaling exponent for single-crystal La0.8Sr0.2MnO3 by broadband microwave surface impedance measurements, Phys. Rev. B: Condens. Matter Mater. Phys., 2000, 61, R870 CrossRef CAS
 .
. - J. S. Kouvel and M. E. Fisher, Detailed magnetic behavior of nickel near its curie point, Phys. Rev. B: Condens. Matter Mater. Phys., 1964, 136, A1626 Search PubMed
 .
. - M. E. Fisher, S. K. Ma and B. G. Nickel, Critical exponents for long-range interactions, Phys. Rev. Lett., 1972, 29, 917 CrossRef
 .
. - B. Widom, Equation of state in the neighborhood of the critical point, J. Chem. Phys., 1965, 43, 3898 CrossRef
 .
. - B. Widom, Degree of the critical isotherm, J. Chem. Phys., 1964, 41, 1633 CrossRef
 .
. - M. E. Fisher and J. S. Langer, Resistive anomalies at magnetic critical points, Phys. Rev. Lett., 1968, 20, 665 CrossRef CAS
 .
. - D. J. W. Geldart and T. G. Richard, Theory of spin-fluctuation resistivity near the critical point of ferromagnets, Phys. Rev. B: Condens. Matter Mater. Phys., 1975, 12, 5175 CrossRef CAS
 .
. - Y. Suezaki and Y. Mori, Dynamic critical phenomena in magnetic systems II electrical resistivity near the néel point, Prog. Theor. Phys., 1969, 41, 1177 CrossRef
 .
. - H. E. Stanley, Introduction to phase transitions and critical phenomena, Oxford University Press, London, 1971 Search PubMed
 .
. - C. V. Mohan, M. Seeger, H. Kronmüller, P. Murugaraj and J. Maier, J. Magn. Magn. Mater., 1998, 83, 348 CrossRef
 .
. - M. Oumezzine, O. Peña, S. Kallel and S. Zemni, Solid State Sci., 2011, 13, 1829 CrossRef CAS
 .
. - A. Berger, G. Camopillo, P. Vivas, J. E. Pearson, S. D. Bader, E. Baca and P. Prieto, J. Appl. Phys., 2002, 91, 8393 CrossRef CAS
 .
. - M. H. Phan, V. Franco, N. S. Bingham, H. Srikanth, N. H. Hur and S. C. Yu, J. Alloys Compd., 2010, 508, 238 CrossRef CAS
 .
. - M. Oumezzine, O. Peña, S. Kallel and M. Oumezzine, J. Alloys Compd., 2012, 539, 116 CrossRef CAS
 .
. - N. Mautis, I. Panagiotopoulos, M. Pissas and D. Niarchos, Phys. Rev. B: Condens. Matter Mater. Phys., 1999, 59, 1129 CrossRef
 .
. - S. Taran, B. K. Chaudhuri, S. Chatterjee, H. D. Yang, S. Neeleshwar and Y. Y. Chen, Critical exponents of the La0.7Sr0.3MnO3, La0.7Ca0.3MnO3, and Pr0.7Ca0.3MnO3 systems showing correlation between transport and magnetic properties, J. Appl. Phys., 2005, 98, 103903 CrossRef
 .
. - D. Ginting, D. Nanto, Y. D. Zhang, S. C. Yu and T. L. Phan, Influences of Ni-doping on critical behaviors of La0.7Sr0.3Mn1−xNixO3, Phys. B, 2013, 421, 17 CrossRef
 .
. - R. Thiyagarajan, S. Esakki Muthu, G. Kalaiselvan and R. Mahendran Arumugam, Critical behavior of resistivity in the pressure-induced first to second order transition in Pr0.6Ca0.4Mn0.96B0.04O3 (B = Co and Cr), J. Alloys Compd., 2015, 618, 159–166 CrossRef CAS
 .
.
|
| This journal is © The Royal Society of Chemistry 2017 |
 Open Access Article
 *a,
Ah. Dhahribc,
J. Dhahria and
E. K. Hlild
![[3 with combining macron]](https://www.rsc.org/images/entities/char_0033_0304.gif) c space group.20 In the present study the electrical transport properties ρ(T) were measured by a standard four-probe method using physical property measurement system (PPMS, Quantum Design).
c space group.20 In the present study the electrical transport properties ρ(T) were measured by a standard four-probe method using physical property measurement system (PPMS, Quantum Design).
![[thin space (1/6-em)]](https://www.rsc.org/images/entities/char_2009.gif) t32g
t32g![[thin space (1/6-em)]](https://www.rsc.org/images/entities/char_2009.gif) ↑
↑![[thin space (1/6-em)]](https://www.rsc.org/images/entities/char_2009.gif) e1g↑,
e1g↑, ![[thin space (1/6-em)]](https://www.rsc.org/images/entities/char_2009.gif) S = 2) and Mn4+ (3d3,
S = 2) and Mn4+ (3d3,![[thin space (1/6-em)]](https://www.rsc.org/images/entities/char_2009.gif) t32g
t32g![[thin space (1/6-em)]](https://www.rsc.org/images/entities/char_2009.gif) ↑
↑![[thin space (1/6-em)]](https://www.rsc.org/images/entities/char_2009.gif) e0g,
e0g, ![[thin space (1/6-em)]](https://www.rsc.org/images/entities/char_2009.gif) S = 3/2) via oxygen.
S = 3/2) via oxygen.


![[thin space (1/6-em)]](https://www.rsc.org/images/entities/char_2009.gif)
![[thin space (1/6-em)]](https://www.rsc.org/images/entities/char_2009.gif)
![[thin space (1/6-em)]](https://www.rsc.org/images/entities/char_2009.gif) exp(T0/T)1/4
exp(T0/T)1/4


![[thin space (1/6-em)]](https://www.rsc.org/images/entities/char_2009.gif)


.
.
.
.
.
.
.
.
.
.
.
.
.
.
.
.
.
.
.
.
.
.
.
.
.
.
.
.
.
.
.
.
.
.
.
.
.
.
.
.
.
.
.
.
.
.
.
.
.
.
.
.
.
.
.
.
.
.
.
.
.
.
.
.
.
.


