Using 3D MCF-7 mammary spheroids to assess the genotoxicity of mixtures of the food-derived carcinogens benzo[a]pyrene and 2-amino-1-methyl-6-phenylimidazo[4,5-b]pyridine
Rhiannon M.
David†
* and
Nigel J.
Gooderham
Computational and Systems Medicine, Department of Surgery and Cancer, Imperial College, London, UK. E-mail: rhiannon.david@astrazeneca.com
First published on 18th November 2015
Abstract
Genotoxic carcinogens are present in the human diet, and two important examples are benzo[a]pyrene (BaP) and 2-amino-1-methyl-6-phenylimidazo[4,5-b]pyridine (PhIP). BaP is a polycyclic aromatic hydrocarbon generated by incomplete combustion of organic substances, thus contaminating numerous foodstuffs, and PhIP is a heterocyclic amine formed when meat is cooked. Genotoxicity testing of chemical carcinogens has focussed largely on individual chemicals, particularly in relation to diet, despite mixtures representing a more realistic exposure scenario. We have previously shown that exposure of MCL-5 cells to BaP–PhIP mixtures produces a TK mutation dose response that differs from the predicted additive response, using traditional regulatory-like two-dimensional (2D) cell culture. There is a large gap between 2D cell culture and the whole animal, and three-dimensional (3D) cell culture, shown to better represent in vivo tissue structure, may bridge the gap. The aim of the current study was to use 3D spheroids to characterise the DNA damage response following exposure to mixtures of the mammary carcinogens BaP and PhIP. Mammary MCF-7 cells were grown in 3D spheroids, exposed (24 h) to BaP (10−10 to 10−5 M) or PhIP (10−9 to 10−4 M) individually or in mixtures and DNA damage assessed by micronucleus (MN) formation. A dose-dependent increase in MN was observed for the individual chemicals in 3D cell culture. In line with our previous 2D TK mutation data, 3D mixture exposures gave a modified DNA damage profile compared to the individual chemicals, with a potent response at low dose combinations and a decrease in MN with higher concentrations of BaP in the mixture. Ethoxyresorufin-O-deethylase (CYP1A) activity increased with increasing concentration of BaP in the mixture, and for combinations with 10 μM BaP, CYP1A1 mRNA induction was sustained up to 48 h. These data suggest mixtures of genotoxic chemicals give DNA damage responses that differ considerably from those produced by the chemicals individually, and that 3D cell culture is an appropriate platform for DNA damage assays.
Introduction
Cooking food at high temperatures produces genotoxic carcinogens that present a concern for human health. The consumption of red meat is positively correlated with human cancer and cooking meat produces heterocyclic amines (HCAs) and polycyclic aromatic hydrocarbons (PAHs).1 Two important examples are the PAH benzo[a]pyrene (BaP) and the HA 2-amino-1-methyl-6-phenylimidazo[4,5-b]pyridine (PhIP). BaP is generated by incomplete combustion of organic substances, such as lipids, resulting in the contamination of numerous foodstuffs.2 BaP is metabolised primarily by the Cytochrome P450 (CYP) 1A family to epoxides including the BaP-diol epoxide (BPDE) derivative that can form DNA adducts and result in mutation and tumours.3 Through consumption of contaminated food, average human daily exposure to BaP is estimated to be about 1–500 ng.3 Evidence from numerous experimental studies suggests a positive link between exposure to BaP and cancer in animals and in humans.1 PhIP is extensively bioavailable, with daily ingestion being 0.1–15 μg,4,5 and is an established rodent carcinogen6 inducing cancer in the prostate, colon, and mammary gland of rats.7,8 PhIP is activated via N-hydroxylation catalysed by CYP1A1 and 1A2 to DNA damaging species.8–10Mixtures of food-derived genotoxic carcinogens represent a more realistic dietary exposure scenario, however, published assessment of genotoxic carcinogens, particularly dietary carcinogens, in mixtures is limited. Recently we have shown that mixtures of BaP with PhIP produced non-monotonic mutation responses at the TK locus in MCL-5 cells (metabolically competent lymphoblastoid).11 Most notably, combinations of low concentrations (individually not detectably mutagenic) showed synergism, while antagonism was observed for high concentration combinations (significantly mutagenic alone). These mutation profiles, particularly the synergism at low concentration combinations (relevant to human exposure), are of significance when considering the genotoxic potential of food, and potentially risk assessment. However, these data were obtained using two dimensional (2D) cell culture, which is not representative of the cellular environment found within an organism. Three dimensional (3D) cell cultures have been shown to better represent the in vivo structure of tissues12 (Fig. 1), thus culturing in 3D may decrease the gap between cell culture and physiological tissue.13 Current genotoxicity testing adopts a tiered approach: structural activity relationships, bacterial Ames tests and mammalian cell culture, before testing in vivo. The gap between cell culture and whole animal is large and we propose that 3D cell culture may bridge that gap. The aim of the current study was to use 3D organotypic cell culture to characterise the DNA damage response following exposure to BaP and PhIP, individually and in mixtures.
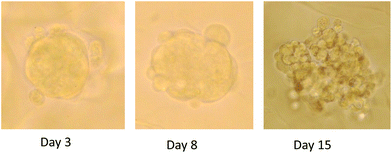 | ||
| Fig. 1 Photographs of three dimensional (3D) spheroids in culture in AlgiMatrix system following 3, 8 and 15 days growth. | ||
Methods
Materials
Minimal essential medium (MEM) (without phenol red, or L-glutamine), foetal bovine serum (FBS), L-glutamine, penicillin/streptomycin, and non-essential amino acids (NEAA) were obtained from Life Technologies, Paisley, UK. All other chemicals were purchased from Sigma-Aldrich, Poole, UK unless otherwise stated.Cell culture
MCF-7 cells, obtained from ATCC, were cultured in MEM supplemented with 10% (v/v) FBS, 2 mM L-glutamine, 100 units per ml penicillin, 100 μg ml−1 streptomycin, 2× NEAA, (called M10 media). Cells were cultured in a humidified incubator with 5% CO2, at 37 °C.Three dimensional (3D) spheroid culture
MCF-7 cells (106) were seeded in AlgiMatrix scaffolds (Life Technologies) contained in 24 well plates following manufacturer's instructions. Cells were monitored and culture medium routinely changed. Cells were incubated for 15 days to establish 3D structures with ultrastructural and physiological traits and capabilities closer to those seen in the intact tissue or organ.14 To isolate spheroids from the scaffold, matrix dissolving buffer (Life Technologies) was used following manufacturer's instructions followed by standard trypsinisation to generate single cell suspensions when required.Adenylate kinase assay for cell viability
Viability of spheroid cultures was assessed by measuring adenylate kinase (AK) in spent media using the bioluminescent cytotoxicity assay kit (Lonza Toxilight assay kit) following manufacturer's instructions.Micronucleus (MN) assay
Following the 15 day incubation period in AlgiMatrix scaffolds, spheroids were treated with BaP or PhIP or binary mixtures (all prepared in DMSO) to achieve the following final concentrations: BaP (10−10–10−5 M), PhIP (10−9–10−4 M), BaP + PhIP (10−9 + 10−9 M, 10−7 + 10−6 M, 10−6 + 10−6 M, 10−6 + 10−5 M, 10−5 + 10−6 M, 10−5 + 10−4 M). Dimethylsulfoxide (DMSO; 0.1% v/v) was the negative control and etoposide (10 μg ml−1) the positive control. Cells were treated for 24 h in M10 at 37 °C, 5% CO2. Following treatment, spheroids were washed twice with fresh media and maintained for a 48 h recovery period at the end of which cells were counted, adjusted to 4 × 10⁵ ml−1 in M10 containing 2% pluronic (Life Technologies) and deposited directly onto slides using a cytospin centrifuge. Cells were fixed in 100% methanol and stained with acridine orange. The frequency of MN in mononuclear cells was scored blind in a minimum of 1000 cells per sample, two to three independent cultures were used per treatment.Ethoxyresorufin-O-deethylase activity (EROD)
Ethoxyresorufin-O-deethylase (EROD), an indicator of CYP1A activity, was measured in a dynamic fluorescent assay by the conversion of added 7-ethoxyresorufin (7-ER) to resorufin. MCF-7 spheroids (incubated in AlgiMatrix scaffold for 15 days) were treated with BaP alone or selected combinations of BaP with PhIP for 24 h following which spheroids were washed twice with fresh medium, 8 μM 7-ER added, and the plate incubated for 90 minutes at 37 °C. Fluorescence was measured at λexcitation 560 nm and λemission 590 nm every 10 minutes using a fluorescence plate reader (POLARstar Galaxy, BMG Lab Technologies). Activity was expressed as pmol resorufin produced per min per mg protein using a resorufin standard curve.Protein determination
Spheroids were isolated from the scaffold using matrix dissolving buffer (Life Technologies) following manufacturer's instructions. Isolated spheroids were treated with RIPA buffer (Sigma) with the addition of 1× Halt protease inhibitor cocktails 1 and 2 (Life Technologies) for 30 minutes on ice. The lysate was clarified by centrifugation (8000g, 10 minutes, 4 °C), the supernatant collected and stored at −20 °C. The protein concentration of the lysate was determined using the BCA assay (Pierce, Thermo Scientific) following manufacturer's instructions.RNA extraction and quantitative RT-PCR (Q-PCR)
Following isolation of cells for MN determination, the remaining cells were collected by centrifugation (200g, 5 minutes, RT) and the cell pellet resuspended in 0.5 ml Trizol (Invitrogen, Paisley, UK) for RNA extraction following manufacturer's instructions with the addition of two extra ethanol washes. RNA was quantified using a NanoPhotometer (Implen GmbH, Munchen, Germany) and the ratios A260/280 and A260/230 used to assess quality. To synthesise cDNA 1 μl random primers was added to 500 ng of RNA (made up to a final volume of 15 μl with RNase/DNase-free dH2O) and incubated at 65 °C for 5 minutes. The mixture was placed on ice before the addition of 0.2 mM dNTPs, 5 μl 5× first strand buffer, 2 μl 0.1 mM DTT and 0.5 μl Superscript II reverse transcriptase (all from Superscript II kit, Life Technologies). The samples were run on a thermocycler (25 °C for 10 minutes, 42 °C for 90 minutes and 70 °C for 15 minutes). CYP1A1 cDNA was amplified using Q-PCR. As an internal standard, glyceraldehyde-3-phosphate dehydrogenase (GAPDH) cDNA fragments were also amplified. TaqMan gene expression assays were purchased from Life Technologies and the generated cDNA amplified using the Taqman Fast 2× Universal PCR master mix, no AmpErase UNG (Life Technologies), with each reaction performed in triplicate. The Q-PCR data were analysed using the ABI 7500 Sequence Detection System (Life Technologies) and the comparative CT method (ΔCT method).15 Calibration was based on the expression of GAPDH.Results
Micronucleus assay
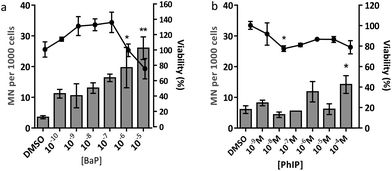
| Concentration of BaP | Number of micronuclei per 1000 cells | |
|---|---|---|
| 48 h recovery | 72 h recovery | |
| DMSO | 3.5 | 17.8 |
| 10−10 M | 11.2 | 18.5 |
| 10−9 M | 10.5 | 17.8 |
| 10−8 M | 13.0 | 17.8 |
| 10−7 M | 16.3 | 16.0 |
| 10−6 M | 19.7 | 23.5 |
| 10−5 M | 26.0 | 31.3 |
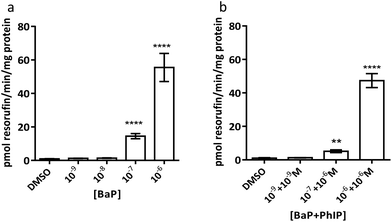
It should be noted that EROD activity cannot be measured at 10−5 M BaP or above, as this is at or above the Km for CYP1A1 and thus BaP outcompetes 7-ER for the CYP active site and 7-ER is not metabolised to fluorescent resorufin to any great extent.
Discussion
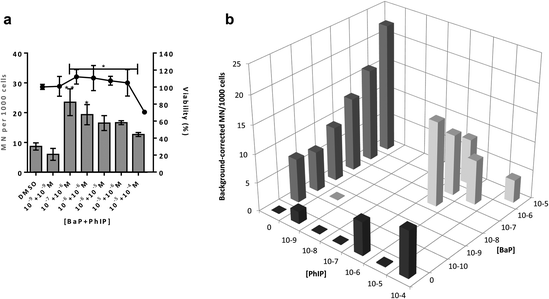
Eating cooked red meat correlates with diet-associated cancer and the cooking process leads to the formation of powerful chemical carcinogens such as BaP and PhIP.1,22 Genotoxicity testing of chemical carcinogens has focussed largely on individual chemicals, using traditional regulatory-approved mammalian cell assays involving two-dimensional (2D) cell culture. There is a large gap between 2D cell culture and the whole animal, and three-dimensional (3D) cell culture, shown to better represent in vivo tissue structure, may bridge the gap. Thus the aim of the current study was to use human mammary cell 3D spheroids to characterise the DNA damage response following exposure to mixtures of the mammary carcinogens BaP and PhIP.The results from the MN assay with BaP indicate that in human mammary cell line MCF-7 spheroids, this compound induces a statistically significant increase in MN at 10−6 M and 10−5 M, which is in line with previous studies, although there the cytokinesis block MN assay (CBMN) was employed.23,24 In contrast to BaP, PhIP significantly increased MN only at 10−4 M, and at a lower magnitude than BaP. It should be noted that it was not possible to test higher concentrations of PhIP due to solubility problems. PhIP has previously been shown to induce MN at concentrations from 0.5 μM–6 μM, but using the cytokinesis block MN (CBMN) assay.23,24 It has been suggested that the mononucleate assay (no CBMN block) is less sensitive than the binucleate assay (CBMN block), possibly due to the latter only considering cells that have divided following cytochalasin B addition, whereas the mononucleate assay considers all intact cells,25 which may underestimate the MN frequency and thus explain the lower concentrations required to induce MN in the CBMN assay. Moreover, these published studies were conducted in 2D culture, whereas the current study used 3D spheroids, which may alter the toxicodynamics and thus the MN induction observed following treatment. This may explain the difference in the levels of PhIP-induced MN between our study and the published studies of Kalantzi et al.23 and Hewitt et al.24
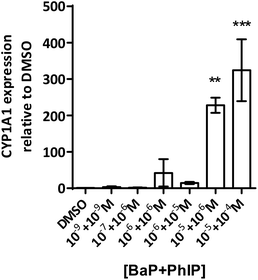
Induction of MN is observed for the combination 10−7 M BaP with 10−6 M PhIP, but then levels of MN decrease with increasing concentrations of BaP in the mixtures. Indeed, a significant decrease in MN levels observed between this concentration combination (10−7 M BaP + 10−6 M PhIP) and that of 10−5 M BaP with 10−4 M PhIP, despite these concentrations significantly inducing MN individually (26 and 14 MN/1000 cells for BaP and PhIP respectively). In support, we have previously shown using the TK forward mutation assay in human lymphoblastoid MCL-5 cells that mixtures of BaP with PhIP in these concentration combinations produce a similar mutation profile to that we observed with mixtures here.11 In our previously published study, this effect was found to be mediated, at least in part, by the CYP1A family of enzymes, which activate both BaP and PhIP to their ultimate genotoxic metabolites, since correlations were observed between EROD activity or CYP1A1 mRNA and mutation profile. While BaP is predominantly metabolised by CYP1A1, metabolic activation of PhIP in humans is catalysed mainly by CYP1A2,26 leading to the formation of N-hydroxy PhIP (N-OH-PhIP), which is further metabolised by N-acetyltransferases or sulfotransferases to the ultimate reactive species that reacts with DNA. However, whilst MCF-7 cells express CYP1A1 and 1A2 mRNA, we have found that PhIP has limited ability to induce either CYP1A1 or CYP1A2 in this cell line (data not shown), and this, along with the limited induction of MN by PhIP in the current study suggests that CYP1A1 activation of BaP is the predominant mechanism for induction of micronuclei following exposure to the mixtures. Therefore, EROD activity and CYP1A1 mRNA expression were measured in the current study. EROD activity was shown to be significantly induced by the combination 10−6 M BaP with 10−6 M PhIP, where a significant induction of MN was also observed. However, although a 5 fold induction of EROD activity was observed for the combination 10−7 M BaP with 10−6 M PhIP, this was 9 times lower than that for 10−6 M BaP with 10−6 M PhIP, where a smaller induction of MN was observed compared to 10−7 M BaP with 10−6 M PhIP.
Interestingly, when the level of EROD activity following treatment with selected concentration combinations of BaP with PhIP was compared to the level observed for the corresponding concentration of BaP alone, it was found that EROD was lower in the mixture-treated cells. For example, EROD activity was almost 3 times higher following treatment with 10−7 M BaP alone as with 10−7 M BaP in combination with 10−6 M PhIP. A possible explanation for reduced induction of CYP1A1 following treatment with selected mixtures is that PhIP is oestrogenic and can mediate gene transcription via the oestrogen receptor (ER) alpha.27 Aryl hydrocarbon Receptor Nuclear Translator (ARNT) is recruited to oestrogen-responsive promoters in the presence of oestradiol,28 thus, PhIP may be recruiting ARNT to the ER, reducing its availability, and hence signalling, through the AhR, which could explain the reduction in CYP1A (EROD) activity in the current study. This reduced EROD activity compared to BaP alone may play a role in the lower MN induction observed with the mixtures as compared to the individual compounds.
The induction of CYP1A is unlikely to be the only factor involved in the response seen, however. In our previous mixtures study, involvement of cell cycle arrest and mismatch repair was found to play a role, thus these factors may also be involved in the response in spheroid culture, and warrant investigation. Moreover, since PhIP is known to induce CYP1B1, it would be of interest to measure expression of this CYP following treatment with PhIP and the mixtures of BaP with PhIP to investigate whether this plays a role in the response observed.
Conclusion
We have shown that the MN assay can be successfully applied to spheroids of MCF-7 cells to detect DNA damage induced by chemicals that are genotoxic to mammary cells, both individually and in mixtures. In support, the MN assay has recently been applied to spheroids of colon cancer cells16 and human reconstructed skin,29 thus the current study further validates the applicability of the MN assay to 3D culture.Acknowledgements
This work was funded by a grant from the United Kingdom Environmental Mutagen Society (UKEMS) Small Grants Scheme awarded to Rhiannon David.References
- R. Sinha, M. Kulldorff, M. J. Gunter, P. Strickland and N. Rothman, Cancer Epidemiol. Biomarkers Prev., 2005, 14, 2030–2034 CAS.
- W. Lijinski and P. Shubik, Science, 1964, 145, 53–55 Search PubMed.
- IARC Monographs on the Evaluation of Carcinogenic Risks to Humans, Vol. 92, Some Non-heterocyclic Polycyclic Aromatic Hydrocarbons and Some Related Exposures, 2010.
- J. S. Felton, M. G. Knize, C. P. Salmon, M. A. Malfatti and K. S. Kulp, Environ. Mol. Mutagen., 2002, 39, 112–118 CrossRef CAS PubMed.
- N. J. Gooderham, S. Murray, A. M. Lynch, M. Yadollahi-Farsani, K. Zhao, A. R. Boobis and D. S. Davies, Drug Metab. Dispos., 2001, 29, 529–534 CAS.
- T. Sugimura, Mutat. Res., Fundam. Mol. Mech. Mutagen., 1997, 376, 211–219 CrossRef CAS PubMed.
- N. Ito, R. Hasegawa, M. Sano, S. Tamano, H. Esumi, S. Takayama and T. Sugimura, Carcinogenesis, 1991, 12, 1503–1506 CrossRef CAS PubMed.
- F. G. Crofts, P. T. Strickland, C. L. Hayes and T. R. Sutter, Carcinogenesis, 1997, 18, 1793–1798 CrossRef CAS PubMed.
- K. Zhao, S. Murray, D. S. Davies, A. R. Boobis and N. J. Gooderham, Carcinogenesis, 1994, 15, 1285–1288 CrossRef CAS PubMed.
- N. Gooderham, S. Murray, A. Lynch, R. Edwards, M. Yadollahi-Farsani, C. Bratt, K. Rich, K. Zhao, B. Murray and S. Bhadresa, Br. J. Clin. Pharmacol., 1996, 42, 91–98 CrossRef CAS PubMed.
- R. David, T. Ebbels and N. Gooderham, Environ. Health Perspect., 2015 DOI:10.1289/ehp.1409557.
- H. Dolznig, C. Rupp, C. Puri, C. Haslinger, N. Schweifer, E. Wieser, D. Kerjaschki and P. Garin-Chesa, Am. J. Pathol., 2011, 179, 487–501 CrossRef PubMed.
- F. Pampaloni, E. G. Reynaud and E. H. K. Stelzer, Nat. Rev. Mol. Cell Biol., 2007, 8, 839–845 CrossRef CAS PubMed.
- K. Wrzesinski and S. J. Fey, Toxicol. Res., 2013, 2, 123–135 RSC.
- K. J. Livak and T. D. Schmittgen, Methods, 2001, 25, 402–408 CrossRef CAS PubMed.
- S. A. A. Patel and N. J. Gooderham, Toxicol. Res., 2015, 4, 858–866 RSC.
- A. M. Lynch, M. G. Knize, A. R. Boobis, N. J. Gooderham, D. S. Davies and S. Murray, Cancer Res., 1992, 52, 6216–6223 CAS.
- M. Yadollahi-Farsani, N. J. Gooderham, D. S. Davies and A. R. Boobis, Carcinogenesis, 1996, 17, 617–624 CrossRef CAS PubMed.
- H. Zhu, A. R. Boobis and N. J. Gooderham, Cancer Res., 2000, 60, 1283–1289 CAS.
- N. J. Gooderham, S. Creton, S. N. Lauber and H. Zhu, Toxicol. Lett., 2007, 168, 269–277 CrossRef CAS PubMed.
- OECD Guideline 487, 2014.
- S. Murray, A. M. Lynch, M. G. Knize and M. J. Gooderham, J. Chromatogr., 1993, 616, 211–219 CrossRef CAS PubMed.
- O. I. Kalantzi, R. Hewitt, K. J. Ford, R. E. Alcock, G. O. Thomas, J. A. Morris, A. Hewer, D. H. Phillips, K. C. Jones and F. L. Martin, Environ. Sci. Technol., 2004, 38, 3614–3622 CrossRef CAS PubMed.
- R. Hewitt, A. Forero, P. J. Luncsford and F. L. Martin, Environ. Health Perspect., 2007, 115, 129–136 CrossRef PubMed.
- M. Fenech, Mutagenesis, 2000, 15, 329–336 CrossRef CAS PubMed.
- N. J. Gooderham, H. Zhu, S. Lauber, A. Boyce and S. Creton, Mutat. Res., Fundam. Mol. Mech. Mutagen., 2002, 506–507, 91–99 CrossRef CAS PubMed.
- S. N. Lauber, S. Ali and N. J. Gooderham, Carcinogenesis, 2004, 25, 2509–2517 CrossRef CAS PubMed.
- E. Swedenborg and I. Pongratz, Toxicology, 2010, 268, 132–138 CrossRef CAS PubMed.
- K. E. Chapman, A. D. Thomas, J. W. Wills, S. Pfuhler, S. H. Doak and G. J. S. Jenkins, Mutagenesis, 2014, 29, 165–175 CrossRef CAS PubMed.
Footnote |
| † Current address: Discovery Safety, Genetic Toxicology, AstraZeneca, Cambridge, UK. |
| This journal is © The Royal Society of Chemistry 2016 |

