 Open Access Article
Magnetic transitions and isotropic versus anisotropic magnetic behaviour of [CH3NH3][M(HCOO)3] M = Mn2+, Co2+, Ni2+, Cu2+ metal–organic perovskites†
B.
Pato-Doldán‡§
 *a,
L. C.
Gómez-Aguirre§
a,
A. P.
Hansen
b,
J.
Mira
 c,
S.
Castro-García
a,
M.
Sánchez-Andújar
a,
M. A.
Señarís-Rodríguez
a,
V. S.
Zapf
b and
J.
Singleton
b
aQuiMolMat Group, CICA, Department of Fundamental Chemistry, Faculty of Sciences, University of A Coruña, Campus A Coruña, 15071 A Coruña, Spain. E-mail: Breogan.Doldan@uib.no
bNational High Magnetic Field Laboratory, Los Alamos National Laboratory, Los Alamos, New Mexico 87545, USA
cDepartment of Applied Physics, University of Santiago de Compostela, 15782, Spain
First published on 31st October 2016
Abstract
Here we present an in-depth study of the magnetic properties of a family of metal–organic perovskites ABX3, [CH3NH3][M(HCOO)3] in which A = CH3NH3+ is the methylammonium cation, B = M is a divalent metal cation (Mn2+, Co2+, Ni2+ or Cu2+), and X is the formate anion (HCOO−). The magnetic properties have been measured on powdered samples and along the different orientations of mm-sized single crystals. They display spin-canted weak ferromagnetism with Néel temperatures of 8.0 K (Mn2+), 15.7 K (Co2+) and 34 K (Ni2+), which are inversely proportional to the ionic radii of the metal cations. The Cu2+ member displays low-dimensional magnetism as a result of orbital ordering of the Cu2+ d orbitals originating from a Jahn–Teller distortion. Pulsed-field magnetization experiments (fields of up to 60 T at temperatures down to 0.6 K) show that Mn2+, Co2+ and Ni2+ formates display cation-characteristic spin flop transitions. A saturation magnetization value of 5 μB (at 12.5 T) was observed for Mn2+, meanwhile the Co2+ formate shows an orientation dependent quasi saturation (5.1 μB at 21 T along [101] vs. 5.8 μB at 26 T along [010]). The different isotropic/anisotropic behaviour can be explained by the orbital contribution to the magnetic response.
Introduction
Metal–Organic Frameworks (MOFs) are ordered crystalline structures formed by metal cations or metal clusters and multidentate organic linkers.1 The ligands act as spacers creating a porous framework which can be occupied by guest cations. Recent progress in MOF research has opened up new possibilities for designing materials with a rich variety of functional and multifunctional properties.2Among the group with shorter linkers and denser structures, the series [AmineHn][M(HCOO)3] have emerged as a new class of promising multifunctional materials. In these hybrid perovskites, M2+ is a transition-metal cation and AmineHn+ is a mid-sized protonated amine such as dimethylammonium,3,4 guanidinium,5 hydrazinium,6etc. Perovskite-like formates exhibit a broad range of functional properties, such as ferroelectricity,7–12 ferroelasticity,13 ferromagnetism,4,14 anomalous thermal expansion,6,15,16 polymorphism,17–19 multiferroicity,20–23 and magnetoelectric behaviour.24–28 Their structural simplicity, as in the case of classical perovskites, makes these compounds ideal candidates for composition/structure/property studies17,29 where the AmineHn+ and the metal cations can be systematically varied.
In this work we focus on a family of hybrid perovskites of formula [CH3NH3][M(HCOO)3]. The compounds with M = Mg2+, Mn2+, Fe2+, Co2+, Cu2+, Zn2+ and Cd2+ have been previously described16,30–32 and it has been shown that this family displays anomalous thermal expansion behaviour.16 Regarding the magnetic properties, the Mn2+ compound has been described as a weak ferromagnet below 7.8 K with a spin-flop transition at 0.45 T.32 We have recently reported magnetic ordering-induced multiferroic behaviour in the Co2+ compound together with a remarkable anisotropic magnetic and electric behaviour.28
Looking for additional interesting magnetic properties in the family [CH3NH3][M(HCOO)3] we extend the study to the magnetic members with M = Mn2+, Co2+, Cu2+ and Ni2+, the latter being a new compound. This study aims to establish the influence of the metal cations (ionic radius, spin configuration and orbital ordering) on the magnetic behaviour, as well as to study the magnetic response along the different orientations of single crystals.
We perform detailed structural characterization and magnetic measurements up to 60 Tesla on poly and single crystalline materials. In addition, we report a synthetic procedure that allows us to obtain large single crystals of these compounds, an important challenge in the field of MOFs.
Experimental
Synthesis
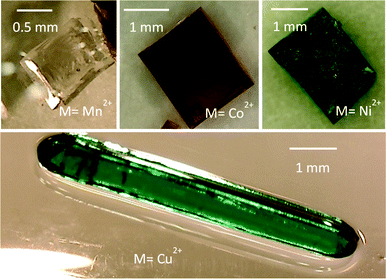
[CH3NH3][M(HCOO)3] compounds were all synthesized under solvothermal conditions from the corresponding starting chlorides, MCl2·nH2O (M = Mn2+, n = 4; M = Co2+, Ni2+, n = 6), or perchlorates, Cu(ClO4)2. All starting materials were commercially available, reagent grade and were used as purchased without further purification (Table S1, ESI†). The synthetic method described here is an adaptation of the one previously employed for analogue MOFs of formula [(CH3)2NH2][M(HCOO)3].3 Aqueous solutions of MCl2·nH2O or Cu(ClO4)2 (3 mL, 0.33 M), CH3NH3Cl (3 mL, 0.33 M) and NaHCOO (2 mL, 1.5 M) were mixed to give a M2+/CH3NH3+/3HCOO− stoichiometric solution. Afterwards, 8 mL of methylformamide (HCONHCH3) were added. The resultant solution was heated in a Teflon-lined autoclave (45 mL) at 140 °C for 72 hours, and after slow overnight cooling, crystals of the perovskite-like formates were obtained. They were filtered, washed with ethanol (3 × 5 mL) and dried at room temperature. The relatively low yield of the reactions (between 20–30%) together with the intense colours of the mother liquors (pink for Co2+, green for Ni2+ and blue for Cu2+) indicate incomplete reactions. The yield increased up to 85% by a slow evaporation process of the mother liquors which were kept in glass vials (approx. 8 mL of solution deposited on vials with a maximum capacity of 25 mL) between 1 (Mn2+) and 6 (Cu2+) weeks at room temperature. The as-prepared crystals are stable in air, mother liquor, methanol and ethanol. The good quality and a large size of almost cm-size in the case of the Cu2+ compound and around 2 mm in the case of the Mn2+, Co2+ and Ni2+ compounds (Fig. 1) have made possible the single crystal magnetic studies.Caution! Compounds containing perchlorates are potentially explosive. Care must be taken when preparing the samples, Teflon liners should be handled with great carefulness and appropriate safety procedures are required.
X-ray crystallography
Single-crystal data sets were collected at 100 K and room temperature using a Bruker-Nonius x8 Apex II X-ray diffractometer equipped with a CCD detector and using monochromatic Mo Kα1 radiation (λ = 0.71073 Å). Suitable crystals of the samples under study were chosen and mounted on a glass fibre using instant glue. Sample temperature was maintained using a cold stream of nitrogen from a Kyroflex cryostream cooler. The data integration and reduction was performed using the Apex2 V.1.0-27 (Bruker Nonius, 2005) suite software. The intensity collected was corrected for Lorentz and polarization effects and for absorption by semiempirical methods on the basis of symmetry-equivalent data using SADABS (2004) of the suite software.Powder X-ray diffraction data for the compounds were collected in the range of 10° < 2θ < 60° at room temperature in a Siemens D-5000 diffractometer using Cu Kα radiation (λ = 1.5418 Å) in a flat plate geometry. The PXRD pattern was analysed by the Le Bail profile analysis33 using the Fullprof suite software.34
Thermogravimetric measurements
Thermogravimetric analyses (TGA) were carried out using TGA-DTA Thermal Analysis SDT2960 equipment coupled to a Bruker Vector 22 IR spectrophotometer. For these experiments approximately 25 mg of the sample was heated at a rate of 5 °C min−1 from 25 to 550 °C using corundum crucibles under a flow of dry nitrogen.Magnetic measurements
The magnetic measurements were performed using superconducting (DC) and pulsed magnets.Low field magnetic properties of crystalline powders were studied using a superconducting quantum interference device (SQUID) magnetometer up to 5 T. The samples were mounted inside lightweight homogeneous plastic tubes provided by Quantum Design as sample holders, with a very small diamagnetic background (around 3 × 10⁻⁶ emu at 7 T). Single crystals, oriented by means of single-crystal X-ray diffraction, were measured on a vibrating sample magnetometer (VSM) in a Quantum Design Physical Properties Measurement System (PPMS) up to 13 T. For these measurements the samples were glued with GE varnish on a quartz cylinder which goes inside a brass hollow half tube.
The experimental susceptibilities were corrected for the diamagnetism of the constituent atoms using Pascal's tables35 and an experimental correction for the sample holder was applied.
Pulsed field magnetization experiments were done in a 1.5 mm bore, 1.5 mm long, 1500-turn radially compensated coil, constructed from a 50 gauge high-purity copper wire.36,37 The changing magnetic field induced a changing sample magnetic moment that in turn induced a voltage in the coil proportional to dM/dt. This signal was integrated in time to determine M(H).37 The samples were mounted within a 1.3 mm diameter ampoule that can be moved in and out of the coil.36 Accurate values of M were obtained by subtracting empty coil data from that measured under identical conditions with the sample present.
Fields were provided by a 65 T capacitor-driven short-pulse magnet at the NHMFL pulsed field facility sited in Los Alamos (LANL).37 The susceptometer was placed within a 3He cryostat providing temperatures down to 0.6 K. The applied magnetic field was measured by integrating the voltage induced in a ten-turn coil calibrated by observing the de Haas–van Alphen oscillations of the belly orbits of the copper coils of the susceptometer.36
Results and discussion
Basic characterization
We have confirmed the purity of the prepared materials by Le Bail refinements33 of the PXRD data obtained at room temperature (Fig. S1 and Table S2, ESI†). The thermal stability of the four compounds was investigated by TGA (Fig. S2a, ESI†). They are chemically stable up to 180 °C (Mn2+), 215 °C (Co2+), 180 °C (Ni2+) and 230 °C (Cu2+). Above these temperatures, the decomposition occurs in a two-step process for the Mn2+ and Co2+ formates, whilst for the Ni2+ and Cu2+ ones it occurs in a one-step process. As final products of the decomposition the following species were identified, respectively, by PXRD (see Fig. S2b, ESI†): MnO, CoO + Co, Ni and Cu.Crystal structures
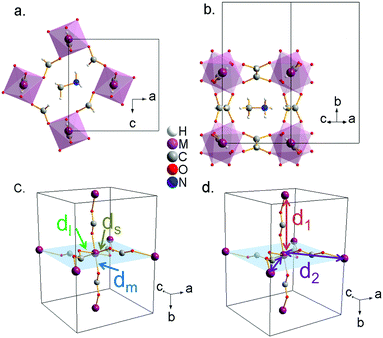
Single-crystal X-ray studies reveal that the prepared compounds have an orthorhombic structure with space-group Pnma (Z = 4). The obtained structural data, which are summarized in Table S3 (ESI†), are in agreement with the previously reported data for cobalt,30 manganese32 and copper31 formates. X-ray crystallographic data for nickel formate, which have not been previously reported, are provided in the CIF format as ESI.†All the studied compounds show a distorted perovskite-like structure (Fig. 2a and b) where the asymmetric unit contains one independent metal cation (M2+), two formate groups (HCOO−), and one methylammonium cation (CH3NH3+). The M2+ cation is connected to its six metal nearest neighbours through anti–anti bridging HCOO− anions resulting in a 3D [M(HCOO)3]− framework. The “pseudo” cubooctahedral cavities of the framework are occupied by the CH3NH3+ cations. In such cavities, the CH3NH3+ cations are strongly linked to the framework through H-bonds. In particular, each N-atom is linked to three formate ligands of the framework: (i) through two linear and stronger N–H⋯O hydrogen bonds within the ac-plane and (ii) through one bifurcated and weaker H-bond along the b-plane.28
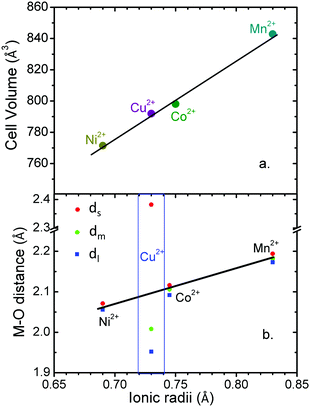
Additionally, in this work we perform a comparative structural study of the four perovskite-like formates (Table S4, ESI†). It is found that the cell volume increases almost linearly with the ionic radius of the metal cation (Fig. 3a). These compounds show three different M–O distances (Fig. 2c and 3b) which have been termed as ds (short), dm (medium) and dl (long). The M–O bond distance increases linearly with the ionic radius (except for M = Cu2+). dm is found along the b axis, while ds and dl alternate in the ac plane. This M–O arrangement yields two different M–M distances: d1 along the b axis and d2 along the ac plane (Fig. 2d). Table S5 (ESI†) shows the values of metal–oxygen (M–O) and metal–metal (M–M) distances measured at room temperature.
Although all metal formates show several M–O (and M–M) distances, they do not differ much (approximately ±0.02 Å). An exception is the copper formate, whose long distance (dl = 2.382(1) Å) shows a large difference (0.4 Å) from the short (ds = 1.952(1) Å) and the medium ones (dm = 2.008(1) Å). We suggest that the octahedral distortions in the Mn2+, Co2+ and Ni2+ compounds on the one hand and the Cu2+ compound on the other have two different origins. In the case of the Mn2+, Co2+ and Ni2+ compounds, the hydrogen bonds play an important role in the distortion of the framework. In fact, as a consequence of the H-bonds, the [M(HCOO)3]− framework displays a slight distortion of the MO6 octahedral environment with three different M–O bond lengths: (i) one short M–O bond length (ds) within the ac-plane involving an O atom which is not forming H-bonds, (ii) one large M–O bond length (dl) within the ac-plane involving an O atom which is forming a strong linear H-bond, (iii) one medium M–O bond length (dm) along the b-axis involving an O-atom which is forming a weak bifurcated H-bond. Therefore, the stronger the H-bonds, the weaker the M–O bonds are.
On the other hand, for the Cu2+ formate, the octahedral distortion originates from the Jahn–Teller effect, typically observed for Cu2+ cations in an octahedral environment. The octahedral distortion, a combination of the Q2 and Q3 mode, is very large showing a 4.2% contraction of two M–O bonds, a 6.9% contraction of another M–O bonds and a 14% expansion of the remaining two M–O bonds. This finding indicates that the Cu2+ compound displays an orbital ordering where the completely filled dz2 orbitals are cooperatively ordered within the ac plane in a checkerboard configuration (Fig. S3, ESI†).
Despite this Jahn–Teller distortion, [CH3NH3][Cu(HCOO)3] crystallizes in the same space group (Pnma) as the rest of the methylammonium M2+ formates, since the change in the coordination environment of the Cu2+ cations causes no change in the arrangement of the hydrogen bonds. This contrasts with other series of alkylammonium formates, including dimethylammonium and guanidinium, whose symmetry decreases as a result of the Jahn–Teller distortion.4,5,38,39 Although the crystal structure of the copper formate is the same as the rest of the series, the presence of an elongated M–M distance affects its magnetic properties, as it will be discussed later.
Magnetic properties
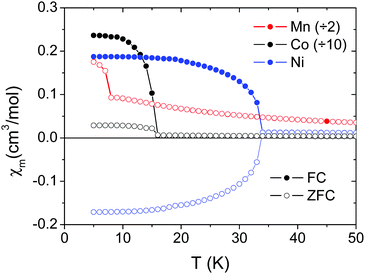
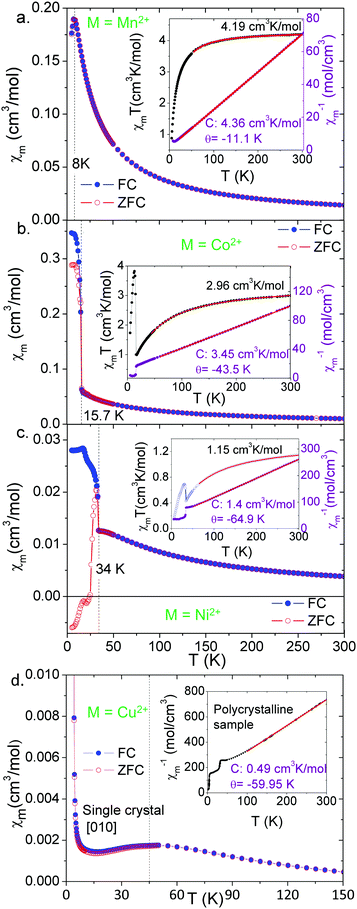
The transition temperatures are 8.0 K for Mn2+, 15.7 K for Co2+ and 34.0 K for Ni2+. These temperatures decrease with increasing ionic radius of the M2+ cation. Single crystal data for the Ni2+ compound along [101] and [010] are also shown in Fig. S4 (ESI†). Negative values under ZFC conditions below the magnetic ordering temperature in Fig. 4, 5 and Fig. S4 (ESI†) are a consequence of the negative remanent magnetic fields in the superconducting magnets which are impossible to remove completely.
Fig. 5 shows magnetic susceptibility χmvs. temperature T for all four samples: polycrystals of M = Mn2+, Co2+ and Ni2+, and single crystals of M = Cu2+ for M||H||[010]. M = Cu2+ displays very different behavior from the other compounds, shown in Fig. 5d, with no hysteresis or sharp transitions at low temperatures. We perform two fits to the data for all four materials. First we fit a Curie–Weiss law to the data above the transition, and the parameters of this fit are shown in Table 1. All four compounds show negative Curie–Weiss temperatures indicating antiferromagnetic interactions, in contrast to the ferromagnetic-like hysteresis and upturns seen in magnetization. The Curie–Weiss temperature increases with ionic radius, except for the Cu2+ compound. The effective moments from the Curie–Weiss fits are 5.91 μB for Mn2+, 5.23 μB for Co2+, 3.35 μB for Ni2+, and 1.98 μB for Cu2+. These are consistent with the high spin S = 5/2 Mn2+, S = 1 Ni2+. For the Co2+ and Cu2+ compounds, the moment is higher than expected for a spin-only S = 3/2 (Co2+) or S = 1/2 (Cu2+) ion, indicating strong orbital contributions. These results are consistent with other perovskite-like formates, and we show comparisons to the previous literature in the ESI† (Tables S6–S9).
| [CH3NH3][M(HCOO)3] | ||||
|---|---|---|---|---|
| M2+ | Mn2+ | Co2+ | Ni2+ | Cu2+ |
| S (High spin) | 5/2 | 3/2 | 1 | 1/2 |
| T t /K | 8 | 15.7 | 34 | 45 & 4 |
| θ/K | −11.1 | −43.5 | −64.9 | −59.9 |
| C/cm−3 K mol−1 | 4.36 | 3.45 | 1.40 | 0.49 |
| C (spin-only)/cm3 K mol−1 | 4.37 | 1.87 | 1 | 0.37 |
| χ m T (300 K)/cm3 K mol−1 | 4.19 | 2.96 | 1.15 | 0.41 |
| μ eff/μB | 5.9 | 5.2 | 3.3 | 2.0 |
| μ s/μB | 5.92 | 3.88 | 2.83 | 1.73 |
| J/cm−1 | −0.39 | −3.5 | −9.38 | −48.8 |
| g | 1.99 | 2.69 | 2.33 | 2.21 |
The existence of hysteretic magnetization in the presence of antiferromagnetic interactions can be explained by weak-ferromagnetic spin canting from a Dzyaloshinskii–Moriya interaction. Dzyaloshinskii–Moriya interactions, favouring non-collinear spin alignments, can be expected due to the lack of inversion symmetry in the formate super exchange bonds connecting the metal cations for all four compounds. For the M = Co2+ compound, Dzyaloshinskii–Moriya interactions have been identified as a source of magnetically-induced ferroelectricity.28
Next we roughly estimate the size of the antiferromagnetic exchange interactions (J) by fitting the magnetic susceptibility vs. temperature data of the M = Mn2+, Co2+ and Ni2+ compounds with the high-temperature expansion series proposed by Lines.40 The unit cell is a simple cubic lattice with antiferromagnetic interactions. The results of these fits are shown in the insets to Fig. 5a–c, and summarized in Table 1.
The M = Cu2+ compound shows qualitatively different behaviour from the other three compounds (Fig. 5d). The temperature dependence of the magnetic susceptibility for the single crystal for fields along [010] shows two magnetic transitions. The first is a broad peak around 45.0 K, and the second is a sharp increase in the magnetization near 4.0 K. In light of the structural data that support Jahn–Teller distortions and orbital ordering of the Cu2+ d orbitals, we can expect low-dimensional magnetic behaviour in this compound. Along the b axis, the shorter Cu–Cu distances and the interactions of the half-filled dx2–y2 orbitals through the formate anions should create significantly stronger antiferromagnetic interactions than along other directions, according to the Goodenough–Kanamori–Anderson rules.41 We fit the magnetic susceptibility data to a Bonner–Fisher model42 (Fig. S5, ESI†) to extract the 1-D antiferromagnetic intrachain exchange of −48.4 cm−1 (listed in Table 1). This fit is approximate since it is not a purely 1-D material. Therefore, we interpret the broad transition at 45.0 K as 1-D coupling along the b-axis, consistent with the antiferromagnetic Curie–Weiss temperature of −59.95 K, and an antiferromagnetic J of roughly −48 cm−1. The sharp upturn at 4.0 K is consistent with the weaker magnetic exchange interactions along the ac direction coupling the 1-D chains into a 3-D long-range ordered state. For getting an estimation of the antiferromagnetic interchain exchange constant J⊥ we have used the mean-field theory developed by Schulz,43 which yields a value of |J⊥| ≈ 0.5 cm−1. The notorious difference in the relative strength of the inter- versus intra-chain coupling clearly supports the 1D-character of the magnetism displayed by this Cu-MOF.
The Goodenough–Kanamori–Anderson rules would suggest weak ferromagnetic coupling in the ac plane via the interaction of the dz2 orbital with the half-filled dx2–y2 orbitals. In addition, the Dzyaloshinskii–Moriya interaction can also be expected to induce some spin canting along all magnetic bonds since there are no bonds that obey spatial-inversion symmetry. Thus the final structure is strongly-coupled antiferromagnetic chains along the b-axis that are weakly ferromagnetically coupled in the ac plane with a certain degree of spin canting (Fig. S6, ESI†), as indicated by the small hysteresis loop observed at 2 K (Fig. S7, ESI†).
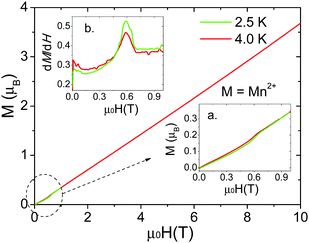
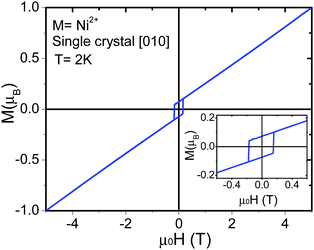
Isothermal magnetization measurements were performed for single crystals of all the compounds at low temperature reaching fields of up to 10 T. For the Mn2+ compound, a single crystal was measured at 2.5 K and 4.0 K (Fig. 6). The results confirm the existence of a spin-flop transition around 0.6 T.32 On the other hand, for the Co2+ and Ni2+ compounds (Fig. 7 and Fig. S8, S9, ESI†), the data obtained along the [010] direction show perfect square hysteresis loops with coercive fields of 0.4 T for Co2+ and 0.15 T for Ni2+, and remanent magnetization values of 0.19 μB for Co2+ and 0.07 μB for Ni2+. Furthermore, hysteresis loop measurements of the Co2+ compound along [010] at different temperatures show that the coercive field decreases while the remanent magnetization remains constant.28 This unusual magnetic hysteresis has previously been argued to not originate from magnetic domains. When the magnetic field is applied along the [101] direction of the Co2+ compound, a magnetic anomaly appears around 2.5 T (Fig. S10, ESI†). The magnetization along this direction shows a “wasp-waist” curve, and although a double hysteresis loop is observed (2.5 T up and 0.2 T down), it does not show remanent magnetization at 0 T. This anomaly moves towards lower magnetic fields when the temperature is increased. As we discussed in a recent paper,28 this anomaly is related to a spin rearrangement which induces a change in the electric polarization along the [101] and [10−1] directions.
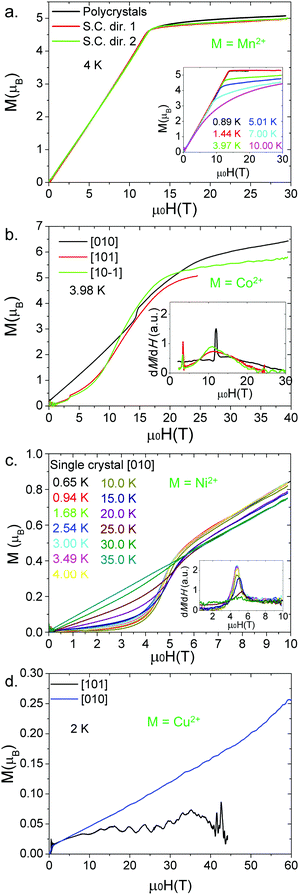
The magnetic exchange (J) was calculated using the mean field theory:45gμBBc = |z(2JS)|, where S = 5/2 for Mn2+, z is the number of nearest neighbours in the framework (in this case z = 6), g = 1.99 (calculated from the Lines model), and μB is the Bohr magneton. Using this equation, a value of −0.4 J cm−1 was obtained, close to the one estimated by the Lines model fitting (the inset of Fig. 5a). Additionally, the evolution of the magnetization under pulsed fields is shown as a function of the temperature in the inset of Fig. 8a. We found that both the saturation field and the saturation magnetization decrease with temperature.
Fig. 8b shows the magnetization measurements (M) along the [010], [101] and [10−1] directions of a [CH3NH3][Co(HCOO)3] single crystal at 3.98 K. The [101] and [10−1] curves almost overlap. In these two curves the magnetization increases quickly until it reaches a field (Bc) from which the increase of the magnetization is small. In this regard we correlate Bc with the field needed to reach the saturation of the spin component of the magnetic moment of the Co2+ cations, while the onwards slow increase of the magnetization is related to the orbital moment of such cations (H.S. Co2+ shows a strong contribution from L). Bc is dependent on the crystal direction (26 T along [010] versus 21 T along [101] and [10−1]). These differences indicate that the pulsed field magnetic response of [CH3NH3][Co(HCOO)3] is anisotropic, in contrast with [CH3NH3][Mn(HCOO)3], whose response is equal in all directions, highlighting the influence of the spin configuration (d5-isotropic vs. d7-anisotropic) and the contribution of the orbital moment L on the obtained magnetic response in this family of formates.
An additional magnetic transition, which appears at 14.4 T around 4 K, is observed when a single crystal is measured in pulsed fields along the [010] direction. This transition is shifted to lower fields upon heating the sample until it finally disappears around 15 K (close to the magnetic ordering temperature). Since this transition appears along the easier magnetization axis and the magnetization after the transition can be extrapolated to the origin, it is consistent with a spin-flop transition.28
For the [CH3NH3][Ni(HCOO)3] compound, isothermal magnetization measurements of a polycrystalline sample (Fig. S11, ESI†) and a single crystal along [010] (Fig. 8c) show that the magnetization increases with the magnetic field. No saturation is observed for fields up to 60 T indicating a very strong magnetic coupling between the Ni2+ cations, and supports the results obtained from the Lines model fitting (J = −9.38 cm−1). A concavity in the magnetization curve is observed at approximately 5 T (Fig. 8c). As for [CH3NH3][Co(HCOO)3],28 this magnetic anomaly is consistent with a spin flop transition.
For a [CH3NH3][Cu(HCOO)3] single crystal measured along the [010] direction (Fig. 8d) at 2 K, the magnetization increases with the magnetic field but there is no sign of saturation even at 60 T. Measurements along [101] give a very low and noisy signal. These results show a dramatic anisotropy of the magnetization between the [010] and [101] (equivalent to [10−1]) directions which is consistent with the anisotropic 1D magnetic behaviour due to Jahn–Teller-induced orbital ordering as previously discussed.
Conclusions
High quality single crystals of cm-size in the case of M = Cu2+ and mm-size in the case of M = Mn2+, Co2+ and Ni2+ have been prepared by a combination of solvothermal and slow evaporation methods. The [CH3NH3][Ni(HCOO)3] compound is described for the first time in this paper.The four compounds crystallize in the Pnma space group and show a perovskite-like structure. There is a direct correlation between the metal cation size and the cell volume. These compounds present three different M–O distances that for Mn2+, Co2+ and Ni2+ are related to a distortion induced by the H-bonds between the CH3NH3+ cations and the M(HCOO)3− framework; while for Cu2+ formate the cause is the orbital ordering.
Magnetization measurements performed under static magnetic fields (SQUID and VSM) show that the compounds are weak ferromagnets. The negative values obtained for the Curie–Weiss temperature (θ) and the magnetic coupling constant (J) indicate that these compounds exhibit antiferromagnetic order with a weak ferromagnetic component due to Dzyaloshinskii–Moriya spin canting. Magnetic ordering temperatures are 8.0 K for Mn2+, 15.7 K for Co2+, 34.0 K for Ni2+ and 45.0 K for Cu2+, the latter shows a second magnetic transition at 4.0 K. For the Mn2+, Co2+ and Ni2+ formates, the magnetic ordering temperature is inversely proportional to the distance M–M. These three compounds exhibit a very similar 3-D magnetic structure, which can be viewed as a simple cubic lattice in which the cations M2+ are coupled antiferromagnetically.
As a result of the Jahn–Teller distortion, the Cu2+ formate shows a different magnetic structure which consists of 1-D antiferromagnetic chains along the b axis (1-D magnetic transition at 45.0 K) that in turn are coupled in the ac plane by weak ferromagnetic interactions (magnetic transition around 4.0 K) giving rise to 3D magnetism.
The Mn2+, Co2+ and Ni2+ formates show an easier magnetization axis, along the [010] direction, with the following characteristics:
• a weak ferromagnetic component due to spin canting likely originating from the Dzyaloshinskii–Moriya interaction;
• square hysteresis loops (for Co2+ and Ni2+);
• spin-flop transitions, which when measured at 2.5 K appear at 0.6 T for Mn2+, 14.5 T for Co2+ and 5 T for Ni2+;
Additionally, for [CH3NH3][Co(HCOO)3] along [101] and [10−1] directions, a magnetic transition, due to a phenomenon of spin rearrangement (3.5 T at 2.5 K), has been observed.
Saturation of the magnetization at a sharp field-induced phase transition is observed for the Mn2+ (12.5 T) and Co2+ (21 to 26 T, depending on the crystal direction) compounds; meanwhile Ni2+ and Cu2+ formates do not saturate by 60 T. The saturation magnetization measured for the Mn2+ formate, around 5 μB, is expected for a d5 spin configuration. Furthermore, magnetization is identical for the different measured directions of the crystal and the powdered sample, which highlights the strong magnetic isotropy of the compound. In contrast, the magnetic response of the Co2+ formate is clearly anisotropic due to the strong contribution of the unquenched orbital moment L, usually found in compounds containing high spin Co2+ ions (spin configuration d7).46
Finally, it would be interesting to directly probe the complex magnetism of these compounds by neutron diffraction, a very powerful technique for examining in detail magnetic interactions47,48 and magnetic anisotropy49 that despite some difficulties in the case of dealing with MOFs can also be successfully applied to the study of these types of materials.50
Acknowledgements
The Spanish authors are grateful for financial support from Ministerio de Economía y Competitividad (MINECO) (Spain) and EU under the project ENE2014-56237-C4-4-R, and Xunta de Galicia under the project GRC2014/042. L. C. G.-A. acknowledges UDC for a predoctoral fellowship and Fundación Barrié for the research stay grant at LANL. Work at LANL, A. P. H. and B. P.-D.'s visit to LANL were funded by the Laboratory Directed Research and Development program at LANL. The NHMFL pulsed-field facility is funded by the U.S. National Science Foundation through Cooperative Grant No. DMR-1157490, the State of Florida, and the U.S. Department of Energy.Notes and references
- J. L. C. Rowsell and O. M. Yaghi, Microporous Mesoporous Mater., 2004, 73, 3–14 CrossRef CAS
.
- A. K. Cheetham and C. N. R. Rao, Science, 2007, 318, 58–59 CrossRef CAS PubMed
.
- X.-Y. Wang, L. Gan, S.-W. Zhang and S. Gao, Inorg. Chem., 2004, 43, 4615–4625 CrossRef CAS PubMed
.
- P. J. Baker, T. Lancaster, I. Franke, W. Hayes, S. J. Blundell, F. L. Pratt, P. Jain, Z.-M. Wang and M. Kurmoo, Phys. Rev. B: Condens. Matter Mater. Phys., 2010, 280, 18–21 Search PubMed
.
- K.-L. Hu, M. Kurmoo, Z. Wang and S. Gao, Chem. – Eur. J., 2009, 15, 12050–12064 CrossRef CAS PubMed
.
- S. Chen, R. Shang, K.-L. Hu, Z.-M. Wang and S. Gao, Inorg. Chem. Front., 2014, 1, 83–98 RSC
.
- P. Jain, N. S. Dalal, B. H. Toby, H. W. Kroto and A. K. Cheetham, J. Am. Chem. Soc., 2008, 130, 10450–10451 CrossRef CAS PubMed
.
- B. Pato-Doldán, M. Sánchez-Andújar, L. C. Gómez-Aguirre, S. Yáñez-Vilar, J. López-Beceiro, C. Gracia-Fernández, A. A. Haghighirad, F. Ritter, S. Castro-García and M. A. Señarís-Rodríguez, Phys. Chem. Chem. Phys., 2012, 14, 8498–8501 RSC
.
- M. Sánchez-Andújar, S. Presedo, S. Yáñez-Vilar, S. Castro-García, J. Shamir and M. A. Señarís-Rodríguez, Inorg. Chem., 2010, 49, 1510–1516 CrossRef PubMed
.
- M. Mączka, W. Zierkiewicz, D. Michalska and J. Hanuza, Spectrochim. Acta, Part A, 2014, 128, 674–680 CrossRef PubMed
.
- T. Besara, P. Jain, N. S. Dalal, P. L. Kuhns, A. P. Reyes, H. W. Kroto and A. K. Cheetham, Proc. Natl. Acad. Sci. U. S. A., 2011, 108, 6828–6832 CrossRef
.
- M. Guo, H.-L. Cai and R.-G. Xiong, Inorg. Chem. Commun., 2010, 13, 1590–1598 CrossRef CAS
.
- W. Li, Z. Zhang, E. G. Bithell, A. S. Batsanov, P. T. Barton, P. J. Saines, P. Jain, C. J. Howard, M. A. Carpenter and A. K. Cheetham, Acta Mater., 2013, 61, 4928–4938 CrossRef CAS
.
- K. Vinod, C. S. Deepak, S. Sharma, D. Sornadurai, A. T. Satya, T. R. Ravindran, C. S. Sundar and A. Bharathi, RSC Adv., 2015, 5, 37818–37822 RSC
.
- R. Shang, G.-C. Xu, Z.-M. Wang and S. Gao, Chem. – Eur. J., 2014, 20, 1146–1158 CrossRef CAS PubMed
.
- I. E. Collings, J. A. Hill, A. B. Cairns, R. I. Cooper, A. L. Thompson, J. E. Parker, C. C. Tang and A. L. Goodwin, Dalton Trans., 2016, 45, 4169–4178 RSC
.
- G. Kieslich, S. Sun and A. K. Cheetham, Chem. Sci., 2015, 6, 3430–3433 RSC
.
- Z. Duan, Z. Wang and S. Gao, Dalton Trans., 2011, 40, 4465–4473 RSC
.
- S. M. Bovill and P. J. Saines, CrystEngComm, 2015, 17, 8319–8326 RSC
.
- P. Jain, V. Ramachandran, R. J. Clark, H. D. Zhou, B. H. Toby, N. S. Dalal, H. W. Kroto and A. K. Cheetham, J. Am. Chem. Soc., 2009, 131, 13625–13627 CrossRef CAS PubMed
.
- G. Rogez, N. Viart and M. Drillon, Angew. Chem., Int. Ed., 2010, 49, 1921–1923 CrossRef CAS PubMed
.
- M. Mączka, A. Gągor, B. Macalik, A. Pikul, M. Ptak and J. Hanuza, Inorg. Chem., 2014, 53, 457–467 CrossRef PubMed
.
- D.-W. Fu, W. Zhang, H.-L. Cai, Y. Zhang, J.-Z. Ge, R.-G. Xiong, S. D. Huang and T. Nakamura, Angew. Chem., Int. Ed., 2011, 50, 11947–11951 CrossRef CAS PubMed
.
- Y. Tian, A. Stroppa, Y. Chai, L. L.-Q. Yan, S.-G. S. Wang, P. Barone, S. Picozzi, Y. Sun, W. Wang, L. L.-Q. Yan, J.-Z. Cong, Y.-L. Zhao, F. Wang, S.-P. Shen, T. Zou, D. Zhang, S.-G. S. Wang, X.-F. Han and Y. Sun, Sci. Rep., 2013, 3, 2024 Search PubMed
.
- Y. Tian, A. Stroppa, Y. Chai, L. Yan, S. Wang, P. Barone, S. Picozzi and Y. Sun, Sci. Rep., 2014, 4, 6062 CrossRef CAS PubMed
.
- A. Stroppa, P. Barone, P. Jain, J. M. Perez-Mato and S. Picozzi, Adv. Mater., 2013, 25, 2284–2290 CrossRef CAS PubMed
.
- R. I. Thomson, P. Jain, A. K. Cheetham and M. A. Carpenter, Phys. Rev. B: Condens. Matter Mater. Phys., 2012, 86, 214304 CrossRef
.
- L. C. Gómez-Aguirre, B. Pato-Doldán, J. Mira, S. Castro-García, M. A. Señarís-Rodríguez, M. Sánchez-Andújar, J. Singleton and V. S. Zapf, J. Am. Chem. Soc., 2016, 138, 1122–1125 CrossRef PubMed
.
- G. Kieslich, S. Sun and A. K. Cheetham, Chem. Sci., 2014, 5, 4712–4715 RSC
.
- M. Boča, I. Svoboda, F. Renz and H. Fuess, Acta Crystallogr., Sect. C: Cryst. Struct. Commun., 2004, 60, m631–m633 Search PubMed
.
- G. A. Nifontova, O. S. Filipenko, A. S. Astakhova, I. P. Lavrent'ev and L. O. Atovmyan, Koord. Khim., 1990, 16, 218–224 CAS
.
- Z. Wang, B. Zhang, T. Otsuka, K. Inoue, H. Kobayashi and M. Kurmoo, Dalton Trans., 2004, 2209–2216 RSC
.
- A. Le Bail, H. Duroy and J. L. Fourquet, Mater. Res. Bull., 1988, 23, 447–452 CrossRef CAS
.
- J. Rodríguez-Carvajal, Newsl. Powder Diffr. Comm. Int. Union Crystallogr., 2001, 26, 12–19 Search PubMed
.
- G. A. Bain and J. F. Berry, J. Chem. Educ., 2008, 85, 532 CrossRef CAS
.
- P. A. Goddard, J. Singleton, A. L. Lima Sharma, E. Morosan, S. J. Blundell, S. L. Bud'ko and P. C. Canfield, Phys. Rev. B: Condens. Matter Mater. Phys., 2007, 75, 94426 CrossRef
.
- M. Jaime, A. Lacerda, Y. Takano and G. S. Boebinger, J. Phys.: Conf. Ser., 2006, 51, 643–646 CrossRef
.
- E. Sletten and L. H. Jensen, Acta Crystallogr., Sect. B: Struct. Crystallogr. Cryst. Chem., 1973, 29, 1752–1756 CrossRef CAS
.
- A. Stroppa, P. Jain, P. Barone, M. Marsman, J. M. Perez-Mato, A. K. Cheetham, H. W. Kroto and S. Picozzi, Angew. Chem., Int. Ed., 2011, 50, 5847–5850 CrossRef CAS PubMed
.
- M. Lines, J. Phys. Chem. Solids, 1970, 31, 101–116 CrossRef CAS
.
-
J. B. Goodenough, Magnetism and the chemical bond, 1963 Search PubMed
.
- J. Bonner and M. Fisher, Phys. Rev., 1964, 135, A640–A658 CrossRef
.
- H. J. Schulz, Phys. Rev. Lett., 1996, 77, 2790–2793 CrossRef PubMed
.
- J. L. Manson, Q. Huang, C. M. Brown, J. W. Lynn, M. B. Stone, J. Singleton and F. Xiao, Inorg. Chem., 2015, 54, 11897–11905 CrossRef CAS PubMed
.
- T. V. Brinzari, J. T. Haraldsen, P. Chen, Q.-C. Sun, Y. Kim, L.-C. Tung, A. P. Litvinchuk, J. A. Schlueter, D. Smirnov, J. L. Manson, J. Singleton and J. L. Musfeldt, Phys. Rev. Lett., 2013, 111, 47202 CrossRef CAS PubMed
.
- F. Lloret, M. Julve, J. Cano, R. Ruiz-García and E. Pardo, Inorg. Chim. Acta, 2008, 361, 3432–3445 CrossRef CAS
.
-
A. Furrer, J. Mesot and T. Strässle, Neutron Scattering in Condensed Matter Physics, World Scientific, 2009 Search PubMed
.
-
Structure Determination from Powder Diffraction Data, ed. W. I. F. David, K. Shankland, L. B. McCusker and C. Bärlocher, Oxford University Press, 2006 Search PubMed
.
- K. Ridier, A. Mondal, C. Boilleau, O. Cador, B. Gillon, G. Chaboussant, B. Le guennic, K. Costuas and R. Lescouëzec, Angew. Chem., Int. Ed., 2016, 55, 3963–3967 CrossRef CAS PubMed
.
- J. M. M. Lawler, P. Manuel, A. L. Thompson and P. J. Saines, Dalton Trans., 2015, 44, 11613–11620 RSC
.
Footnotes |
| † Electronic supplementary information (ESI) available: Tables S1 to S9, Fig. S1 to S11. CCDC 1504202. For ESI and crystallographic data in CIF or other electronic format see DOI: 10.1039/c6tc03992h |
| ‡ Present address: University of Bergen, P.O. Box 7803, N-5020 Bergen, Norway. |
| § These two authors contributed equally. |
| This journal is © The Royal Society of Chemistry 2016 |

