New insight into the crystal structure of Sr4Ca(PO4)2SiO4 and the photoluminescence tuning of Sr4Ca(PO4)2SiO4:Ce3+,Na+,Eu2+ phosphors†
Received
5th August 2016
, Accepted 4th September 2016
First published on 5th September 2016
Abstract
A new single phase based on the substitution of a Sr cation by a Ca cation in the apatite-type Sr5(PO4)2(SiO4) has been fabricated with the nominal chemical composition of Sr4Ca(PO4)2(SiO4), which appears as a definite compound rather than a solid solution between (Sr,Ca)3(PO4)2 and (Sr,Ca)2SiO4. The crystal structure of Sr4Ca(PO4)2(SiO4) has been firstly analysed by the difference electron map, and further resolved by the Rietveld refinement, and the final composition has been determined as Sr4Ca(PO4)(2+x)(SiO4)(1−x)(OH)x (x = 0.64) with a hexagonal cell (P63/m). The Ce3+/Eu2+ codoped Sr4Ca(PO4)2SiO4 phosphors have been designed and prepared by the solid state method, and the photoluminescence tuning from blue to green upon 365 nm ultraviolet (UV) radiation can be realized, which is ascribed to the energy transfer from Ce3+ to Eu2+ ions. The luminescence properties and the energy transfer mechanism in Ce3+/Eu2+ codoped Sr4Ca(PO4)2SiO4 phosphors have been discussed, which might act as potential candidates for blue-green components in UV-pumped white light emitting diodes (WLEDs).
1. Introduction
Apatite minerals form a large family of inorganic compounds with the general formula of M10(TO4)6X2 (M = Ca2+, Sr2+, Ba2+; TO4 = PO43−, VO43−, AsO43−; X = OH−, F−, Cl−), which crystallize in a hexagonal system (space group P63/m) and the structures are characterized by the presence of tunnels containing mobile X ions.1–3 In recent years, apatite-like compounds have been widely investigated for many kinds of applications including biocompatible materials, electrolytes, phosphor hosts for white light emitting diodes (WLEDs), and so on.4–6 As an adaptable crystal structure, the newly reported concept on the chemical unit cosubstitution can be used to design new apatite-type compounds or some derived phases.7–9 Accordingly, compared to the typical apatite compound (Sr,Ca)5(TO4)3X, the (Sr,Ca)5(PO4)2(SiO4) phase was designed from the substitution of (PO4)3− + X− → (SiO4)4−, and there does not exist any halogen atoms in the structure. However, the crystal structure of (Sr,Ca)5(PO4)2(SiO4) has some relationship to that of the apatite phase but not isotypic.10 In some cases, it can also be related to the solid solution between (Sr,Ca)3(PO4)2 and (Sr,Ca)2SiO4, but they are totally different upon checking their corresponding crystallographic parameters. Nevertheless, we know that both β-Ca3(PO4)2 type (Sr,Ca)3(PO4)2 and orthosilicate phase (Sr,Ca)2SiO4 belong to the excellent phosphor host, and Eu2+/Ce3+ in these hosts can show excellent luminescence properties with broad-band excitation and emission, tunable emission from blue to red, and high luminescence efficiencies, and so on.11–13
Therefore, the excellent luminescence properties of Eu2+/Ce3+ in the (Sr,Ca)5(PO4)2(SiO4) phase and potential diverse applications are also expected.14 Previously, Blasse briefly reported the luminescence of Eu2+ in Sr5(PO4)2(SiO4);15 after that, Seo's and Hong's group reported the green-emitting Sr5(PO4)2(SiO4):Eu2+ and Ca5(PO4)2(SiO4):Eu2+ phosphors for WLEDs, respectively.16,17 Moreover, Seo's group reported the structural phase formation and tunable luminescence in (Ca,Sr,Ba)5(PO4)2(SiO4):Eu2+ phosphors;18 Wang's group reported the white light emitting mono Ce3+ doped Sr5(PO4)2(SiO4) phosphors;19 and Lin's group reported the tunable luminescence and energy transfer properties of single-composition phosphors Ca5(PO4)2(SiO4):Ce3+,Tb3+,Mn2+.20 It is clearly found that Eu2+/Ce3+ doped (Sr,Ca)5(PO4)2(SiO4) phosphors demonstrated interesting luminescence properties and deserved extensive investigations. However, we can also find that the intermediate compositions in such a kind of compounds have no report, and the crystal structure of the (Sr,Ca)5(PO4)2(SiO4) phase is not well established.
In the present study, a new single phase based on the substitution of a Sr cation by a Ca cation in Sr5(PO4)2(SiO4) has been prepared with the nominal chemical composition of Sr4Ca(PO4)2(SiO4). On the basis of the difference electron map and Rietveld refinement from the XRD pattern, the final composition of Sr4Ca(PO4)2(SiO4) has been determined as Sr4Ca(PO4)(2+x)(SiO4)(1−x)(OH)x (x = 0.64) with a hexagonal cell (P63/m), and the crystal structure has been carefully described in this paper. Moreover, Ce3+/Eu2+ codoped Sr4Ca(PO4)2SiO4 phosphors have been prepared by the solid state method, and the photoluminescence tuning from blue to green has been realized based on the energy transfer of Ce3+ to Eu2+ ions, which might act as potential candidates for blue-green components in UV-pumped WLEDs.
2. Experimental section
2.1 Materials and synthesis
The nominal Sr4Ca(PO4)2(SiO4) compound and the phosphors of Sr3.8−xCa(PO4)2SiO4:0.1Ce3+,0.1Na+,xEu2+(x = 0, 0.003, 0.01, 0.03 and 0.06) were prepared by the conventional solid-state reaction method. The starting materials were SrCO3 (99.99%), CaCO3 (99.99%), NH4H2PO4 (99.99%), SiO2 (99.99%), Na2CO3 (99.99%), CeO2 (99.99%) and Eu2O3 (99.99%). Among them, the monovalent cation Na+ is used to realize charge equalization when the trivalent activator Ce3+ was used to replace the Sr2+ ions. The stoichiometric chemicals were weighed as the above nominal compositions and thoroughly mixed in an agate mortar, then transferred to a corundum crucible and heated at 1400 °C (in reductive atmosphere) for 6 h. Finally, the prepared phosphors were cooled to room temperature and reground for further measurements.
2.2 Characterization
The phase structures of the as-synthesized samples were checked using a D8 Advance diffractometer (Bruker Corporation, Germany) operating at 40 kV and 40 mA under Cu Kα radiation (λ = 1.5406 Å). The photoluminescence emission (PL) and photoluminescence excitation (PLE) spectra were recorded using a fluorescence spectrophotometer (F-4600, HITACHI, Japan) equipped with a photomultiplier tube operating at 400 V, and a 150 W Xenon lamp as the excitation source. The temperature dependent photoluminescence spectra have been measured by the same spectrophotometer, and it was combined with a self-made heating attachment and a computer-controlled electric furnace (Tianjin Orient KOJI Co., Ltd, TAP-02). The luminescence decay curves were obtained using a FLSP9200 fluorescence spectrophotometer (Edinburgh Instruments Ltd, UK), and an nF900 flash lamp was used as the excitation source.
3. Results and discussion
3.1 Phase formation and crystal structure
The diffraction data of the as-prepared nominal Sr4Ca(PO4)2(SiO4) compound for Rietveld analysis were collected at room temperature with a step size of 2θ being 0.01313°, and the counting time was 5 s per step. Rietveld refinement was performed by using TOPAS 4.2. Almost all peaks were indexed to the hexagonal cell (P63/m) with parameters close to Sr5(PO4)3(OH) (strontium-apatite structure).21 Therefore, the crystal structure of Sr5(PO4)3(OH) was taken as a starting model for Rietveld refinement. Sites of Sr ions were equally occupied by Sr and Ca ions, the site of P was also occupied by P and Si randomly. All these occupancies were refined in an assumption that the sum of occupancies in each site is equal to 1. The OH group was deleted at the first stage of refinement due to the suggested formula Sr4Ca(PO4)2SiO4. Refinement gave a low R-factor (RB = 1.99%). However, as given in Fig. 1, it demonstrated the difference electron map calculated using the Fobs − Fcalc difference of observed and calculated structural amplitudes (herein, Fobs are the observed structure-factor amplitudes, Fcalc are the calculated structure-factor amplitudes which were calculated from the atom coordinates of the model). The results showed maxima at (0, 0, x) (x ∼ 0.2) and several symmetry equivalent maxima. It was known that these peaks corresponded to OH− ions because (0, 0, 0.2) is close to the position of the OH− ion (0, 0, 0.1856(14)) in Sr5(PO4)3(OH). Therefore it was suggested to return the OH group in the model. It is believed that the residual H2O molecules combined with starting materials and the H2O in the air can promote the phase formation of Sr4Ca(PO4)(2+x)(SiO4)(1−x)(OH)x, which enabled the presence of the OH− group. According to this observation and the difference electron map analysis in Fig. 1, the chemical formula should be rewritten as Sr4Ca(PO4)(2+x)(SiO4)(1−x)(OH)x in order to keep the sum of charges to be zero. On the basis of such a model, Fig. 2 gives the Rietveld analysis patterns for X-ray powder diffraction data of the nominal Sr4Ca(PO4)2(SiO4) compound, and the value of x was determined; the final refinement was stable and gave low R-factors (Table 1 and Fig. 2), and the RB factor dropped to 1.93%. The inset in Fig. 2 shows the representative crystal structure of Sr4Ca(PO4)(2+x)(SiO4)(1−x)(OH)x, which crystallized in the hexagonal cell (space group P63/m) with lattice constants a = b = 9.67202 (8), c = 7.25393 (7), V = 587.68 (1), Z = 2, as shown in Table 1, and the crystallographic information file (CIF) is presented in the ESI.†
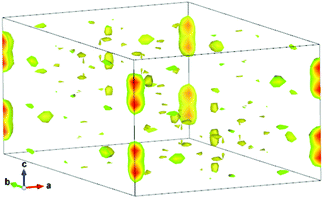 |
| | Fig. 1 Difference electron map calculated using the Fobs − Fcalc difference of structural amplitudes for the as-prepared nominal Sr4Ca(PO4)2SiO4 phase with the real composition of Sr4Ca(PO4)(2+x)(SiO4)(1−x)(OH)x. Maxima at (0, 0, x) (x ∼ 0.2) correspond to missed O ions. | |
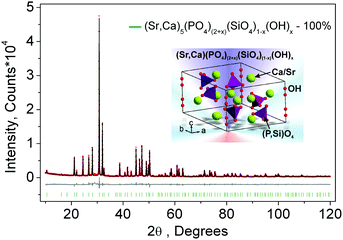 |
| | Fig. 2 Rietveld analysis patterns for X-ray powder diffraction data of the nominal Sr4Ca(PO4)2(SiO4) compound. The solid black lines are calculated intensities, and the red dots are the observed intensities. The gray solid lines below the profiles stand for the difference between the observed and calculated intensities. The short green vertical lines show the position of the Bragg reflections of the calculated pattern. The final chemical formula was refined as Sr4Ca(PO4)(2+x)(SiO4)(1−x)(OH)x, x = 0.64(3) for the as-prepared nominal Sr4Ca(PO4)2SiO4 phase. The inset shows the representative crystal structure of Sr4Ca(PO4)(2+x)(SiO4)(1−x)(OH)x. | |
Table 1 Main parameters of processing and refinement of the Sr4Ca(PO4)(2+x)(SiO4)(1−x)(OH)x phase
| Phase |
Sr4Ca(PO4)(2+x)(SiO4)(1−x)(OH)x (x = 0.64(3)) |
| Weight, % |
100 |
| Sp.Gr. |
P63/m |
|
a, Å |
9.67202 (8) |
|
b, Å |
9.67202 (8) |
|
c, Å |
7.25393 (7) |
|
V, Å3 |
587.68 (1) |
|
Z
|
2 |
|
2θ-interval, ° |
10–120 |
|
R
wp, % |
8.46 |
|
R
p, % |
5.97 |
|
R
exp, % |
3.86 |
|
χ
2
|
2.19 |
|
R
B, % |
1.93 |
We have also checked the phase purity of the as-prepared Ce3+/Eu2+ codoped Sr4Ca(PO4)2SiO4 phosphors. Fig. 3 shows the representative XRD patterns of Sr3.8−xCa(PO4)2SiO4:0.1Ce3+,0.1Na+,xEu2+ (x = 0, 0.03) samples. Firstly, the diffraction peaks agree well with the phase of Sr4Ca(PO4)(2+x)(SiO4)(1−x)(OH)x, x = 0.64(3) refined by the Rietveld analysis, as shown in Fig. 2. Secondly, it is obvious that all the diffraction peaks of these samples can also be indexed to the pure hexagonal phase of Sr5(PO4)2SiO4 (JCPDS 21-1187). No other phase is detected after doping, indicating that Ce3+ or Eu2+ ions were completely dissolved in the nominal Sr4Ca(PO4)2SiO4 host without leading to any significant changes in the crystal structure. However, as discussed above, Sr4Ca(PO4)(2+x)(SiO4)(1−x)(OH)x and title phase Sr4Ca(PO4)2SiO4 are isostructural. Only one difference – the presence or absence of OH groups in the void of the structure can be found. The X-ray diffraction method is an effective approach to check the presence of OH groups using difference electron density maps mentioned above. It is clear that the addition of some amount of OH− ions to the structure enables charge imbalance. In order to make the charge of unit cell equal to zero the following mechanism was suggested: OH− + PO43− = SiO44−. Therefore the chemical formula of such compounds should be Sr4Ca(PO4)(2+x)(SiO4)(1−x)(OH)x. Therefore, we still used the chemical formula of the nominal Sr4Ca(PO4)2SiO4 phase in the following section in order to discuss the photoluminescence properties of Ce3+/Eu2+ codoped samples.
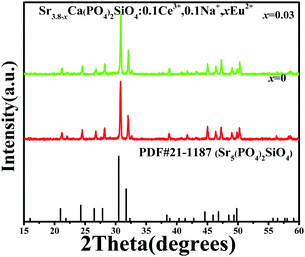 |
| | Fig. 3 XRD patterns of as-prepared Sr3.8−xCa(PO4)2SiO4:0.1Ce3+,0.1Na+,xEu2+ (x = 0, 0.03) samples. The standard data for Sr5(PO4)2SiO4(PDF#21-1187) are shown as the reference. | |
3.2 Luminescence properties of Ce3+/Na+ singly doped Sr4Ca(PO4)2SiO4 phosphors
In order to investigate the luminescence properties of Ce3+ activated Sr4Ca(PO4)2SiO4 phosphors, we firstly prepared a series of samples Sr3.8−2xCa(PO4)2SiO4:xCe3+,xNa+ (x = 0.01, 0.03, 0.05, 0.07, 0.10 and 0.15). Fig. 4a depicts the PLE and PL spectra of the selected Sr3.8Ca(PO4)2SiO4:0.1Ce3+,0.1Na+ phosphor. The PLE spectrum monitored at 428 nm exhibits a broad band from 250 to 400 nm, which is ascribed to the transitions from the ground state of the Ce3+ ions to the field splitting levels of the 5d state.22 The PL spectrum consists of an asymmetric broad band peaking at 428 nm under the excitation of 365 nm. As we know, such an asymmetric broad band should be ascribed to the characteristics of double band emission of Ce3+, which is due to the transition of Ce3+ ions from the 5d excited state to the 2F7/2 and 2F5/2 ground states. Fig. 4b shows the PL spectra of Sr3.8−2xCa(PO4)2SiO4:xCe3+,xNa+ depending on different Ce3+ doping content x. All the PL spectra exhibited a similar broad band emission centered at 428 nm, which was also ascribed to the 5d1–4f1 of Ce3+ ions. The optimal Ce3+ dopant content was found to be 0.1 mol per formula unit and the PL intensity was observed to increase with increasing x when x < 0.1. That is to say, with the Ce3+ dopant content being higher than 0.1, concentration quenching was observed and the PL intensity was found to decrease with increasing Ce3+.
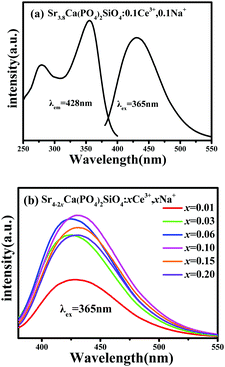 |
| | Fig. 4 (a) PLE and PL spectra of Sr3.8Ca(PO4)2SiO4:0.1Ce3+,0.1Na+, (b) PL spectra of Sr3.8−2xCa(PO4)2SiO4:xCe3+,xNa+ (x = 0.01, 0.03, 0.06, 0.10, 0.15 and 0.20). | |
Accordingly, the inset of Fig. 5 presents the PL emission intensities as a function of Ce3+ content for Sr3.8−2xCa(PO4)2SiO4:xCe3+,xNa+, and it is obvious that the optimal doping concentration is x = 0.1 and then decreased, resulting from the concentration quenching effect. It is known that the interaction type between sensitizers or between the sensitizer and the activator can be calculated using the following eqn (1) and it can be used to predict the mechanism of energy transfer and enable concentration quenching. Therefore, we can get the detailed information of multipolar interaction from the variation of the emission intensity depending on the concentration of the activators according to the report of Van Uitert. The emission intensity (I) per activator concentration (x) follows the following equation:23
| |  | (1) |
where
I is the emission intensity,
x is the concentration of the activator ions above the concentration quenching point,
β and
K are constants under the same conditions, and
θ is the function of multipole–multipole interaction. When the value of
θ is 6, 8 or 10, the form of the interaction corresponds to dipole–dipole (d–d), dipole–quadrupole (d–q), or quadrupole–quadrupole (q–q), respectively. To obtain a correct
θ, the dependence of lg(
I/
x) on lg(
x) is plotted, and it yields a straight line with a slope of −
θ/3. The fitting result for Ce
3+ emission centers, which is corresponding to the Sr
3.8−2xCa(PO
4)
2SiO
4:
xCe
3+,
xNa
+ phosphor compositions beyond the quenching concentration of Ce
3+, is shown in
Fig. 5. The slope is determined to be −1.80, through which the value of
y can be calculated as 5.4. Therefore, the values are approximately equal to 6, which means that the quenching process is ascribed to the dipole–dipole interaction in the present system.
24,25
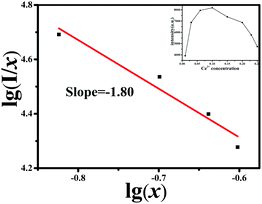 |
| | Fig. 5 The relationships of lg(x) versus lg(I/x). The inset shows the PL intensity of the plot of Sr3.8−2xCa(PO4)2SiO4:xCe3+,xNa+ as a function of Ce3+ content. | |
3.3 Luminescence properties and energy transfer of Sr4Ca(PO4)2SiO4:Ce3+,Na+,Eu2+ phosphors
As discussed above, the Sr4Ca(PO4)2SiO4 phase belongs to a kind of versatile host for the activators. Therefore, Fig. 4 comparatively demonstrated the emission and excitation spectra of Ce3+/Na+ and Eu2+ singly doped and Ce3+/Na+/Eu2+-co-doped Sr4Ca(PO4)2SiO4 phosphors. Fig. 6a displays the PL and PLE spectra of the Sr3.8Ca(PO4)2SiO4:0.1Ce3+,0.1Na+ phosphor. The broad-band emission and excitation spectral characteristics have been discussed above. Fig. 6b demonstrates the PL and PLE spectra of Sr3.99Ca(PO4)2SiO4:0.01Eu2+. The PLE spectrum monitored at 493 nm exhibits a broad band from 260 to 450 nm, and the PL spectrum consists of a broad band centered at 493 nm under the excitation of 365 nm, which is ascribed to the electric dipole allowed the transition of the Eu2+ ions.26 A notable spectral overlap between the PLE spectrum of Sr3.99Ca(PO4)2SiO4:0.01Eu2+ and the PL spectrum of Sr3.8Ca(PO4)2SiO4:0.1Ce3+,0.1Na+ is observed. So that the energy transfer from Ce3+ to Eu2+ ions can be achieved in the Sr4Ca(PO4)2SiO4 system. To further confirm the possible energy transfer process, Fig. 6c illustrates the PLE and PL spectra of Sr3.79Ca(PO4)2SiO4:0.1Ce3+,0.1Na+,0.01Eu2+ phosphors. Under the irradiation of 365 nm, the co-doped phosphor shows a broad bluish-green emission band containing the superimposed emission peaks that originated from the Eu2+ ions and Ce3+ ions. When monitoring at 493 nm and 429 nm, the two sets of PLE spectra give similar spectral profiles, which agree well with the PLE spectrum of the singly Ce3+ doped sample, as shown in Fig. 6a. The above comparative analysis on the PL and PLE spectra of the Ce3+/Na+ and Eu2+ singly doped and Ce3+/Na+/Eu2+-co-doped Sr4Ca(PO4)2SiO4 phosphors proves the occurrence of the energy transfer from the Ce3+ to Eu2+ ions.27 Therefore, the photoluminescence tuning originating from the energy transfer process can be expected.
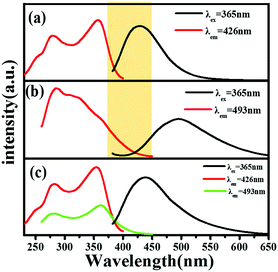 |
| | Fig. 6 PLE (left) and PL (right) spectra of (a) Sr3.8Ca(PO4)2SiO4:0.1Ce3+,0.1Na+, (b) Sr3.99Ca(PO4)2SiO4:0.01Eu2+, (c) Sr3.79Ca(PO4)2SiO4:0.1Ce3+,0.1Na+,0.01Eu2+. | |
In order to further investigate the energy transfer process between the Ce3+ and Eu2+ ions in the Sr4Ca(PO4)2SiO4 host, we have studied the luminescence properties of a series of samples with designed compositions. Fig. 7 displays the PL spectra of Sr3.8−xCa(PO4)2SiO4:0.1Ce3+,0.1Na+,xEu2+ samples under 365 nm excitation with a fixed Ce3+ content of 0.1 and a varying Eu2+ content x in the range of 0–0.06. As shown in Fig. 7, the emission peak is red-shifted from 429 nm to 493 nm with increasing concentration of Eu2+. The results verified that the superimposed emission peaks originated from the Eu2+ ions and Ce3+ ions, and the observed photoluminescence tuning should be ascribed to the energy transfer from the Ce3+ to Eu2+ ions.
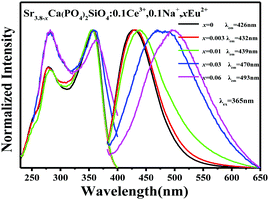 |
| | Fig. 7 PL and PLE spectra of Sr3.8−xCa(PO4)2SiO4:0.1Ce3+,0.1Na+,xEu2+ (x = 0, 0.003, 0.01, 0.03, 0.06) phosphors. | |
Normally, the energy transfer from the sensitizer to the activator may be via a multipolar interaction or an exchange interaction that occurs at a higher concentration. On the basis of the Dexter's energy transfer expressions of multipolar interaction, the following relation can be obtained:28,29
| |  | (2) |
where
Is0 and
Is are the luminescence intensities of the sensitizer Ce
3+ with and without the activator Eu
2+;
C is the concentration of the sum of Ce
3+ and Eu
2+; and
n = 6, 8 and 10 corresponding to dipole–dipole, dipole–quadrupole, and quadrupole–quadrupole interactions, respectively. The
IS0/
IS ∝
Cn/3 plots are further illustrated in
Fig. 8. when
n = 6 we can observe a linear behavior with the optimum fitting factor of
R2 = 0.9987, indicating that energy transfer from Ce
3+ to Eu
2+ took place
via the dipole–dipole mechanism.
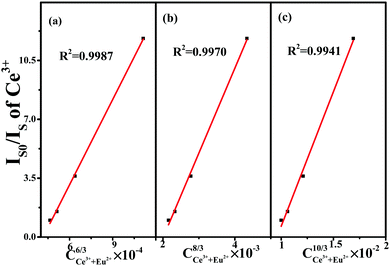 |
| | Fig. 8 Dependence of IS0/IS of Ce3+ on (a) C6/3, (b) C8/3, and (c) C10/3. | |
In order to validate the energy transfer from Ce3+ to Eu2+, we investigated the lifetime values of Ce3+ emission, which are calculated by analyzing decay curves of Sr3.8−xCa(PO4)2SiO4:0.1Ce3+,0.1Na+,xEu2+ phosphors. Fig. 9 shows the fluorescence decay curves of Ce3+ emission under excitation at 354 nm and by monitoring the emission peak at 426 nm. It is found that all the decay curves can be fitted well with a second-order exponential decay, which can be obtained using the equation:30
| | I(t) = I0 + A1![[thin space (1/6-em)]](https://www.rsc.org/images/entities/char_2009.gif) exp(−t/τ1) + A2 exp(−t/τ1) + A2![[thin space (1/6-em)]](https://www.rsc.org/images/entities/char_2009.gif) exp(−t/τ2) exp(−t/τ2) | (3) |
where
I(
t) is the luminescence intensity,
t is the time,
A1 and
A2 are constants, and
τ1 and
τ2 are rapid and slow decay times for the exponential components, respectively. According to the parameters in
eqn (3), the average lifetime
τ* can be obtained using the formula:
| | | τ* = (A1τ12 + A2τ22)/(A1τ1 + A2τ2) | (4) |
Therefore, the decay lifetime values at 426 nm are determined to be 37.13, 32.28, 24.42, 14.42, and 9.14 ns, respectively. Obviously, the decay lifetime values decreased monotonically as the Eu
2+ concentration increases, which also strongly demonstrated the energy transfer from Ce
3+ to Eu
2+.
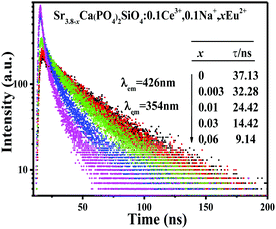 |
| | Fig. 9 Decay curves of Ce3+ emission in Sr3.8−xCa(PO4)2SiO4:0.1Ce3+,0.1Na+,xEu2+ phosphors under excitation at 365 nm, monitored at 426 nm. | |
As shown in Fig. 10, the energy transfer efficiency (ηT) between the Ce3+ and Eu2+ ions can also be obtained from the decay lifetime values by using the following eqn (5):31
| |  | (5) |
where
τx and
τ0 represent the lifetime values of sensitizer Ce
3+ ions with and without the activator Eu
2+, respectively. With increasing Eu
2+ concentration the energy transfer efficiencies increase gradually and
ηT values are calculated to be 13.06%, 34.23%, 61.16% and 75.38% for the Sr
3.8−xCa(PO
4)
2SiO
4:0.1Ce
3+,0.1Na
+,
xEu
2+ phosphors with different Eu
2+ concentrations of
x = 0.003, 0.01, 0.03 and 0.06.
 |
| | Fig. 10 Dependence of the fluorescence lifetime of the Ce3+ and energy transfer efficiency on the doped Eu2+ molar concentration in Sr3.8−xCa(PO4)2SiO4:0.1Ce3+,0.1Na+,xEu2+ samples. | |
3.4 Thermal quenching and photoluminescence tuning of Sr4Ca(PO4)2SiO4:Ce3+,Na+,Eu2+ phosphors
Fig. 11a typically presents the temperature dependent emission spectra of Sr3.79Ca(PO4)2SiO4:0.1Ce3+,0.1Na+,0.01Eu2+ phosphors upon 365 nm excitation in the range of 25–300 °C, and it is found that emission intensities decrease and the emission peaks shift to the blue region with increasing temperature. By normalizing the initial luminescence intensity to 1.0, the relative emission intensities of the Ce3+/Na+ or Eu2+ singly doped and Ce3+/Na+/Eu2+-co-doped Sr4Ca(PO4)2SiO4 phosphors as a function of temperature are displayed in Fig. 11b, which shows that the relative PL intensity slowly decreases with increasing temperature. When the temperature was increased to 150 °C, the PL intensity of the sample drops to 71.3%, 70.1% and 66.0% of the initial value at room temperature for the corresponding compositions of Sr3.79Ca(PO4)2SiO4:0.1Ce3+,0.1Na+,0.01Eu2+,Sr3.99Ca(PO4)2SiO4:0.01Eu2+ and Sr3.8Ca(PO4)2SiO4:0.1Ce3+,0.1Na+ phosphors. The better thermal quenching luminescence behavior will be useful for the high temperature and high power application when this kind of phosphor is used as the blue-green components in UV-pumped WLEDs.
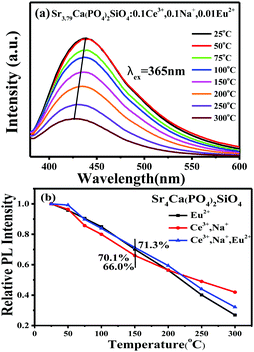 |
| | Fig. 11 (a) PL spectra (λex = 365 nm) of the selected Sr3.79Ca(PO4)2SiO4:0.1Ce3+,0.1Na+,0.01Eu2+ phosphor at different temperatures in the range of 25–300 °C. (b) The relative emission intensities as a function of temperature for typical Ce3+/Na+,Eu2+ singly doped and Ce3+/Na+,Eu2+-co-doped Sr4Ca(PO4)2SiO4 phosphors. | |
Fig. 12 shows the chromaticity coordinates of the as-reported Sr3.8−xCa(PO4)2SiO4:0.1Ce3+,0.1Na+,xEu2+ phosphors on the Commission Internationale de l'Eclairage (CIE) chromaticity diagram. The CIE chromaticity coordinates for different samples in Sr3.8−xCa(PO4)2SiO4:0.1Ce3+,0.1Na+,xEu2+ phosphors were measured based on the corresponding PL spectra upon 365 nm excitation. As shown in Fig. 12, we can clearly see that the emission colors of the phosphors can be easily modulated from blue to green by simply changing the value of x from 0 to 0.06. Accordingly, the corresponding CIE coordinates change from (0.156, 0.0717) to (0.233, 0.346), due to the variation of the emission composition of the Ce3+ and Eu2+ ions. The inset in Fig. 12 illustrates the digital photos of this series of phosphors under 365 nm UV lamp excitation. These results indicate that the as-reported and composition-optimized phosphor might act as a potential candidate for blue-green components in UV-pumped WLEDs.
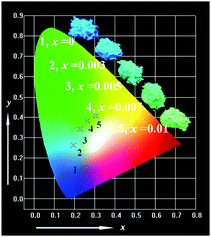 |
| | Fig. 12 CIE chromaticity diagram and a series of digital photographs of the selected Sr3.8−xCa(PO4)2SiO4:0.1Ce3+,0.1Na+,xEu2+ (x = 0, 0.003, 0.01, 0.03 and 0.06) phosphors (λex = 365 nm). | |
4. Conclusion
A new apatite-type phase that originated from the substitution of a Sr cation by a Ca cation in the Sr5(PO4)2(SiO4) has been prepared with the nominal chemical composition of Sr4Ca(PO4)2(SiO4). The crystal structure of Sr4Ca(PO4)2(SiO4) has been analysed by the difference electron map, and further resolved by the Rietveld refinement, and the final composition has been determined as Sr4Ca(PO4)(2+x)(SiO4)(1−x)(OH)x (x = 0.64), which crystallized in the hexagonal cell (space group P63/m) with lattice constants a = b = 9.67202 (8), c = 7.25393 (7), V = 587.68 (1), Z = 2. The photoluminescence properties of Ce3+/Na+ or Eu2+ singly doped and Ce3+/Na+/Eu2+-co-doped Sr4Ca(PO4)2SiO4 phosphors have been investigated in detail. When Ce3+ and Eu2+ were codoped in Sr4Ca(PO4)2SiO4, the photoluminescence spectra displayed tunable blue-green emission by varying their relative concentrations. The effective energy transfer from the Ce3+ to Eu2+ has been discussed and verified based on the measured spectra and the decay curves, and the dipole–dipole interaction mechanism should be mainly responsible for the energy transfer process. The as-developed Sr4Ca(PO4)2SiO4:Ce3+,Na+,Eu2+ phosphor might act as a potential candidate for blue-green components in UV-pumped WLEDs.
Acknowledgements
The present work was supported by the National Natural Science Foundations of China (Grant No. 51572023, No. 51272242), Fundamental Research Funds for the Central Universities (FRF-TP-15-003A2) and the Russian Foundation for Basic Research (Grant No. 15-52-53080 GFEN_a).
Notes and references
- D. Mazza, M. Tribaudino, A. Delmastro and B. Lebech, J. Solid State Chem., 2000, 155, 389–393 CrossRef CAS.
- T. Baikie, G. M. H. Ng, S. Madhavi, S. S. Pramana, K. Blake, M. Elcombe and T. J. White, Dalton Trans., 2009, 6722–6726 RSC.
- Y. Tian, Y. Wei, Y. Zhao, Z. Quan, G. Li and J. Lin, J. Mater. Chem. C, 2016, 4, 1281–1294 RSC.
- M. Schumacher and M. Gelinsky, J. Mater. Chem. B, 2015, 3, 4626–4640 RSC.
- P. K. Pandis, E. Xenogiannopoulou, P. M. Sakkas, G. Sourkouni, C. Argirusis and V. N. Stathopoulos, RSC Adv., 2016, 6, 49429–49435 RSC.
- M. Jiao, Y. Jia, W. Lu, W. Lv, Q. Zhao, B. Shao and H. You, J. Mater. Chem. C, 2014, 2, 90–97 RSC.
- Z. Xia, C. Ma, M. S. Molokeev, Q. Liu, K. Rickert and K. R. Poeppelmeier, J. Am. Chem. Soc., 2015, 137, 12494–12497 CrossRef CAS PubMed.
- Z. Xia, S. Miao, M. S. Molokeev, M. Chen and Q. Liu, J. Mater. Chem. C, 2016, 4, 1336–1344 RSC.
- T. Wang, Q. Xiang, Z. Xia, J. Chen and Q. Liu, Inorg. Chem., 2016, 55, 2929–2933 CrossRef CAS PubMed.
- B. Dickens and W. E. Brown, Tschermaks Mineral. Petrogr. Mitt., 1971, 16, 1–27 CrossRef CAS.
- M. Y. Chen, Z. G. Xia, M. S. Molokeev and Q. L. Liu, Inorg. Chem., 2015, 54, 11369–11376 CrossRef CAS PubMed.
- H. P. Ji, Z. H. Huang, Z. G. Xia, M. S. Molokeev, V. V. Atuchin, M. H. Fang and S. F. Huang, Inorg. Chem., 2014, 53, 5129–5135 CrossRef CAS PubMed.
- S. Miao, Z. Xia, M. S. Molokeev, M. Chen, J. Zhang and Q. Liu, J. Mater. Chem. C, 2015, 3, 4616–4622 RSC.
- M. Shang, C. Li and J. Lin, Chem. Soc. Rev., 2014, 43, 1372–1386 RSC.
- G. Blasse and A. Bril, Phys. Lett. A, 1969, 28, 572–573 CrossRef CAS.
- J. Gan, Y. Huang, L. Shi, X. Qiao and H. J. Seo, Mater. Lett., 2009, 63, 2160–2162 CrossRef CAS.
- H.-S. Roh, S. Hur, H. J. Song, I. J. Park, D. K. Yim, D.-W. Kim and K. S. Hong, Mater. Lett., 2012, 70, 37–39 CrossRef CAS.
- Y. Huang, J. Gan, R. Zhu, X. Wang and H. J. Seo, J. Electrochem. Soc., 2011, 158, J334–J340 CrossRef CAS.
- S. Xin, Y. Wang, G. Zhu, F. Zhang, Y. Gong, Y. Wen and B. Liu, Mater. Res. Bull., 2013, 48, 1627–1631 CrossRef CAS.
- D. Geng, M. Shang, Y. Zhang, H. Lian, Z. Cheng and J. Lin, J. Mater. Chem. C, 2013, 1, 2345–2353 RSC.
- K. Sudarsanan and R. A. Young, Acta Crystallogr., Sect. B:
Struct. Crystallogr. Cryst. Chem., 1972, 28, 3668–3670 CrossRef CAS.
- Z. Xia, M. S. Molokeev, W. B. Im, S. Unithrattil and Q. Liu, J. Phys. Chem. C, 2015, 119, 9488–9495 CAS.
- L. G. Van Uitert, J. Electrochem. Soc., 1967, 114, 1048–1053 CrossRef CAS.
- H. Y. Xiao, Z. G. Xia, L. B. Liao, J. Zhou and J. Q. Zhuang, J. Alloys Compd., 2012, 534, 97–100 CrossRef CAS.
- Z. G. Xia, Y. Y. Zhang, M. S. Molokeev and V. V. Atuchin, J. Phys. Chem. C, 2013, 117, 20847–20854 CAS.
- X. Chen, Z. G. Xia and Q. L. Liu, Dalton Trans., 2014, 43, 13370–13376 RSC.
- M. M. Shang, G. G. Li, D. L. Geng, D. M. Yang, X. J. Kang, Y. Zhang, H. Z. Lian and J. Lin, J. Phys. Chem. C, 2012, 116, 10222–10231 CAS.
- D. L. Dexter, J. Chem. Phys., 1953, 21, 836–850 CrossRef CAS.
- D. L. Dexter and J. H. Schulman, J. Chem. Phys., 1954, 22, 1063–1070 CrossRef CAS.
- M. Chen, Z. Xia, M. S. Molokeev and Q. Liu, J. Mater. Chem. C, 2015, 3, 12477–12483 RSC.
- S. Miao, Z. Xia, M. S. Molokeev, J. Zhang and Q. Liu, J. Mater. Chem. C, 2015, 3, 8322–8328 RSC.
Footnote |
| † Electronic supplementary information (ESI) available. See DOI: 10.1039/c6tc03373c |
|
| This journal is © The Royal Society of Chemistry 2016 |
Click here to see how this site uses Cookies. View our privacy policy here.  Open Access Article


![[thin space (1/6-em)]](https://www.rsc.org/images/entities/char_2009.gif) exp(−t/τ1) + A2
exp(−t/τ1) + A2![[thin space (1/6-em)]](https://www.rsc.org/images/entities/char_2009.gif) exp(−t/τ2)
exp(−t/τ2)


