 Open Access Article
Creative Commons Attribution 3.0 Unported Licence
Periodic micro-patterned VO2 thermochromic films by mesh printing†
Qi
Lu
a,
Chang
Liu
 a,
Ning
Wang
a,
Shlomo
Magdassi
*b,
Daniel
Mandler
*b and
Yi
Long
*a
a,
Ning
Wang
a,
Shlomo
Magdassi
*b,
Daniel
Mandler
*b and
Yi
Long
*a
aSchool of Materials Science and Engineering, Nanyang Technological University, 50 Nanyang Avenue, Singapore 639798. E-mail: longyi@ntu.edu.sg; Fax: +65 67911604; Tel: +65 67904599
bInstitute of Chemistry, The Hebrew University, Edmond Safra Campus, Jerusalem 91904, Israel. E-mail: magdassi@mail.huji.ac.il; daniel.mandler@mail.huji.ac.il
First published on 19th July 2016
Abstract
VO2 has garnered much attention in recent years as a promising candidate for thermochromic window applications due to rising awareness about energy conservation. However, the trade-off between improving the luminous transmittance (Tlum) and solar modulation ability (ΔTsol) limits the commercialization of VO2-based smart windows. Four major nanostructuring approaches were implemented to enhance both Tlum and ΔTsol, namely nanocomposites, nanoporous films, biomimetic moth-eye structures and anti-reflection coating (ARC) multilayers. This work demonstrates a novel approach that fabricates periodic, micro-patterned structures of VO2 using a facile screen printing method. The micro-patterned structure is able to favorably transmit visible light without sacrificing high near-infrared modulation, and the patterned film shows improved Tlum (67% vs. 60%) and ΔTsol (8.8% vs. 6.9%) compared with continuous films. By varying the thickness, periodicity and solid concentration, this approach can give a ΔTsol of 14.9% combined with a Tlum of 43.3%, which is comparable, if not superior to, some of the best reported results found using other approaches.
Introduction
20 to 40 percent of energy consumption in developed countries can be attributed to buildings, and 10 to 20 percent of the primary energy usage of buildings account for heating or cooling purposes.1,2 This provides a strong impetus for novel energy-saving solutions, and in particular, building-facade solutions have become increasingly popular. Thermochromic films are the most cost-effective chromogenic material as they exhibit an automatic change in solar transmission with changes in temperature.3 Vanadium dioxide (VO2) is one of the leading thermochromic materials.4–6 Below the critical temperature of τc = 68 °C, VO2 is in the monoclinic phase and is transparent to infrared light. As it transforms into a metallic tetragonal structure at T > τc, it becomes highly absorbent of IR radiation.7–9 Ideally, thermochromic coatings should have both high luminous transmittance (Tlum) and solar modulation ability (ΔTsol), but VO2's inherently high luminous absorption in both states renders it challenging to simultaneously increase Tlum and ΔTsol. Most conventional VO2 single layer films are able to achieve a Tlum around 50% with a ΔTsol of 5%.10 Many endeavors to improve the performance of VO2 based films have been attempted,11 employing doping,10,12–18 anti-reflection coating,19 nanoporous structuring,20,21 nanoparticle-based composites,22–26 biomimetic nanostructuring,27,28 organic materials,29 and hybridization30 as means to enhance both Tlum and ΔTsol.Liu Chang et al.31 proposed the first finite difference time domain (FDTD) simulation work on nano-gridded, VO2-based perforated films. The nano-sized opening would improve the transmission of short-wavelength visible light, while the abundant volume of VO2 retained in the pattern maintains the film's good long-wavelength near-infrared (NIR) modulation abilities. The best-performing theoretical combination of 79% Tlum and 14% ΔTsol surpasses other theoretical work such as biomimetic nanostructuring,28 nanothermochromism,32 and nanoporous structuring.33
We report, for the first time, a micro-gridded structure inspired by Liu's design. It was fabricated using screen printing meshes with controlled film thickness, concentration and periodicity. Such structures could improve both Tlum and ΔTsol simultaneously, thus opening a new research direction in thermochromic VO2 studies.
Materials and equipment
VO2 nanoparticles (Jingcheng Chemicals, China), dipropylene glycol methyl ether (DPM, 4.5 wt%), Disperbyk 180, and silica aluminum gel were used without further purification. Deionized water (18.2 MΩ) was used throughout the experiments.A VO2/Si–Al gel mixture was prepared as reported,4 which serves to provide structural support to the VO2 grid films upon drying. 5 wt% mg of the filtered colloid was diluted to 0.5 wt%, 0.25 wt%, 0.167 wt% and 0.125 wt% with Si–Al gel. The solution was then vortexed and sonicated for 15 minutes for better dispersion and homogeneity.34
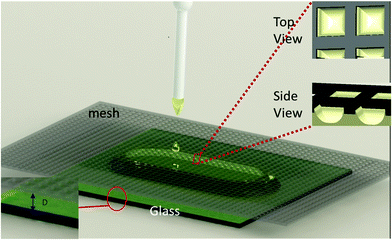
A soda glass substrate was sonicated with deionized water, followed by 95% ethanol solution, and finally with deionized water again for cleaning. The glass slide was dried in a furnace set at 100 °C. As illustrated in Fig. 1, the glass substrate was placed at the center of a hot plate. The screen printing mesh (Ponger 2000, Israel) was mounted directly above the glass substrate, and the vertical distance, D, between the bottom of the mesh and the top surface of the glass substrate, was carefully controlled. Using a 100 μL pipette, the VO2/Si–Al gel mixture was applied onto the glass substrate through the meshes. When the nanoparticle (NP) dispersion was placed on top of the mesh (Fig. 1), upon contact, the liquid immediately wetted the mesh walls and filled up the space between the mesh and the glass substrate, resulting in the alignment of the NPs along the threads of the mesh (Fig. 1 inset side view). The substrate was heated at 50 °C for 12 hours to evaporate water from the matrix. Upon removal of the mesh, a periodic, waffle textured VO2 film was formed (Fig. 1 inset top view).
Characterization
The morphology and the SAED (selected area electron diffraction) of the purchased VO2 nanoparticles were characterized using a transmission electron microscope (JEM-2010, JEOL, Japan) with an accelerating voltage of 200 kV.The transmittance spectrum from 250 to 2500 nm was analysed using a UV-Vis-NIR spectrometer (Cary 5000, Agilent, USA) at normal incidence. A heating stage (PE120, Linkam, UK) was employed to control the temperature of the samples mounted on the spectrophotometer.
The sample films' morphology was studied using a field emission scanning electron microscope (JEM-7600F, JEOL, Japan) with an accelerating voltage of 5 kV.
The following equation was employed in the calculation of the film's performance in terms of its luminous transmittance (380–780 nm), IR transmittance (780–2500 nm), and solar transmittance, Tsol (250–2500 nm):
 | (1) |
Results and discussion
Effects of thickness on optical properties
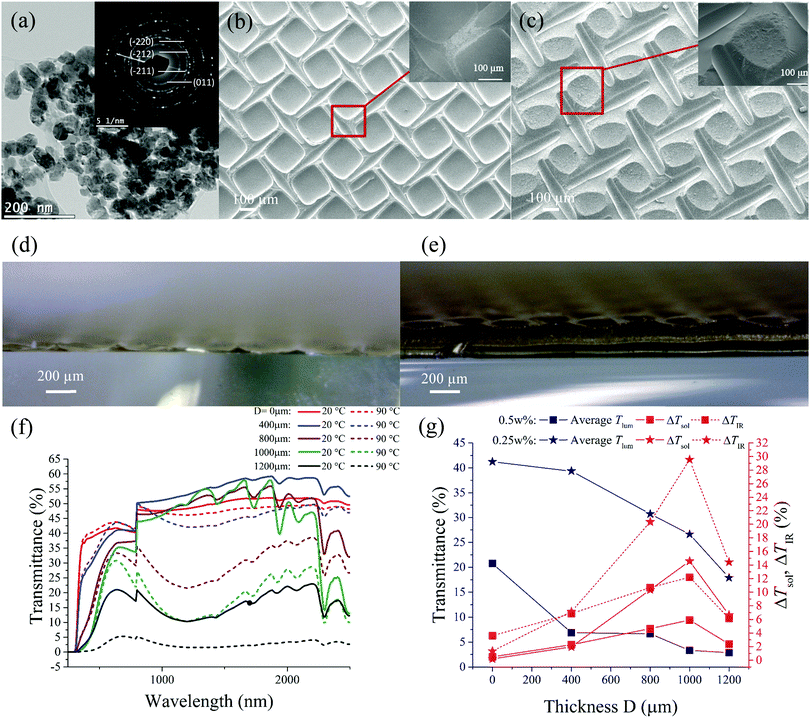
The particle size of the starting VO2 powders is less than 100 nm with an oval shape and a uniform size distribution, as shown in Fig. 2a. The selected area electron diffraction (SAED) pattern (inset Fig. 2a) suggests the high purity of the polycrystalline VO2 NPs. The thickness of the samples fabricated has been varied according to Fig. 1, using a mesh of size 325 μm. As shown in Fig. 2, grooved lines can be seen in places where mesh threads had come in contact with the film. Formation of the grooves under the threads can be attributed to surface tension, which attracts the solution towards the walls of the threads. The strong adhesion to the mesh threads draws the solution from the centre of each period, leading to the formation of a concave crater upon drying. SEM images illustrate the changes to the structure as the thickness D varies. When the thickness is low (D = 0 μm) (Fig. 2b), a grid-like structure is produced with the main VO2 content concentrated on both sides of the mesh threads. An increase in the thickness of film is observed to reduce the size of the crater and allows more solution to remain at the centre. The thickness of the film formed at the bottom of the crater also increases (Fig. 2c). In this case, the film is no longer a hollow grid; it forms a cone textured structure with periodically alternating crests and troughs. The cross-section view of the samples is shown in Fig. 2d and e. The increase in the thickness does not afford the formation of the patterned structure, albeit the film starts to adopt a waffle-like structure instead of a gridded structure when the thickness becomes greater.As illustrated in Fig. 2f, increasing thickness (D) results in a gradual decrease in the transmittance in samples prepared with 0.25 wt% VO2 dispersions at all wavelengths (250–2500 nm) at 90 °C. This is also observed in the visible range (380–780 nm) at 20 °C, thus accounting for decreasing averaged Tlum as shown in Fig. 2g. A similar trend was observed for 0.5 wt% samples. The reduction in Tlum is attributed to greater solar absorption due to the increased VO2 content. However, such thickness–transmission correlation was not observed in the IR range (780–2500 nm) at 20 °C, as the 400 μm size sample gives the highest IR transmission. This is reflected by the trend in the IR contrast (ΔTIR), which increases with thickness up to 1000 μm. Enhanced ΔTIR is correlated with higher ΔTsol for both concentrations because large portions of ΔTsol come from the IR contrast. ΔTsol starts to decrease when the thickness increases to 1200 μm, and such thickness/performance correlation was predicted by Liu Chang et al.,31 who suggested that a grid-design will enhance ΔTsol up to a certain thickness before it becomes a static absorber with much reduced contrast. It is worth noting that the satellite peaks in the 1000 to 2500 nm range (Fig. 2f) are due to the pure Si–Al gel matrix as shown in Fig. S1 (ESI†).
VO2 concentration effect
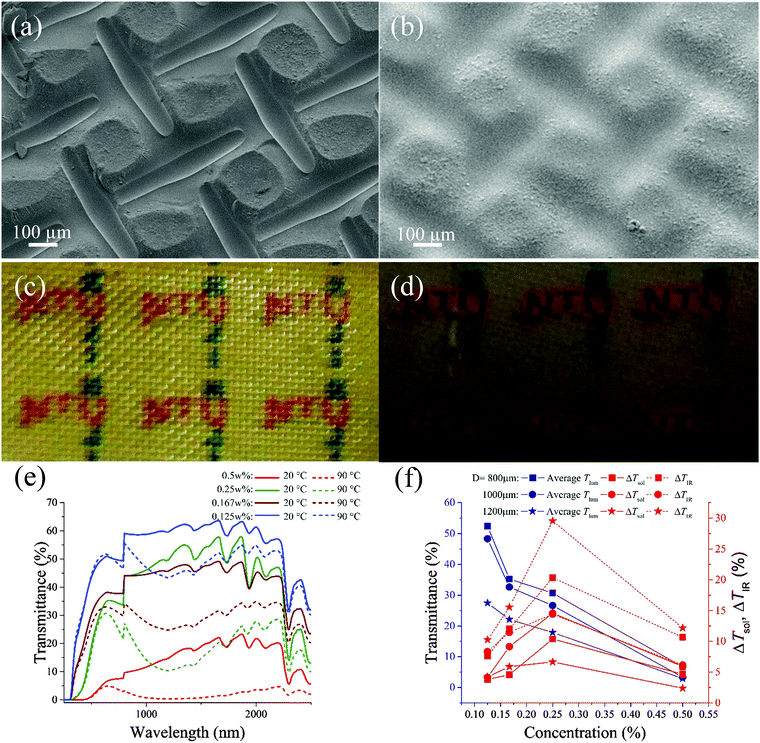
By fixing the distance D to 1000 μm, the performance of different VO2 content ranging from 0.125 to 0.5 wt% was investigated. The varying VO2 content results in different solution properties, thereby changing the surface morphology of the patterned films. By changing the concentration from 0.25 wt% to the 0.5 wt%, as shown in Fig. 3a and b, we observe increasing aggregation of VO2 towards the center, and the groove formed under the thread of the mesh starts to become more uniform and well defined. Fig. 3c and d illustrate the real samples prepared using the aforementioned concentrations. The 0.5 wt% sample appears darker than the 0.25 wt% sample, indicating the higher solid concentration.As illustrated in Fig. 3e, the concentration has an inverse correlation with transmittance. Samples prepared with D = 1000 μm experience a drop in transmittance in the visible spectrum (380–780 nm) at both 20 °C and 90 °C as the concentration increases. This corroborates with the observation that the average Tlum depreciates with rising concentration. The same trend is not observed in the IR spectrum (780–2500 nm) at 20 °C, with the 0.25 wt% sample having a higher transmittance. This accounts for the highest ΔTIR displayed by the 0.25 wt% sample, as ΔTIR is the difference in transmittance in the IR range at the two temperatures. As ΔTIR accounts for a large portion of solar contrast, higher ΔTIR leads to higher ΔTsol, as observed in Fig. 3f for both distances D. The increasing trend in both ΔTsol and ΔTIR does not continue indefinitely. They both peak at 0.25 wt% concentration and decrease when the concentration is higher.31 This could be accounted for by excessive absorption in both states, which suggests that an optimal design requires one to avoid excessively concentrated dispersions.
Effect of mesh periodicity
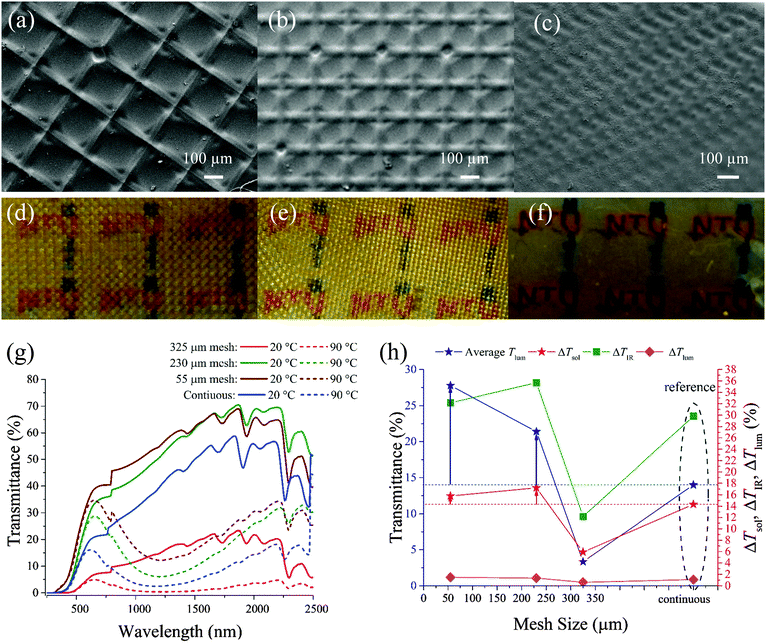
The SEM image (Fig. 4a–c) shows that a smaller mesh opening size results in a smaller center crater size. Meanwhile, the groove under each mesh thread becomes more pronounced compared with a larger mesh opening. Fig. 4d–f illustrate the real samples prepared. The reduction in the mesh size results in less pronounced gridded structures on the surface of the films formed.As shown in Fig. 4g, samples prepared with D = 1000 μm and a concentration of 0.5 wt% have higher transmittance in the visible spectrum (380–780 nm) at both 20 and 90 °C when a smaller mesh periodicity is used, and this trend is consistent with the theoretical calculation.31 The 325 μm mesh sample produces inferior results even compared to continuous samples due to low transmittance in both the luminous and IR ranges in both states. Indeed, the highest average Tlum is produced using a mesh opening of 55 μm. In contrast to ΔTlum, ΔTIR is very sensitive to the change of mesh periodicity as shown in Fig. 4h, and the high ΔTIR results in a corresponding change in ΔTsol. Compared with the continuous sample, both the 230 and 55 μm mesh samples show much higher transmittance in the entire spectrum in both states with higher average Tlum and more importantly ΔTsol. It is interesting to note that the 230-mesh size sample can obtain Tlum of 21.4% with a ΔTsol as high as 17.2%. This exceeds the highest reported ΔTsol of 16.5% coupled with a poor Tlum of 10.5%, as predicted by theoretical calculation.31 This is due to the fact that the simulation is based on a perforated continuous VO2 film while nanocomposite VO2 is used in this project to form such a periodic gridded structure. A similar trend is also observed in the 0.25 wt% samples (Fig. S2, ESI†). Both the 230 and 55 μm mesh samples show much higher transmittance over the entire spectrum in both states with higher average Tlum compared with the continuous sample.
Optimization of performance
Previous discussions have established the importance of VO2 concentration, thickness, and mesh size (periodicity) for the optical properties of the film. Generally, a higher concentration has been shown to increase the solar modulation ability due to the increased VO2 content, albeit with the inevitable trade-off with luminous transmittance. Meanwhile, increasing the thickness further enhances ΔTsol, but only to a maximum thickness of D = 1000 μm, as further thickening would result in excessive absorption of incident rays and, therefore, degrade the performance. Finally, a smaller mesh size offers a significantly higher Tlum.Therefore, we set D to 1000 μm and prepared samples using 230 and 55 μm meshes since both were proven to offer better performance compared to continuous samples. The best results obtained were with 0.5 wt% and 0.25 wt% solutions. From the tabulated results (Table 1), the best combination of Tlum and ΔTsol is 43.3% and 14.9%, respectively. As shown in Fig. 5, this result is comparable to some of the best reported porous33 and antireflective multilayered structure results,35 and is significantly higher than that of biomimetic moth eyed VO2.28 Compared with the theoretical results of nano-gridded VO2,31 the current work can still improve its performance by further reducing its mesh periodicity.
| Mesh (μm) | Ave. Tlum | ΔTsol | T lum (20 °C) | T lum (90 °C) | ΔTlum (20 °C) | T IR (20 °C) | T IR (90 °C) | ΔTIR (90 °C) | T sol (20 °C) | T sol (90 °C) |
|---|---|---|---|---|---|---|---|---|---|---|
| 230 | 40.1 | 15.0 | 40.1 | 40.1 | 0.1 | 63.3 | 30.9 | 32.4 | 47.5 | 32.5 |
| 55 | 43.3 | 14.9 | 44.4 | 42.2 | 2.2 | 64.0 | 32.2 | 29.8 | 48.9 | 34.0 |
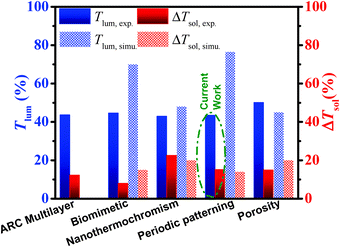 | ||
| Fig. 5 Current work compared with other best performing samples obtained from different approaches to enhance VO2 performance.30 | ||
Furthermore, two samples prepared with 0.5 wt% and 0.25 wt% dispersions were tested for their cycling stability. Samples were cycled between 20 °C and 90 °C using an oven for 40 cycles. The UV-Vis-NIR results (Fig. S3, ESI†) show stable performance in terms of Tlum and ΔTsol.
Conclusion
In this report, a simple mesh printing method is employed to produce micro-patterned VO2 films with different periodicities. Compared with continuous nanocomposite film samples, such a structure could enhance Tlum due to the opening of the grid, and enables the formation of thicker samples that better capitalize on the additional VO2 content for better ΔTsol. Compared with theoretical work based on a gridded thin film structure, this experimental work can achieve a ΔTsol as high as 17.2%, which exceeds the calculated ΔTsol of 16.5%, and an even higher Tlum (experimental 21.4% versus theoretical 10.5%). This is mainly due to the integration of a gridded structure and nanocomposite VO2. The best performing sample gives 43.3% Tlum and 14.9% ΔTsol, which are comparable to most approaches used to enhance thermochromic properties. The facile fabrication method and novel micro-patterned structures open a new and promising direction of VO2 thermochromic materials for smart window applications.Acknowledgements
This research was supported by the Singapore National Research Foundation under the CREATE programme: Nanomaterials for Energy and Water Management and Singapore Ministry of Education (MOE) Academic Research Fund Tier 1 RG101/13. XRD, FESEM and TEM characterization was performed at the Facility for Analysis, Characterization, Testing and Simulation (FACTS) in Nanyang Technological University. The first author Lu Qi thanks the financial report from the NTU-JTC Industrial Infrastructure Innovation Centre.References
- R. C. Retzlaff, J. Am. Plann. Assoc., 2008, 74, 505–519 CrossRef.
- L. Pérez-Lombard, J. Ortiz and C. Pout, Energy Build., 2008, 40, 394–398 CrossRef.
- C. M. Lampert and C. G. Granqvist, Large-area chromogenics: Materials and devices for transmittance control, SPIE-The International Society for Optical Engineering, Bellingham, WA, USA, 1990, vol. IS 4 Search PubMed.
- C. Liu, X. Cao, A. Kamyshny, J. Law, S. Magdassi and Y. Long, J. Colloid Interface Sci., 2014, 427, 49–53 CrossRef CAS PubMed.
- Z. Zhang, Y. Gao, Z. Chen, J. Du, C. Cao, L. Kang and H. Luo, Langmuir, 2010, 26, 10738–10744 CrossRef CAS PubMed.
- A. Cavalleri, C. Tóth, C. W. Siders, J. Squier, F. Ráksi, P. Forget and J. Kieffer, Phys. Rev. Lett., 2001, 87, 237401 CrossRef CAS PubMed.
- M. M. Qazilbash, M. Brehm, B.-G. Chae, P.-C. Ho, G. O. Andreev, B.-J. Kim, S. J. Yun, A. Balatsky, M. Maple and F. Keilmann, Science, 2007, 318, 1750–1753 CrossRef CAS PubMed.
- F. Morin, Phys. Rev. Lett., 1959, 3, 34 CrossRef CAS.
- J. Zhou, Y. Gao, Z. Zhang, H. Luo, C. Cao, Z. Chen, L. Dai and X. Liu, Sci. Rep., 2013, 3, 3029 Search PubMed.
- N. Wang, S. Liu, X. Zeng, S. Magdassi and Y. Long, J. Mater. Chem. C, 2015, 3, 6771–6777 RSC.
- S. Wang, M. Liu, L. Kong, Y. Long, X. Jiang and A. Yu, Prog. Mater. Sci., 2016, 81, 1–54 CrossRef CAS.
- N. Mlyuka, G. Niklasson and C.-G. Granqvist, Appl. Phys. Lett., 2009, 95, 171909 CrossRef.
- C.-G. Granqvist, P. Lansåker, N. Mlyuka, G. Niklasson and E. Avendano, Sol. Energy Mater. Sol. Cells, 2009, 93, 2032–2039 CrossRef CAS.
- S. Chen, L. Dai, J. Liu, Y. Gao, X. Liu, Z. Chen, J. Zhou, C. Cao, P. Han and H. Luo, Phys. Chem. Chem. Phys., 2013, 15, 17537–17543 RSC.
- C. B. Greenberg, Thin Solid Films, 1983, 110, 73–82 CrossRef CAS.
- W.-L. Hu, G. Xu, J.-W. Ma, B. Xiong and J.-F. Shi, Acta Phys.-Chim. Sin., 2012, 28, 1533–1538 CAS.
- N. Wang, M. Duchamp, R. E. Dunin-Borkowski, S. Liu, X. Zeng, X. Cao and Y. Long, Langmuir, 2016, 32, 759–764 CrossRef CAS PubMed.
- X. Cao, N. Wang, S. Magdassi, D. Mandler and Y. Long, Sci. Adv. Mater., 2014, 6, 558–561 CrossRef CAS.
- Z. Zhang, Y. Gao, H. Luo, L. Kang, Z. Chen, J. Du, M. Kanehira, Y. Zhang and Z. L. Wang, Energy Environ. Sci., 2011, 4, 4290–4297 CAS.
- M. Zhou, J. Bao, M. Tao, R. Zhu, Y. Lin, X. Zhang and Y. Xie, Chem. Commun., 2013, 49, 6021–6023 RSC.
- S. Ding, Z. Liu, D. Li, W. Zhao, Y. Wang, D. Wan and F. Huang, ACS Appl. Mater. Interfaces, 2013, 5, 1630–1635 CAS.
- L. Zhao, L. Miao, C. Liu, C. Li, T. Asaka, Y. Kang, Y. Iwamoto, S. Tanemura, H. Gu and H. Su, Sci. Rep., 2014, 4, 7000 CrossRef CAS PubMed.
- Z. Chen, C. Cao, S. Chen, H. Luo and Y. Gao, J. Mater. Chem. A, 2014, 2, 11874–11884 CAS.
- J. Du, Y. Gao, H. Luo, Z. Zhang, L. Kang and Z. Chen, Sol. Energy Mater. Sol. Cells, 2011, 95, 1604–1609 CrossRef CAS.
- S.-Y. Li, G. A. Niklasson and C.-G. Granqvist, Appl. Phys. Lett., 2011, 99, 131907 CrossRef.
- Y. Gao, S. Wang, L. Kang, Z. Chen, J. Du, X. Liu, H. Luo and M. Kanehira, Energy Environ. Sci., 2012, 5, 8234–8237 CAS.
- X. Qian, N. Wang, Y. Li, J. Zhang, Z. Xu and Y. Long, Langmuir, 2014, 30, 10766–10771 CrossRef CAS PubMed.
- A. Taylor, I. Parkin, N. Noor, C. Tummeltshammer, M. S. Brown and I. Papakonstantinou, Opt. Express, 2013, 21, A750–A764 CrossRef PubMed.
- Y. Zhou, Y. Cai, X. Hu and Y. Long, J. Mater. Chem. A, 2014, 2, 13550–13555 CAS.
- Y. Zhou, Y. Cai, X. Hu and Y. Long, J. Mater. Chem. A, 2015, 3, 1121–1126 CAS.
- C. Liu, I. Balin, S. Magdassi, I. Abdulhalim and Y. Long, Opt. Express, 2015, 23, A124–A132 CrossRef PubMed.
- S.-Y. Li, G. A. Niklasson and C.-G. Granqvist, J. Appl. Phys., 2010, 108, 063525 CrossRef.
- L. Kang, Y. Gao, H. Luo, Z. Chen, J. Du and Z. Zhang, ACS Appl. Mater. Interfaces, 2011, 3, 135–138 CAS.
- M. Layani and S. Magdassi, J. Mater. Chem., 2011, 21, 15378–15382 RSC.
- N. R. Mlyuka, G. A. Niklasson and C. G. Granqvist, Phys. Status Solidi A, 2009, 206, 2155–2160 CrossRef CAS.
- G. Wyszecki and W. S. Stiles, Color Science: Concepts and Methods, Quantitative Data and Fomulae, Wiley, New York, 2nd edn, 2000 Search PubMed.
- In ASTM G173-03 Standard Tables of Reference Solar Spectral Irradiances: Direct Normal and Hemispherical on a 37° Tilted Surface, Annual Book of ASTM Standards American Society for Testing and Materials, Philadelphia, PA, USA, 2003, vol. 14.04, http://rredc.nrel.gov/solar/spectra/am1.5.
Footnote |
| † Electronic supplementary information (ESI) available. See DOI: 10.1039/c6tc02694j |
| This journal is © The Royal Society of Chemistry 2016 |

