 Open Access Article
Creative Commons Attribution 3.0 Unported Licence
Photoluminescence, cathodoluminescence and micro-Raman investigations of monoclinic nanometre-sized Y2O3 and Y2O3:Eu3+
Daniel
den Engelsen
a,
Terry G.
Ireland
*a,
Paul G.
Harris
a,
George R.
Fern
a,
Paul
Reip
b and
Jack
Silver
a
aCentre for Phosphor and Display Materials, Wolfson Centre for Materials Processing, Brunel University London, Uxbridge, Middlesex UB8 3PH, UK. E-mail: Terry.ireland@brunel.ac.uk
bIntrinsiq Materials Ltd, Building Y25, Cody Technology Park, Ively Road, Farnborough, Hampshire GU14 0LX, UK
First published on 12th September 2016
Abstract
Herein we describe a large scale synthesis of nanosized, monoclinic Y2O3 and Y2O3:Eu3+ with 2 mol% Eu3+ in a plasma-discharge chamber. This high yield synthesis provided nanosized particles with dimensions between 5 nm to 50 nm, which were stable during shelf life at ambient conditions for more than 6 years. We assume that the Gibbs–Thomson effect is responsible for this unexpected high stability. Annealing at 950 °C completely transformed the monoclinic particles into the cubic phase, which was indicated by the photo- and cathodoluminescence emission spectra in addition to the much stronger light output. The undoped Y2O3 material was contaminated with Dy3+, which showed characteristic and rather strong luminescence upon activation with a He–Ne laser at 632.8 nm, both at the Stokes and anti-Stokes side. Photoluminescence, cathodoluminescence and Raman spectra of the undoped and doped monoclinic nanocrystals were recorded and partially interpreted.
1. Introduction
Yttrium oxide (Y2O3) doped with trivalent Eu3+ is a well-known red emitting phosphor, which has found applications in fluorescent lamps and plasma display panels.1,2 For application in high resolution displays it was thought that small phosphors particles would be necessary and this assumption increased interest to produce nanometre sized Y2O3:Eu3+.3 In the industrial applications of Y2O3:Eu3+ the Y2O3 host has the cubic (C type) phase, which is stable at ambient conditions and, most important, it has a rather high luminous efficiency when doped with Eu3+. There are three other Y2O3 polymorphs, two of these have the A- and B-type rare earth sesquioxide structures that correspond to hexagonal and monoclinic phases respectively. The latter monoclinic B-type phase is formed at high pressure, whilst the hexagonal A-type structure has been reported to be formed at 2325 °C,4 which is close to the melting temperature of Y2O3 at 2410 °C. Finally, the cubic Y2O3 polymorph transforms to a fluorite phase with disordered oxygen vacancies at 2308 °C.5 In this study we focus on the monoclinic and cubic phases of Y2O3:Eu3+, the high temperature phases will not be considered.Literature on the synthesis and spectral characterisation of monoclinic Y2O3:Eu3+ is rather modest as compared to the vast literature on the cubic structure. The synthesis of monoclinic Y2O3 at ambient pressure conditions is not obvious; mostly the cubic phase will be obtained upon annealing powders at high temperature. Flame spray pyrolysis has been used to prepare nanometre-sized monoclinic Y2O3:Eu3+ or a mixture of the cubic and monoclinic phases.4,6–10 By adjusting the residence time of the particles in the flame, Camenzind et al.6 were able to determine the structure of the particles. Short residence times yielded small particle size with predominantly monoclinic structure. Qin et al. synthesised only monoclinic material when varying the residence time of the precursor in the flame.7 Monoclinic Y2O3:Eu3+ nanometre-sized particles with approximately 10 nm in diameter were reported via different gas condensation methods.11,12 Wang et al.13 studied phase transitions in Y2O3 and Y2O3:Eu3+ as a function of pressure. Compression of cubic Y2O3:Eu3+ at room temperature and medium pressure yielded the monoclinic phase, which finally transformed into the hexagonal phase at very high pressure. Decompression produced the monoclinic phase only. Similar results for Y2O3:Eu3+ were found by Zhang et al.14 by recording the photoluminescence as a function of pressure. From these works it can be concluded that once the monoclinic phase has been formed, it does not automatically return to the cubic phase. A plasma coating process for the fabrication of monoclinic undoped Y2O3 thin films was described by Gourlaouen et al.15 These authors indicated that starting from cubic Y2O3 powder the yield of monoclinic Y2O3 was about 5% at a maximum. They also described the phase transition of monoclinic Y2O3 to cubic Y2O3 by annealing at high temperatures. The stability of the monoclinic phase of Y2O3 at room temperature and ambient pressure has been explained in terms of the Gibbs–Thomson effect,4,11,16 which indicates that a very high specific surface area of the nano-particles increases the internal pressure to the same order of magnitude as that of the pressure required for the cubic-monoclinic transformation.
There are a number of problems encountered with the flame spray pyrolysis and gas condensation methods to produce Y2O3:Eu3+ nano-particles. First, the yields are usually low. Second, the resulting material in some cases is Y2O3:Eu3+ precursor that requires heat treatment to convert to the luminescent oxide: as a consequence this will cause particle growth and sintering between particles. Finally, in most cases mixtures of the monoclinic and cubic phases are obtained. Monoclinic bulk Y2O3 is not stable at ambient pressure, whereas nanometre-sized particles seem to be stable. This raises the questions (1) what would be the critical size to obtain stability and (2) what happens in a powder of monoclinic Y2O3 (doped or non-doped) with a grain size distribution from micrometres to nanometres? These two latter questions were also important in starting this study. Here we describe the synthesis of discrete nanometre sized-particles of Y2O3 and Y2O3:Eu3+ using a high-temperature plasma method that provides a high product yield. The original idea in choosing this method was to make nanometre-sized cubic Y2O3 doped with rare earth elements on a large scale. As it turned out in the course of this work, this synthesis provided primarily the monoclinic phase of Y2O3, which was quite unexpected. The materials were characterised using X-ray powder diffraction (XRD) and transmission electron microscopy (TEM), both in stationary and scanning modes. In the case of Y2O3:Eu3+, cathodoluminescence imaging was carried out and the photoluminescence (PL), cathodoluminescence (CL) and Raman scattering properties were also studied.
2. Materials and methods
2.1. Materials
Starting materials, Y2O3 powder and europium oxide (Absco Ltd, Haverhill, UK, 99.99%) were used without additional purification. The monoclinic Y2O3 and Y2O3:Eu3+ materials were produced according to Intrinsiq's patented plasma process17 by wet mixing europium oxide and cubic yttrium oxide in a tubular mixer, followed by drying and then a secondary crushing process to break the materials down to sub 10 μm. This feedstock of precursors was fed by gravity into the hot plasma (>9000 °C), in which it vaporised and condensed to form the nanometre-sized phosphor particles.Typical parameters for producing about 1 kg of material were 80 kW torch power, with 2000 l min−1 argon flow rate to cool the materials down to suitable temperature for quality testing and collection on a set of nano-porous stainless steel filters, before blowing back to release and collect. Cubic nanometre-sized Y2O3:Eu3+, which was measured for reference purposes only, was synthesized according to the urea precipitation method, which has been described in detail in our previous work.18–20
2.2. Methods and equipment
XRD measurements were made using a Bruker D8 powder diffractometer fitted with a Lynxeye multi-element detector and operating in the theta–theta scan mode. The powders were placed in an A100B3B Air tight XRD holder and the data were recorded from 5° < 2θ < 100° at 293 K. Copper radiation was used and the emission profile calibrated using NIST 660a LaB6 line profile standard and line position was calibrated using a corundum standard from Bruker. The line profile was analysed with Bruker Diffrac Plus Evaluation version 13,0,0,2 and the data were refined using Bruker's AXS Topas version 3.0 Rietveld refinement computer software. The background was fitted with a Chebychev polynomial.For the studies in the TEM copper grids coated with thin carbon films having small holes (holey carbon films) were used as substrates: these are transparent to the high-energy electrons. TEM was carried out using a JEOL 2100F (Japan). The TEM was equipped with a Vulcan™ CL detector of Gatan (USA) for imaging and spectroscopic purposes. This system used a Czerny-Turner spectrometer with back-illuminated CCD and a grating with 1200 lines per mm (blazed at 500 nm) for collection of CL emission spectra. Light was collected from the sample using a mirror above and below the sample, which enabled a solid angle of about 5 sr, which is almost half of a sphere.
For recording CL spectra samples were mounted in two different high vacuum chambers at a vacuum level of ≈3 × 10⁻⁶ mbar using Kimball Physics Inc. (USA) electron guns and associated power supplies over the ranges of electron beam voltages of 1–5 kV and 3–15 kV respectively. The electron guns had the ability to focus and defocus the beam over a range of current densities. The luminous efficiency and energy efficiency were measured with a uniform electron beam (by defocusing) at current densities between 1 and 10 μA cm−2. Deflection plates enabled optimum positioning of the electron beam on the sample and a ZnO:Zn reference. The latter being a non-charging thin film of ZnO:Zn powder on ITO to adjust the current in the thin powder layers of Y2O3 and Y2O3:Eu3+: in this way we could cope with the effect of charging of the non-conductive Y2O3 layers as explained in our previous work.20
Radiance and luminance of CL were measured with a Jeti Radiometer (Spectrobos 1200, Germany) between 380 and 780 nm as described earlier.18,20 PL- and CL-spectra were measured with a Bentham Instruments dual monochromator system equipped with 0.37 mm slits. Emission spectra were recorded in the range of 300 nm to 800 nm in steps of 0.2 nm. The wavelength error of the Bentham spectrometer was estimated to be ±0.5 nm. Raman and laser induced fluorescence spectra of the samples were measured with a Horiba Jobin Yvon Labram HR monochromator by excitation with a He–Ne laser at 298 K. The wavelength error of the Labram monochromator was smaller: about ±0.2 nm.
3. Results
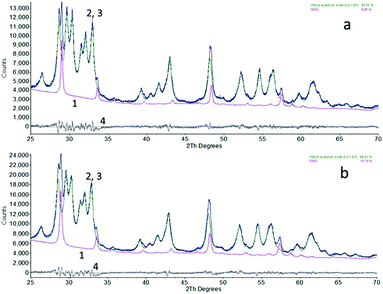
The nanometre-sized particles of Y2O3 and Y2O3:Eu3+ obtained by high-temperature plasma synthesis were white under the D50 lamp, similar to that of the bulk material; using 254 nm light excitation only the europium-doped material displayed red luminescence. Energy dispersive X-ray analysis (EDX) of the undoped and doped samples showed some contamination (<0.5%) of Fe and Cu, the Fe was probably from the stainless steel rings in the reaction chamber and the origin of the Cu was from the nozzles of the plasma discharge flame. The Eu3+ concentration of the doped sample was about 2%. No other contaminations could be detected with this technique.Fig. 1 shows the XRD diagrams of the high-temperature plasma synthesised Y2O3 and Y2O3:Eu3+ nano-particles. They were both predominantly composed of the monoclinic (B-type) phase (89% and 93%) with some cubic (C-type) phase (11% and 7%) when compared to a reference pattern. This composition of the samples was calculated from the XRD graphs using Bruker's AXS Topas version 3.0 Rietveld refinement computer software. The yield of monoclinic phase was much higher than that obtained by Gourlaouen et al.15 with a plasma spray gun.
The undoped and doped compounds had similar crystallite sizes of 17.7 nm and 17.9 nm for the monoclinic phase and 30.0 nm and 45.0 nm for the cubic phase, determined by XRD line-broadening analysis using Scherrer's method, which is included in the Topas software.
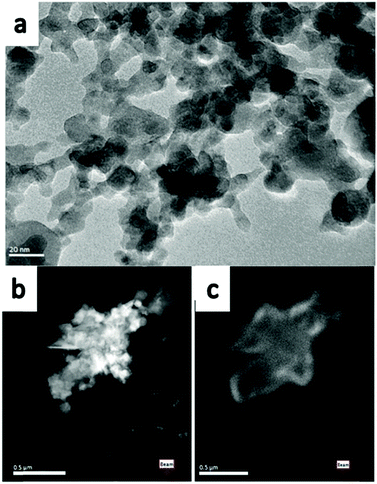
The TEM image in Fig. 2a represents the as-synthesised monoclinic Y2O3 nano-particles, which have sizes from 5 nm to 50 nm. This agrees with the crystallite size as determined from the XRD diagrams. Fig. 2a shows that these particles were sintered and formed a large cluster. Since the image of the Y2O3:Eu3+ particles is essentially identical to that of the undoped particles, it will not be reproduced here. The Scanning TEM (STEM) images shown in Fig. 2b and c are at a smaller magnification. Recording of the panchromatic image (Fig. 2c) was possible by maximizing the current in the e-beam.
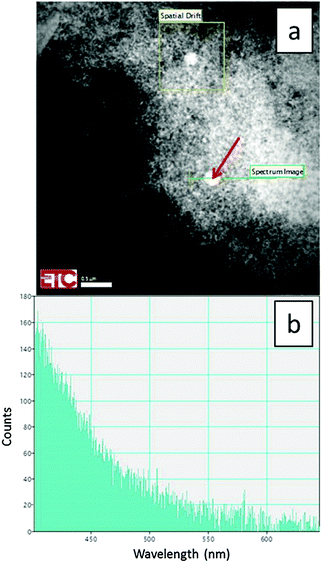
Some larger particles of about 250 nm were observed to be present in the products due to precursor oxides passing directly through the plasma without totally evaporating to ions, presumably due to being too large initially as shown in Fig. 3a. This figure is a STEM image at 200 kV and temperature of −170 °C of doped monoclinic material. Since the large particles differ substantially from the smaller monoclinic-phase particles shown in Fig. 2a, we conclude that these particles are non-reacted cubic Y2O3 precursor material. A proof of this hypothesis is shown in Fig. 3b, which is the CL spectrum of the large particle, indicated with the red arrow in Fig. 3a, recorded with the Gatan spectrometer connected to the TEM. This spectrum shows only the intrinsic blue emission of cubic Y2O3 between 400 and 500 nm upon excitation with high energetic electrons.21 From this spectrum it can be concluded that the large spherical particle did not contain the Eu-dopant; routinely a strong Eu3+ emission would be observed from this sized particle. Another indication that this particle must be cubic Y2O3 is the fact that 2% Eu3+ will almost quench the intrinsic Y2O3 emission.21 The mere presence of this intrinsic emission is thus a proof that the particle is undoped Y2O3 precursor. The evidence presented in Fig. 3a and b indicates that the composition of the synthesized samples calculated above from the XRD-data is somewhat misleading, because the samples contained a small quantity of non-reacted cubic Y2O3 particles. Since these precursor particles did not contain Eu3+, the percentage of monoclinic Y2O3:Eu3+ is substantially larger than 93% as compared to cubic Y2O3:Eu3+. In the discussion of Fig. 12a hereafter, we shall indicate that the percentage of monoclinic Y2O3:Eu3+ is more than 99% as compared to cubic Y2O3:Eu3+ when the quantity of non-reacted precursor material is ignored.
In Fig. 4 XRD diagrams of annealed monoclinic Y2O3:Eu3+ nanoparticles over the temperature range 800 °C to 1000 °C for 60 minutes are presented. From these diffractograms the transformation from monoclinic to cubic phase is shown to be partial at 900 °C and complete at 1000 °C. This agrees with the differential scanning calorimetry data published by Zhang et al.4 that indicates a phase transition from monoclinic to cubic Y2O3 between 850 °C and 950 °C. As a consequence of the annealing treatments, an increase in crystallite size was observed: at 800 °C the crystallite size was 25.6 nm and 34.3 nm, increasing to 48.5 nm and 42.7 nm at 900 °C for the monoclinic and cubic phases respectively and 63.3 nm at 1000 °C for the cubic phase.
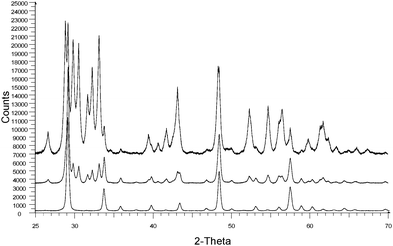 | ||
| Fig. 4 XRD patterns of monoclinic Y2O3:Eu3+ plasma discharge nano-particles after annealing at 800 °C (top), 900 °C (middle) and 1000 °C (bottom) for 60 minutes. | ||
The TEM images shown in Fig. 5a–c refer to monoclinic Y2O3:Eu3+ samples annealed at 800 °C, 900 °C and 1000 °C for 60 minutes. It can be seen that particle growth occurs with an increase in annealing temperature. After annealing above the monoclinic to cubic phase transition temperature, which occurs between 850 °C to 950 °C, the particles are observed to grow considerably in size to between 25 nm to 100 nm.
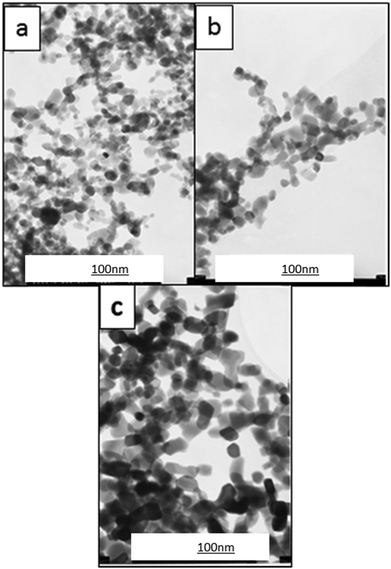 | ||
| Fig. 5 TEM images of Y2O3:Eu3+ samples annealed at (a) 800 °C (b) 900 °C and (c) 1000 °C for 60 minutes. | ||
The normalised PL excitation and emission spectra of the high-temperature plasma synthesised Y2O3:Eu3+ nano-particles are presented in Fig. 6. The sample was excited using 260 nm UV-light; the excitation spectrum was collected monitoring the 624 nm peak. The emission spectrum is representative of the Eu3+ ion in a monoclinic Y2O3 host lattice.
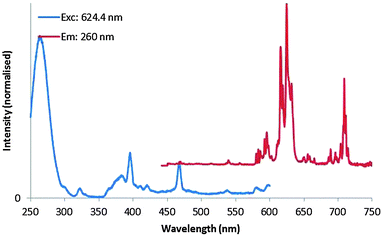 | ||
| Fig. 6 Normalised PL excitation (monitored at 624 nm, normalised at 260 nm) and emission (excited at 260 nm, normalised at 624 nm) spectra of monoclinic Y2O3:Eu3+ nano-particles. | ||
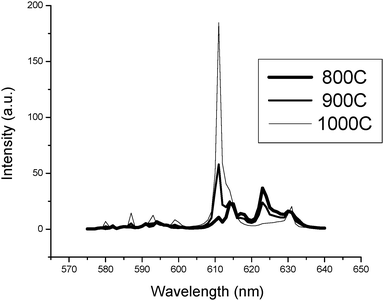
A comparison of various PL emission spectra is presented in Fig. 7 for the high-temperature plasma synthesised monoclinic Y2O3:Eu3+ nano-particles after annealing for a period of 60 minutes at temperatures of 800 °C, 900 °C and 1000 °C. These spectra illustrate the transition from monoclinic to cubic phase that occurs between 850 °C and 950 °C: these spectra agree favourably with the results represented in Fig. 4. The intensity of light emitted under PL excitation from monoclinic Y2O3:Eu3+ phosphor is much weaker than that from a cubic Y2O3:Eu3+ phosphor; this is demonstrated by the relative intensities of the spectra shown in Fig. 7 for identical phosphor screen weights and in Fig. 10, to be discussed hereafter.
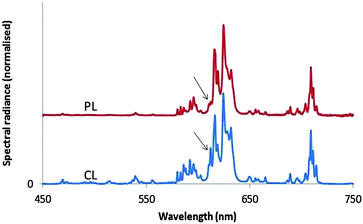
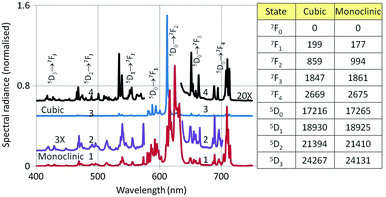
Fig. 8 shows the PL and CL spectra of monoclinic Y2O3:Eu3+. The PL spectrum was obtained by exciting with 260 nm ultraviolet light. The CL spectrum refers to a sample that was bombarded with 15 keV electrons; the current density was 1 μA cm−2. The further the emission lines in the CL spectrum are from the strong peak at 624 nm, the stronger they are as compared to the corresponding lines in the PL spectrum. The strong 5D0 → 7F2 line of the cubic phase is the only transition of this material that can be observed in the spectra of Fig. 8. It has been indicated with an arrow. This transition is more clearly visible in Fig. 12a. In Fig. 9 we have depicted the CL spectra of nanosized cubic and monoclinic Y2O3:Eu3+. Both spectra were recorded at identical conditions: beam energy of 15 keV and current density of 1 μA cm−2.
The assignments of the transition manifolds that are clearly noticeable have been indicated in Fig. 9. The wavelength difference of corresponding transition clusters between monoclinic and cubic Y2O3:Eu3+ is small, which is to be expected for intra-4f transitions of the Eu3+ ion. The table in Fig. 9 lists the lowest energy levels (in cm−1) for the indicated electronic states of Eu3+ in the two hosts. The levels for monoclinic Y2O3:Eu3+ have been calculated from the spectra represented in Fig. 9, while the levels for the cubic phase are from Wen et al.22 and Gruber et al.23 The largest difference between the cubic and monoclinic material was found for the level of 7F2: for the other states the levels are quite similar. In spite of the similarity in energy, the spectra of the cubic and monoclinic phase look quite different, especially for the 5D0 → 7F2 transition manifold. In cubic Y2O3:Eu3+ the peak with the strongest spectral radiance has the lowest wavelength (611 nm), while in monoclinic Y2O3:Eu3+ the peak with the strongest spectral radiance is at 624 nm, which is the 5th peak of the 5D0 → 7F2 manifold: this can be observed more clearly in Fig. 12a, to be discussed later. The differences in spectral radiance between the peaks of a particular transition manifold exemplify the sensitivity of Eu3+ to the coordination: in the cubic material Eu3+ is 6-fold coordinated, whereas in monoclinic Y2O3 it is 7-fold coordinated.12
The spectra of monoclinic Y2O3:Eu3+ synthesised by plasma discharge in Fig. 8 and 9 show the 5D0 → 7F2 transition of the cubic material at 611 nm, which is substantially larger in the CL spectrum than in the PL spectrum. This is a spectroscopic confirmation of the XRD-results that the high-temperature plasma Y2O3:Eu3+ was not purely monoclinic. The first PL spectrum of the monoclinic sample was recorded in 2009 and the most recent in May 2015. Since there was no change in the height of this 611 nm peak with respect to the heights of neighbouring peaks, it can be concluded that the nanosized monoclinic Y2O3:Eu3+ crystals with the rather small particles are stable during shelf life at ambient conditions for a long time.
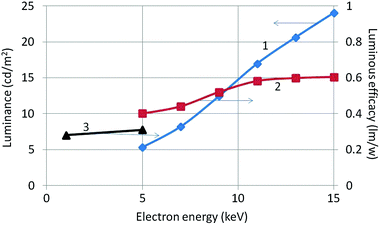
Luminance and radiance of the samples were measured with the Jeti Radiometer upon electron bombardment between 5 and 15 kV and current density between 1 and 3 μA cm−2. From the luminance the luminous efficacy can be calculated, while the energy efficiency is calculated from the measured radiance.18 Luminous efficacy results are presented in Fig. 10 for CL measurements at electron beam energies between 1 and 15 keV. The curve of the luminous efficacy versus beam voltage does not vary strongly between 5 and 15 kV, indicating that at low beam voltages monoclinic Y2O3:Eu3+ is already luminescing quite well. However, its luminous efficacy is about 25 times weaker at 15 kV than that of nanosized cubic Y2O3:Eu3+![[thin space (1/6-em)]](https://www.rsc.org/images/entities/char_2009.gif) 18 which makes this phosphor not particularly attractive for industrial applications. The energy efficiency of the CL between 380 and 780 nm of monoclinic Y2O3:Eu3+ at 15 kV is found to be 0.2%, which 20 times smaller than that of cubic Y2O3:Eu3+.18 Curve 2 in Fig. 10 underpins the information presented in Fig. 7 that the total light output increases as the structure transforms from the monoclinic through a mixed monoclinic/cubic phase with increasing temperature treatment and finally to a pure cubic phase.
18 which makes this phosphor not particularly attractive for industrial applications. The energy efficiency of the CL between 380 and 780 nm of monoclinic Y2O3:Eu3+ at 15 kV is found to be 0.2%, which 20 times smaller than that of cubic Y2O3:Eu3+.18 Curve 2 in Fig. 10 underpins the information presented in Fig. 7 that the total light output increases as the structure transforms from the monoclinic through a mixed monoclinic/cubic phase with increasing temperature treatment and finally to a pure cubic phase.
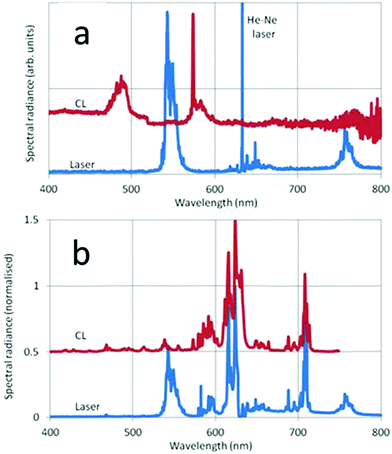
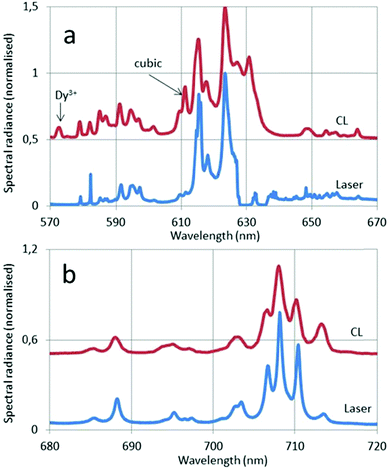
In Fig. 11 the CL and laser-activated spectra of undoped and doped monoclinic Y2O3 nanometre-sized particles are presented. The laser-activated spectrum of the undoped material in Fig. 11a shows surprisingly a strong luminescence signal at the anti-Stokes side (543 nm) of the He–Ne laser and at the Stokes side (756 nm) we detected also a rather strong luminescence. These two luminescence clusters are assigned to Dy3+, which was a contaminant of the Y2O3 starting material for the high-temperature plasma synthesis, present in the ppm-range. As mentioned above, this contamination could not be detected with our EDX equipment. The CL spectrum in Fig. 11a shows Dy3+ transitions at 573 nm and 485 nm. The Dy3+ transitions will be discussed hereafter; first we shall concentrate on the laser-activated spectrum of Eu3+. Since the laser-activated spectra have been recorded with a high resolution Horiba Jobin Yvon Labram spectrometer, we shall represent some details of the spectra shown in Fig. 11b at larger abscissas in Fig. 12.
In Fig. 12a the 5D0–7F2 transition of the cubic phase at 611 nm has been indicated with an arrow. The spectral radiance of this transition is about four times smaller than the spectral radiance of the 5D0–7F2 transition of the monoclinic phase at 624 nm. From this result we can estimate the amount of cubic phase in the sample doped with Eu3+.
Let R611(cubic) be the radiance of the 5D0–7F2 transition of the cubic phase and R624(mono) the radiance of the corresponding transition for the monoclinic phase, x be the weight fraction of cubic phase, ηc and ηm be the energy efficiencies of the cubic and monoclinic materials respectively and fc and fm be the (fractional) contributions of the 611 nm and 624 nm transitions to the energy efficiency for the cubic and monoclinic materials respectively. From the low resolution spectra recorded with the Jeti radiometer we found that fc = 0.56 and fm = 0.41. This implies that the contribution of the 5D0–7F2 transition of the cubic phase to the energy efficiency is 1.36 times larger than that for the monoclinic phase. The fraction x is calculated from the following equation
Both Fig. 8 and 12a show that only the CL spectrum of monoclinic Y2O3:Eu3+ exhibits clearly the 5D0–7F2 transition of the cubic phase at 611 nm. This latter transition is much weaker in the PL and laser-activated spectra. The excitation mechanism for the latter two spectra is more subtle and depends strongly on the energy of the exciting radiation. Since we had no efficiency information for the PL and laser-activated spectra, we had to base our yield calculation on the CL-data only.
The 5D0 → 7F2 peak at 615 nm in Fig. 8 and 9 is split in the laser-activated spectrum of Fig. 12a and consists of three peaks at 614.6 nm, 615.4 nm and 616 nm. The laser-activated spectrum of nanosized cubic Y2O3:Eu3+ was reported by Silver et al.24 They showed that besides Stokes and anti-Stokes luminescence, excitation of high-energy levels is possible through the absorption of two laser photons. This mechanism can also explain the presence of some (very) weak transitions in the laser-activated spectrum of monoclinic Y2O3:Eu3+ at 467 nm, 490 nm and 513 nm, which belong to the 5D2 → 7FJ manifold of Eu3+. In Fig. 12a we have indicated the Dy3+ transition in the CL spectrum at 573 nm with an arrow.
We shall now discuss the Dy3+ peaks in the laser-activated and CL spectra of Fig. 11a and b. The anti-Stokes cluster at 543 nm (18![[thin space (1/6-em)]](https://www.rsc.org/images/entities/char_2009.gif) 412 cm−1) is attributed to the 4I15/2 → 6H13/2 electronic transition of Dy3+, while the Stokes cluster at 756 nm (13
412 cm−1) is attributed to the 4I15/2 → 6H13/2 electronic transition of Dy3+, while the Stokes cluster at 756 nm (13![[thin space (1/6-em)]](https://www.rsc.org/images/entities/char_2009.gif) 224 cm−1) is due to 4F9/2 → 6H9/2. These transitions have been visualized in Fig. 13 by the green and red downward arrows respectively.
224 cm−1) is due to 4F9/2 → 6H9/2. These transitions have been visualized in Fig. 13 by the green and red downward arrows respectively.
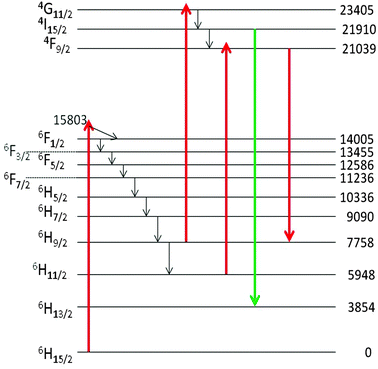 | ||
| Fig. 13 Schematic energy level diagram of cubic Y2O3:Dy3+ and the proposed excitation and emission transitions. The energy levels, indicated in cm−1, are from Chang et al.25 | ||
The assignments reported here are based on the electronic levels of Dy3+ in cubic Y2O3,25 which deviate slightly from the values measured by us in monoclinic Y2O3. Only the lowest levels of the manifolds have been represented in Fig. 13. The excitation to the 4I15/2 and 4F9/2 levels of Dy3+ is supposed to be controlled by the excited states absorption (ESA) process, as explained by Silver et al.24 First the 6F1/2 level is populated by the He–Ne laser. The energy trickles radiationless down to the 6H9/2 and 6H11/2 levels, from where it can be excited to either the 4F9/2 or the 4G11/2 level by absorption of another He–Ne photon. We consider this ESA process more likely than an alternative route via the absorption of two He–Ne photons. The reason is that (1) a two-photon absorption would probably lead to very weak luminescence of Dy3+ and (2) the ESA process requires excitation of the 6F1/2 state, which is almost resonant with the He–Ne laser: it should be kept in mind that only the lowest level of the electronic states are indicated in Fig. 13. We have checked this hypothesis by using a laser at 532 nm. When activating the undoped monoclinic Y2O3 with this laser we did not observe the characteristic transitions at 543 nm and 756 nm (not shown here). Hence, it can be concluded that the mechanism indicated in Fig. 13 for the luminescence of the monoclinic Y2O3:Dy3+ is likely.
The CL spectrum of Fig. 11a shows different Dy3+ transitions. The peak at 573 nm (17![[thin space (1/6-em)]](https://www.rsc.org/images/entities/char_2009.gif) 428 cm−1) is due to 4F9/2 → 6H13/2, while the cluster at 482 nm (20
428 cm−1) is due to 4F9/2 → 6H13/2, while the cluster at 482 nm (20![[thin space (1/6-em)]](https://www.rsc.org/images/entities/char_2009.gif) 756 cm−1) is attributed to 4F9/2 → 6H15/2. These latter transitions were also recorded by Vetrone et al.26 in cubic Y2O3:Dy3+ with PL. The differences between the Dy3+ levels of cubic and monoclinic Y2O3:Dy3+ are rather small: the energy values indicated in the diagram of Fig. 13 refer to the lowest values of the manifolds and represent the right-hand sides of the recorded transitions clusters. The Dy3+ peak at 573 nm has been erased in the CL spectrum represented in Fig. 8 in order to avoid confusion, whereas it still present in the CL spectrum of the monoclinic material in Fig. 9.
756 cm−1) is attributed to 4F9/2 → 6H15/2. These latter transitions were also recorded by Vetrone et al.26 in cubic Y2O3:Dy3+ with PL. The differences between the Dy3+ levels of cubic and monoclinic Y2O3:Dy3+ are rather small: the energy values indicated in the diagram of Fig. 13 refer to the lowest values of the manifolds and represent the right-hand sides of the recorded transitions clusters. The Dy3+ peak at 573 nm has been erased in the CL spectrum represented in Fig. 8 in order to avoid confusion, whereas it still present in the CL spectrum of the monoclinic material in Fig. 9.
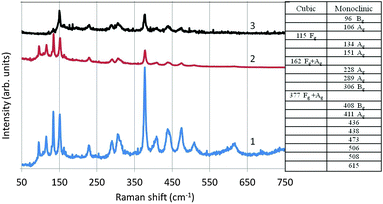
In Fig. 14 we have depicted the Raman spectrum of undoped monoclinic Y2O3. In this figure spectrum (1) is the conventional Raman spectrum at the Stokes-side of the He–Ne line. Spectrum (2) has been derived from (1) by multiplication with the Boltzmann factor: e−hν/kT, in which h is Planck's constant, ν is the frequency of the actual Raman line, k is Boltzmann's constant and T is 298 K. Spectrum 3 in Fig. 14 is the anti-Stokes Raman spectrum. As expected, the spectra (2) and (3) are largely identical; nevertheless, spectrum (2) and the anti-Stokes spectrum (3) differ substantially at ν < 150 cm−1: the Raman peaks at 96 cm−1, 106 cm−1 and 115 cm−1 are not observed in the anti-Stokes spectrum. The reason for this difference is unknown.
In Fig. 14 we have also represented a table with an assignment of the Raman lines at ν < 411 cm−1. As mentioned above, the high-temperature plasma synthesis of Y2O3 did not yield pure monoclinic material, but also some cubic crystals. Raman lines for cubic Y2O3:Eu3+ are at 115 cm−1, 162 cm−1 and 377 cm−1, as indicated by Withnall et al.27 The other Raman lines of cubic Y2O3:Eu3+ detected by Withnall et al. were too weak to be observed in our sample with only about 15% cubic material. The assignment of the monoclinic Raman lines is based on the interpretation of the Raman spectra of monoclinic Sm2O3, Eu2O3 and Gd2O3 by Gouteron et al.28
4. Conclusions
The main conclusions of this investigation of monoclinic Y2O3 and Y2O3:Eu3+ by XRD, TEM and spectroscopy are: (1) the yield of monoclinic phase by plasma discharge synthesis is more than 99% if we ignore the non-reacted Y2O3 precursor and (2) nanometre-sized monoclinic material is stable during shelf life at ambient conditions. We attribute this stability to the small particle size (between 5 and 50 nm) of the monoclinic materials. We found that the luminous efficiency of monoclinic Y2O3:Eu3+ upon electron excitation is about 25 times less than that of the cubic material and we observed the transition from the monoclinic phase to the cubic phase at about 900 °C by XRD and PL. Since the starting Y2O3 material for the high-temperature plasma synthesis of monoclinic Y2O3 was contaminated with a small quantity of Dy3+, we were able to measure and interpret the laser-activated spectrum of monoclinic Y2O3:Dy3+. Hence, this study has also shown that excitation of inorganic crystals with a He–Ne laser provides an extremely sensitive and specific measuring method for the spectroscopic determination of traces of Dy3+.Acknowledgements
We are grateful to the EPSRC and the Technology Strategy Board (TSB) for funding the PURPOSE (TP11/MFE/6/I/AA129F; EPSRC TS/G000271/1), CONVERTED (JeS no. TS/1003053/1) and PRISM (EP/N508974/1) programs. We are also grateful to the TSB for funding the CONVERT program.References
- K. Kohmoto, in Phosphor Handbook, ed. W. Yen, S. Shionoya and H. Yamamoto, CRC Press, Boca Raton, 2nd edn, 2007, p. 437 Search PubMed.
- T. Justel, H. Nikol and C. Ronda, Angew. Chem., Int. Ed., 1998, 37, 3085 CrossRef.
- J. Silver, Metal Compounds as Phosphors, in Comprehensive Coordination Chemistry II: The Synthesis, Reactions Properties and Applications of Coordination Compounds, ed. J. A. McCleverty, Pergamon Press, New York, 2003, ch. 9.15, vol. 9, p. 689 Search PubMed.
- P. Zhang, A. Navrotsky, B. Gao, I. Kennedy, A. N. Clark, C. Lesher and Q. Liu, J. Phys. Chem. C, 2008, 112, 932 CAS.
- H. R. Hoekstra and K. A. Gingerich, Science, 1964, 146, 1163 CAS.
- A. Camenzind, R. Strobel and S. E. Pratsinis, Chem. Phys. Lett., 2005, 415, 193 CrossRef CAS.
- X. Qin, Y. Ju, S. Bernhard and N. Yao, J. Mater. Res., 2005, 20, 2960 CrossRef CAS.
- Y. C. Kang, D. J. Seo, S. B. Park and H. D. Park, Jpn. J. Appl. Phys., 2001, 40, 4083 CrossRef CAS.
- H. Chang, I. W. Lenggoro, K. Okuyama and T. O. Kim, Jpn. J. Appl. Phys., 2004, 43, 3535 CrossRef CAS.
- M. Okumura, M. Tamatani, A. K. Albessard and N. Matsuda, Jpn. J. Appl. Phys., 1997, 36, 6411 CrossRef CAS.
- W. Kraus and R. Birringer, Nanostruct. Mater., 1997, 9, 109 CrossRef.
- D. K. Williams, B. Bihari, B. M. Tissue and J. M. McHale, J. Phys. Chem. B, 1998, 102, 916 CrossRef CAS.
- L. Wang, Y. Pan, Y. Ding, W. Yang, W. L. Mao, S. V. Sinogeikin, Y. Meng, G. Shen and H. K. Mao, Appl. Phys. Lett., 2009, 94, 061921 CrossRef.
- J. Zhang, H. Cui, P. Zhu, C. Ma, X. Wu, H. Zhu, Y. Ma and Q. Cui, J. Appl. Phys., 2014, 115, 023502 CrossRef.
- V. Gourlaouen, G. Schnedecker, A. M. Lejus, M. Boncoeur and R. Collongues, Mater. Res. Bull., 1993, 28, 415 CrossRef CAS.
- G. Kaptay, J. Nanosci. Nanotechnol., 2011, 12, 1 Search PubMed.
- D. R. Johnson, US Pat., US2014/0370293 A1, 2014 Search PubMed.
- D. den Engelsen, P. G. Harris, T. G. Ireland and J. Silver, ECS J. Solid State Sci. Technol., 2014, 3, R53 CrossRef CAS.
- X. Jing, T. Ireland, C. Gibbons, D. J. Barber, J. Silver, A. Vecht, G. Fern, P. Trogwa and D. C. Morton, J. Electrochem. Soc., 1999, 146, 4654 CrossRef CAS.
- D. den Engelsen, P. G. Harris, T. G. Ireland, R. Withnall and J. Silver, ECS J. Solid State Sci. Technol., 2013, 2, R201 CrossRef CAS.
- D. den Engelsen, G. R. Fern, T. G. Ireland, P. G. Harris, P. R. Hobson, A. Lipman, R. Dhillon, P. Marsh and J. Silver, J. Mater. Chem. C, 2016, 4, 7026 RSC.
- J. Wen, L. Hu, M. Yin and S. Xia, Curr. Appl. Phys., 2012, 12, 732 CrossRef.
- J. B. Gruber, R. P. Leavitt, C. A. Morrison and N. C. Chang, J. Chem. Phys., 1985, 82, 5373 CrossRef CAS.
- J. Silver, M. I. Martinez-Rubio, T. G. Ireland, G. R. Fern and R. Withnall, J. Phys. Chem. B, 2001, 105, 9107 CrossRef CAS.
- N. C. Chang, J. B. Gruber, R. P. Leavitt and C. A. Morrison, J. Chem. Phys., 1982, 76, 3877 CrossRef CAS.
- F. Vetrone, J.-C. Boyer, J. A. Capobianco, A. Speghini and M. Bettinelli, Nanotechnology, 2004, 15, 75 CrossRef CAS.
- R. Withnall, J. Silver and T. G. Ireland, Proceedings of the XXIst International Conference on Raman Spectroscopy, 650 (2008).
- J. Gouteron, D. Michel, A. M. Lejus and J. Zarembowitch, J. Solid State Chem., 1981, 38, 288 CrossRef CAS.
| This journal is © The Royal Society of Chemistry 2016 |

