 Open Access Article
Creative Commons Attribution 3.0 Unported Licence
Modulating electron injection from an organic dye to a titania nanoparticle with a photochromic energy transfer acceptor†
George
Vamvounis
a,
Christopher R.
Glasson
a,
Evan J.
Bieske
b and
Viktoras
Dryza
*b
aCollege of Science, Technology and Engineering, James Cook University, Queensland 4811, Australia
bSchool of Chemistry, The University of Melbourne, Victoria 3010, Australia. E-mail: vdryza@unimelb.edu.au
First published on 1st June 2016
Abstract
We have prepared titania nanoparticles with an organic dye sensitiser and diarylethene molecular switch attached to the surface. Spectroscopic investigations show that the dye sensitiser's electron injection efficiency is reduced when the diarylethene is switched from its colourless, ring-open isomer to its coloured, ring-closed isomer, due to the introduction of a competing energy transfer pathway.
Using light to control the operation of molecular devices will be a key feature of future technologies. One approach towards achieving this goal is to employ photochromic molecular components that can be switched between isomers possessing different electronic or chemical attributes.1–5 Hybrid materials constructed from inorganic nanoparticles (NPs) coated with organic photochromes hold great promise as building blocks for such light-responsive devices.1–3,6–14
Diarylethenes are one of the most popular photochromes as both the colourless (ring-open) and coloured (ring-closed) isomers are thermally stable and undergo fast photoswitching with good fatigue resistance.1
Diarylethenes have been used to reversibly quench photophysical or photochemical processes by employing the coloured form as a Förster Resonance Energy Transfer (FRET) acceptor, diverting energy away from its intended task: fluorescence,1,15–18 electron transfer,15,19,20 up-conversion,21 or singlet oxygen generation.22,23 Whereas in previous studies electron transfer within a molecule has been modulated with photochromic FRET acceptor substituents,19,20 in the present communication we apply this concept to the much larger system of a dye-sensitised titania NP. Injection of an electron from a dye molecule's excited state into a metal oxide NP's conduction band is a key process in dye-sensitised solar cells (DSSCs) and photocatalysts.24,25
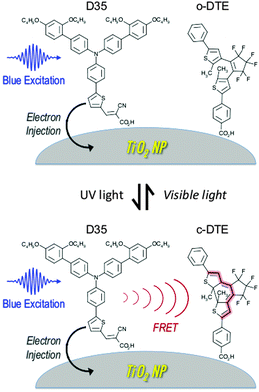
Titania NPs with both an organic DSSC sensitiser (D35)26 and a dithienylethene dye (DTE)9 attached to the surface have been prepared and examined spectroscopically. When DTE is in its ring-open form (o-DTE), the excited D35 is unaffected and undergoes electron injection into the titania conduction band. However, when DTE is in its ring-closed form (c-DTE), the excited D35 also undergoes D35 → c-DTE FRET, lowering the efficiency of electron injection. Switching between these two situations is achieved by irradiating the sample with UV or visible light, initiating o-DTE → c-DTE or c-DTE → o-DTE photoisomerisation, respectively. This scheme is shown in Fig. 1.
Dye-sensitised NPs containing either the D35 dye, DTE dye, or a D35![[thin space (1/6-em)]](https://www.rsc.org/images/entities/char_2009.gif) :
:![[thin space (1/6-em)]](https://www.rsc.org/images/entities/char_2009.gif) DTE 1
DTE 1![[thin space (1/6-em)]](https://www.rsc.org/images/entities/char_2009.gif) :
:![[thin space (1/6-em)]](https://www.rsc.org/images/entities/char_2009.gif) 1 ratio mixture were prepared (see ESI†). The inert chenodeoxycholic acid coadsorbent was also incorporated to prevent dye aggregation.27 The dyes and coadsorbent bind to metal oxide surfaces via their carboxylic acid groups.24 Electronically excited D35, o-DTE, and c-DTE are expected to undergo electron injection into the titania conduction band, based on their energetic parameters (see ESI†).26,28 Before probing the dyes on titania NPs, we examined them on zirconia NPs. Because zirconia has a large band gap and high conduction band edge, electron injection does not occur, allowing us to characterise the D35 → c-DTE FRET in isolation.11 The zirconia (ZrO2) samples are labelled D35-Zr, DTE-Zr, and D35 + DTE-Zr, whereas the titania (TiO2) samples are labelled D35-Ti, DTE-Ti, and D35 + DTE-Ti.
1 ratio mixture were prepared (see ESI†). The inert chenodeoxycholic acid coadsorbent was also incorporated to prevent dye aggregation.27 The dyes and coadsorbent bind to metal oxide surfaces via their carboxylic acid groups.24 Electronically excited D35, o-DTE, and c-DTE are expected to undergo electron injection into the titania conduction band, based on their energetic parameters (see ESI†).26,28 Before probing the dyes on titania NPs, we examined them on zirconia NPs. Because zirconia has a large band gap and high conduction band edge, electron injection does not occur, allowing us to characterise the D35 → c-DTE FRET in isolation.11 The zirconia (ZrO2) samples are labelled D35-Zr, DTE-Zr, and D35 + DTE-Zr, whereas the titania (TiO2) samples are labelled D35-Ti, DTE-Ti, and D35 + DTE-Ti.
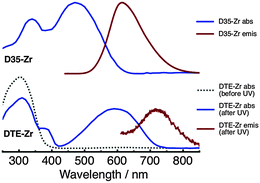
Absorption and emission spectra of D35-Zr and DTE-Zr are shown in Fig. 2. The DTE-Zr spectra include those obtained before and after UV irradiation (λirr = 365 nm). For D35-Zr, the D35 dye's S1 ← S0 absorption band has a maximum at 470 nm, with excitation at 440 nm yielding an emission band with a maximum at 610 nm.29 We have previously estimated the D35 fluorescence quantum yield (ΦR) on zirconia to be 0.41.29 For DTE-Zr, before UV irradiation only o-DTE is present, with an S1 ← S0 absorption band maximum located at 300 nm. UV irradiation for 40 s leads to the appearance of a new absorption band with a maximum at 590 nm, assigned to the S1 ← S0 absorption of c-DTE, which is produced from the photoisomerisation of o-DTE induced by UV light. UV irradiation for 40 s is sufficient to drive the c-DTE population to a photostationary state. It is predicted that essentially all the o-DTE is converted to c-DTE at the photostationary state (see ESI†). Although 560 nm excitation of c-DTE yields an emission band with a maximum at 720 nm, its intensity is extremely weak, consistent with previous findings that analogous dithienylethenes are basically non-fluorescent.1
Absorption and emission spectra of D35 + DTE-Zr are shown in Fig. 3. Before UV irradiation, D35 is the only species present that absorbs visible light. However, following UV irradiation for 5 s, the c-DTE absorption band also appears in the visible region. The c-DTE absorption band further increases in intensity after UV irradiation for 40 s. Before UV irradiation, 440 nm light primarily excites D35, rather than the DTE isomers, yielding the D35 emission band. After UV irradiation for 5 s and 40 s, excitation at 440 nm again produces the D35 emission band, but now with its integrated intensity reduced by ∼70% and ∼95%, respectively. This effect arises because the dyes are in close proximity to one another on the NP surface and the D35 emission band overlaps the c-DTE absorption band. This results in D35 → c-DTE FRET and radiative energy transfer, with the former contributing to D35 excited state deactivation. From the individual dyes' spectroscopic parameters we estimate the D35 + c-DTE Förster distance to be 3.9 nm (see ESI†). By varying the UV exposure time, we can tune the number of c-DTE acceptors surrounding a D35 donor to control the FRET rate and lower ΦR.
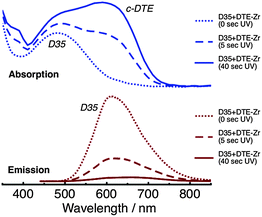 | ||
| Fig. 3 Absorption (top panel) and emission (bottom panel, λex = 440 nm) spectra of the D35 + DTE-Zr sample, before and after UV irradiation. | ||
To investigate the photophysics of D35 in the samples, we recorded time-resolved fluorescence decay curves using 532 nm excitation and monitoring emission over the 580–630 nm range. The fluorescence decay curves are fitted using a stretched exponential function to yield an averaged excited-state lifetime (τD35), which is then used to estimate the FRET quantum yield (ΦFRET) (see ESI†). The fluorescence decay curves of D35 for D35 + DTE-Zr are shown in Fig. 4, with the derived parameters given in Table 1. For D35 + DTE-Zr, before UV irradiation we obtain τD35 = 1.08 ns, a value very similar to that of D35-Zr (see ESI†). This lifetime reflects the relaxation of D35 through fluorescence and internal conversion. After UV irradiation for 5 s and 40 s, the fluorescence decays more rapidly due to introduction of the D35 → c-DTE FRET relaxation channel, with τD35 = 0.58 ns and 0.27 ns, respectively, translating to ΦFRET = 0.46 and 0.75, respectively.
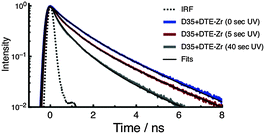 | ||
| Fig. 4 Fluorescence decay curves of D35 for the D35 + DTE-Zr sample. The decays are recorded before and after UV irradiation. | ||
| Sample | τ D35 (ns) | Φ FRET | Φ inj | k c→o (s−1) |
|---|---|---|---|---|
| a Error ± 0.05 ns. b Error ± 0.05. c Error ± 0.07. d Error ± 1 × 10⁻⁴ s−1. e Error ± 2 × 10⁻⁴ s−1. | ||||
| D35 + DTE-Zr | ||||
| 0 s UV | 1.08a | |||
| 5 s UV | 0.58a | 0.46b | ||
| 40 s UV | 0.27a | 0.75b | ||
| λ irr = 440 nm | 5 × 10⁻⁴![[thin space (1/6-em)]](https://www.rsc.org/images/entities/char_2009.gif) d d |
|||
| λ irr = 560 nm | 6 × 10⁻⁴![[thin space (1/6-em)]](https://www.rsc.org/images/entities/char_2009.gif) d d |
|||
| D35 + DTE-Ti | ||||
| 0 s UV | 0.12a | 0.89b | ||
| 5 s UV | 0.09c | 0.81c | ||
| 40 s UV | 0.25c | 0.66c | ||
| λ irr = 440 nm | 10 × 10−4![[thin space (1/6-em)]](https://www.rsc.org/images/entities/char_2009.gif) e e |
|||
| λ irr = 560 nm | 14 × 10−4![[thin space (1/6-em)]](https://www.rsc.org/images/entities/char_2009.gif) e e |
|||
The zirconia NP data presented above establish that o-DTE → c-DTE photoswitching introduces a FRET decay channel that reduces the proportion of excited D35 decaying by fluorescence. Therefore, by assembling the D35 and DTE dyes on titania NPs, it should be feasible to exploit the photochromic FRET mechanism to lower the D35 dye's electron injection efficiency.
Absorption and emission spectra of D35 + DTE-Ti are shown in Fig. 5. The absorption spectra are reasonably similar in appearance to D35 + DTE-Zr. The key differences are the onset of the titania band gap absorption at ∼400 nm, the slight broadening of the dyes' absorption bands, which is believed to be due to coupling between the dyes' molecular orbitals and titania conduction band, and the c-DTE:D35 absorption band intensity ratio being slightly lower at the photostationary state. The intensity of the emission from D35 on titania is substantially less than on zirconia, due to deactivation of D35 through electron injection. For D35 + DTE-Ti, after UV irradiation for 5 s and 40 s, the D35 integrated emission is reduced by ∼45% and ∼75%, respectively, due to the photochromic FRET. Radiative energy transfer is believed to cause the UV-induced red-shifting of the D35 emission band maximum.
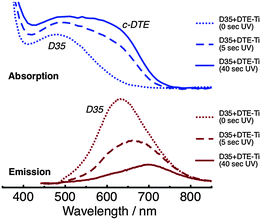 | ||
| Fig. 5 Absorption (top panel) and emission (bottom panel, λex = 440 nm) spectra of the D35 + DTE-Ti sample, before and after UV irradiation. | ||
The fluorescence decay curves of D35 for D35 + DTE-Ti are shown in Fig. 6, with the derived parameters given in Table 1. Before UV irradiation, the fluorescence decay is very rapid, with an estimated τD35 = 0.12 ns, essentially identical to that measured for D35-Ti. By using the τD35 values obtained on the insulating zirconia and injecting titania surfaces, we arrive at a D35 electron injection quantum yield (Φinj) of 0.89 (see ESI†), highlighting the efficiency of the electron transfer process. Because the fluorescence decay curve is close to the instrument response function (IRF) limit, the derived Φinj should be treated as a rough estimate. The fluorescence decay curves obtained after UV irradiation become very close to the IRF limit, making τD35 estimates impossible, but further support the presence of D35 → c-DTE FRET.
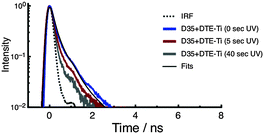 | ||
| Fig. 6 Fluorescence decay curves of D35 for the D35 + DTE-Ti sample. The decays are recorded before and after UV irradiation. | ||
To understand the extent to which FRET modulates the D35 electron injection within D35 + DTE-Ti we assume the zirconia-based FRET rates are identical for titania (UV 5 s and 40 s: kFRET = 0.8 ns−1 and 2.7 ns−1), in combination with the electron injection rate (kinj = 7.1 ns−1) and relaxation rate by fluorescence and internal conversion (kR+IC = 0.9 ns−1). All these photophysical pathways compete with one another to deactivate electronically excited D35 molecules. Before UV irradiation, Φinj = 0.89. After UV irradiation for 5 s and 40 s, Φinj = 0.81 and 0.66, respectively. This occurs in conjunction with FRET becoming activated, with ΦFRET = 0.09 and 0.25, respectively. Therefore, despite electron injection being the dominant decay channel for excited D35, by switching on the FRET channel, Φinj can be decreased by up to 26%.
In assessing how the photochromic FRET scheme controls the number of electrons injected into the titania NP, the Φinj of c-DTE must also be considered, as c-DTE is excited both directly and by FRET. The excited-state lifetime of c-DTE (τDTE) is too short to be studied with our fluorescence set-up. However, Dworak et al. have used transient absorption spectroscopy to measure τDTE = 0.28 ps and 0.21 ps for c-DTE in solution and attached to titania NPs, respectively.9 Using these values we arrive at Φinj = 0.25, which is substantially lower than that of D35, due to rapid relaxation of excited c-DTE back to its ground state by internal conversion. Taking the above Φinj and ΦFRET parameters for D35 + DTE-Ti and the c-DTE-induced increase in absorption at 440 nm, we estimate that the photochromic FRET mechanism can decrease the overall number of electrons injected into the titania conduction band by up to 9%. A possible avenue to enhance this difference may lie in employing surface binding motifs that insulate the photochrome from electron injection.9
Because c-DTE is inherently excited when probing D35 within the UV-treated samples, photoisomerisation to o-DTE occurs, slowly diminishing the number of available FRET acceptors and causing Φinj to move back towards its original value. While the sensitivity of our spectroscopic measurements enable the FRET conditions to remain effectively constant over the data acquisition period, exciting the samples over much longer timescales allows us to probe the c-DTE → o-DTE dynamics. Solution-phase studies of DTE (without the carboxylic acid binding group) have found that the photoisomerisation quantum yield is much greater for ring-closing (Φo→c = 0.59) than for ring-opening (Φc→o = 0.01).30
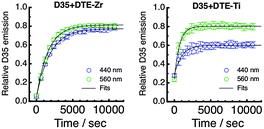
Following UV irradiation for 40 s, we have irradiated D35 + DTE-Zr and D35 + DTE-Ti either at 440 nm or 560 nm, periodically monitoring the D35 emission band's integrated intensity (λex = 440 nm). Irradiation at 440 nm mainly involves c-DTE being excited via FRET, whereas irradiation at 560 nm mainly involves c-DTE being directly excited. The kinetic plots obtained under our excitation conditions are shown in Fig. 7, with the recovery of the emission fitted using a single exponential function (see ESI†) to yield the photoisomerisation rates (kc→o) shown in Table 1. Continued visible irradiation does not return the emission back to its initial value, most likely due to formation of a non-switchable, coloured, by-product of DTE.1
The kinetic plots show that the D35 emission returns to ∼80% of its initial value for all cases except 440 nm irradiation of D35 + DTE-Ti, where it only reaches ∼60%. This is believed to be due to the o-DTE absorption band broadening on titania, resulting in non-negligible excitation at 440 nm, which influences the photostationary state. The kc→o values suggest that isomerisation is faster on titania than zirconia. It was anticipated that the titania sample would exhibit slower rates, considering ΦFRET is much lower and c-DTE electron injection competes with photoisomerisation. However, the opposite trend is observed, pointing to electron injection triggering c-DTE+ → o-DTE+ isomerisation, an effect previously observed for dithienylethenes upon oxidation.1,28,31,32 Additionally, by alternating between UV and visible light treatments, the D35 emission (and hence electron injection on titania) can be modulated over several o-DTE ↔ c-DTE cycles, although fatigue effects are prevalent (see ESI†).
In summary, we have performed a proof-of-principle study demonstrating photochromic control over electron injection within dye-sensitised titania NPs. This ability stems from the isomeric state of the DTE dye either enabling or disabling a FRET channel that competes with the electron injection channel in deactivating the excited D35 dye. This design concept offers a new approach towards generating switchable electronic and photochemical devices.
Acknowledgements
V. D. acknowledges an Australian Renewable Energy Agency Postdoctoral Fellowship (6-F004) and support from the University of Melbourne's Early Career Researcher Grant Scheme. G. V. acknowledges the Australian Research Council for the Australian Research Fellowship (DP1095404) support.References
- M. Irie, T. Fukaminato, K. Matsuda and S. Kobatake, Chem. Rev., 2014, 114, 12174–12277 CrossRef CAS PubMed.
- R. Klajn, Chem. Soc. Rev., 2014, 43, 148–184 RSC.
- M.-M. Russew and S. Hecht, Adv. Mater., 2010, 22, 3348–3360 CrossRef CAS PubMed.
- G. Vamvounis and N. Sandery, Aust. J. Chem., 2015, 68, 1723–1726 CrossRef CAS.
- V. Dryza, T. A. Smith and E. J. Bieske, Phys. Chem. Chem. Phys., 2016, 18, 5095–5098 RSC.
- W. R. Browne and B. L. Feringa, Annu. Rev. Phys. Chem., 2009, 60, 407–428 CrossRef CAS PubMed.
- R. Klajn, J. F. Stoddart and B. A. Grzybowski, Chem. Soc. Rev., 2010, 39, 2203–2237 RSC.
- S. Remy, S. M. Shah, C. Martini, G. Poize, O. Margeat, A. Heynderickx, J. Ackermann and F. Fages, Dyes Pigm., 2011, 89, 266–270 CrossRef CAS.
- L. Dworak, M. Zastrow, G. Zeyat, K. Rück-Braun and J. Wachtveitl, J. Phys.: Condens. Matter, 2012, 24, 394007 CrossRef PubMed.
- W. Wu, J. Wang, Z. Zheng, Y. Hu, J. Jin, Q. Zhang and J. Hua, Sci. Rep., 2015, 5, 8592 CrossRef CAS PubMed.
- V. Dryza and E. J. Bieske, J. Phys. Chem. C, 2015, 119, 14076–14084 CAS.
- K. J. Chen, A. Charaf-Eddin, B. Selvam, F. Boucher, A. D. Laurent and D. Jacquemin, J. Phys. Chem. C, 2015, 119, 3684–3696 CAS.
- L. Dworak, A. J. Reuss, M. Zastrow, K. Ruck-Braun and J. Wachtveitl, Nanoscale, 2014, 6, 14200–14203 RSC.
- K. Ouhenia-Ouadahi, R. Yasukuni, P. Yu, G. Laurent, C. Pavageau, J. Grand, J. Guerin, A. Leaustic, N. Felidj, J. Aubard, K. Nakatani and R. Métivier, Chem. Commun., 2014, 50, 7299–7302 RSC.
- F. M. Raymo and M. Tomasulo, Chem. Soc. Rev., 2005, 34, 327–336 RSC.
- J. Fölling, S. Polyakova, V. Belov, A. van Blaaderen, M. Bossi and S. W. Hell, Small, 2008, 4, 134–142 CrossRef PubMed.
- C. Yun, J. You, J. Kim, J. Huh and E. Kim, J. Photochem. Photobiol., C, 2009, 10, 111–129 CrossRef CAS.
- J.-C. Boyer, C.-J. Carling, B. D. Gates and N. R. Branda, J. Am. Chem. Soc., 2010, 132, 15766–15772 CrossRef CAS PubMed.
- J. M. Endtner, F. Effenberger, A. Hartschuh and H. Port, J. Am. Chem. Soc., 2000, 122, 3037–3046 CrossRef CAS.
- P. A. Liddell, G. Kodis, A. L. Moore, T. A. Moore and D. Gust, J. Am. Chem. Soc., 2002, 124, 7668–7669 CrossRef CAS PubMed.
- X. Cui, J. Zhao, Y. Zhou, J. Ma and Y. Zhao, J. Am. Chem. Soc., 2014, 136, 9256–9259 CrossRef CAS PubMed.
- L. Hou, X. Zhang, T. C. Pijper, W. R. Browne and B. L. Feringa, J. Am. Chem. Soc., 2014, 136, 910–913 CrossRef CAS PubMed.
- J. Park, D. Feng, S. Yuan and H.-C. Zhou, Angew. Chem., Int. Ed., 2015, 54, 430–435 CrossRef CAS PubMed.
- A. Hagfeldt, G. Boschloo, L. Sun, L. Kloo and H. Pettersson, Chem. Rev., 2010, 110, 6595–6663 CrossRef CAS PubMed.
- X. Zhang, T. Peng and S. Song, J. Mater. Chem. A, 2016, 4, 2365–2402 CAS.
- X. Jiang, K. M. Karlsson, E. Gabrielsson, E. M. J. Johansson, M. Quintana, M. Karlsson, L. Sun, G. Boschloo and A. Hagfeldt, Adv. Funct. Mater., 2011, 21, 2944–2952 CrossRef CAS.
- V. Dryza and E. J. Bieske, J. Photochem. Photobiol., A, 2015, 302, 35–41 CrossRef CAS.
- W. R. Browne, J. J. D. de Jong, T. Kudernac, M. Walko, L. N. Lucas, K. Uchida, J. H. van Esch and B. L. Feringa, Chem. – Eur. J., 2005, 11, 6414–6429 CrossRef CAS PubMed.
- V. Dryza and E. J. Bieske, J. Phys. Chem. C, 2014, 118, 19646–19654 CAS.
- M. Irie, T. Lifka, S. Kobatake and N. Kato, J. Am. Chem. Soc., 2000, 122, 4871–4876 CrossRef CAS.
- A. Peters and N. R. Branda, J. Am. Chem. Soc., 2003, 125, 3404–3405 CrossRef CAS PubMed.
- S. Lee, Y. You, K. Ohkubo, S. Fukuzumi and W. Nam, Angew. Chem., Int. Ed., 2012, 51, 13154–13158 CrossRef CAS PubMed.
Footnote |
| † Electronic supplementary information (ESI) available: Experimental procedure and additional results. See DOI: 10.1039/c6tc01584k |
| This journal is © The Royal Society of Chemistry 2016 |

