 Open Access Article
Creative Commons Attribution 3.0 Unported Licence
Dipolar glass and magneto-electric coupling within a π-stacked organic system†
Adam
Berlie
*abcd,
Ian
Terry
e,
Yun
Liu
a and
Marek
Szablewski
e
aResearch School of Chemistry, The Australian National University, Canberra, 2601, Australia
bThe Bragg Institute, Australian Nuclear Science and Technology Organisation, New Illawarra Road, Lucas Heights, NSW 2232, Australia
cISIS Neutron and Muon Source, Science and Technology Facility Council, Harwell Oxford, Oxfordshire, OX11 0QX, UK. E-mail: adam.berlie@stfc.ac.uk
dRIKEN Nishina Center for Accelerator-Based Science, 2-1 Hirosawa, Wako, Saitama 351-0198, Japan
eThe Department of Physics, Durham University, South Road, Durham, DH1 3LE, UK
First published on 2nd June 2016
Abstract
There is much interest in the search for novel materials that show ferroelectric as well as magneto-electric coupling, such as that observed in multiferroics. Within organic based materials the electronic polarisation can originate from a charge distribution across a molecule or molecules, and so one must search for systems that have an electronic (and magnetic) dipole that is intrinsic. One such material is tetraethylammonium bis-7,7,8,8-tetracyanoquinodimethane (TEA(TCNQ)2) which is a charge transfer system with a single electron that is delocalised across a TCNQ dimer. We show that dielectric measurements yield anomalies at the cation freezing structural distortion and when singlet–triplet excitations freeze. In both cases the electric response is glassy and at low temperature the corresponding magnetic measurements evidence the strong magneto-electric coupling within the material showing scaling behaviour similar to spin glass systems.
1 Introduction
Pure organic systems have a great advantage over their inorganic or oxide counterparts in that organic molecules can be easily modified via simple chemical substitutions which can lead to dramatic changes of their properties. Therefore, there is a drive to gain a fundamental understanding of these materials to enhance their technological potential. The ferroelectric behaviour in various organic based samples is due to the polarisability of electron density across molecules, rather than displacements of charged species within the unit cell as is common in inorganic oxides,1,2 which then leads to a change in polarisability. Thus the search for high performance organic ferroelectrics is exceptionally challenging yet vibrant.3 Within inorganic systems there are many examples of ferroelectric materials displaying glassy interactions between electronic dipoles leading to a relaxor ferroelectric state.4,5 However this can be due to impurities or from doping. Organic materials tend to be cleaner, as crystallisation reduces the level of impurities, and thus any glassy relaxation will often be due to a different mechanism to those observed in inorganic materials. Recent reports have shown that cluster glass type behaviour within organic samples can be observed where there is charge frustration that originates from a triangular lattice of electronic states.6Magneto-electric (ME) coupling is a good indication of multiferroic behaviour where recent work on κ-(BEDT-TTF)2 Cu[N(CN)2]Cl (denoted κ-Cl and where BEDT-TTF is bis(ethylenedithio)tetrathiafulvalene), the structure of which comprises of layers of BEDT-TTF cations that undergo antiferromagnetic ordering at 23 K,7 displaying coupling of the magnetism and electronic charge states.8 This is achieved through a freezing of electron density across a molecular dimer within these layers and a coupling through the triangular lattice. MEM(TCNQ)2 (MEM = N-methyl-N-ethylmorpholinium) also shows an anomaly in the dielectric constant (at 9 GHz) at the spin-Peierls transition,9 however no data is available on the frequency dependence. In order to investigate other systems, similar or not, for the potential to show ME coupling, one must consider samples that show strong magnetic interactions between anions; here we consider the charge-transfer salt tetraethylammonium bis-7,7,8,8-tetracyanoquinodimethane (TEA(TCNQ)2), which seems to be an ideal model system.
TEA(TCNQ)2 shows TCNQ stacking along the b-direction (see Fig. 1) where the TCNQ stacks are in sets of 4 (denoted BAA′B′ with an inversion centre between the A and A′ molecules),10 thus creating favourable tetramerisation where a single electron is delocalised across a TCNQ dimer.10,11 As the temperature decreases, there is a gradual increase in the tetramerisation of the TCNQ units along the stack. The TEA cations fluctuate between two different configurations within the crystal structure and at 220 K, they freeze into a disordered state10,12–14 that also effects the TCNQ stack and each dimer behaves as an S = 1/2 entity. The magnetism is dominated by singlet–triplet excitations and this crossover temperature is from ∼120 K. (This transition is from herein denoted as TST), the system shows strong antiferromagnetic coupling (i.e. a singlet state is formed) between the BAA′B′ dimers.13,16,17 One interesting feature of the TCNQ dimer is that the single electronic charge is split across the molecular unit unevenly over the temperature range from 395 to 110 K.10,18 As the temperature increases (T > 345 K) one may expect this charge distribution to become equal. However, at 295 K it is split at qA/e = 0.58 and qB/e = 0.42 (qA and qB denote the charge on the A and B TCNQ molecule respectively and e is the elementary charge) and is most pronounced at 110 K where qA/e = 0.72 and qB/e = 0.28. Consequently this provides much encouragement, as the search for organic ferroelectrics hinges on a polarisation of electron density across a molecule and as such within TEA(TCNQ)2 this may be intrinsic across the TCNQ dimers. Thus this warrants further investigation in order to determine whether there is evidence for ferroelectric behaviour and ME coupling within this material, and whether these strongly interacting TCNQ based systems may be a good model to pursue with regards to novel ferroelectric or even multiferroic samples. Within this work we show dielectric measurements on TEA(TCNQ)2 that display features at both the cation freezing and singlet–triplet transitions. In both cases there is a strong frequency dependence which can be explained by a glassy dipolar state which at low temperatures is coupled with singlet–triplet excitations.
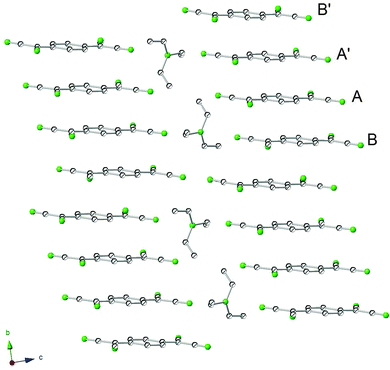 | ||
| Fig. 1 Crystal structure of TEA(TCNQ)2 showing the inherent tetramerisation and stacking of the TCNQ molecules along the b-axis at room temperature. Note that this shows the average structure as below 220 K, there is a freezing of the TEA cations into one of two positions refined in ref. 15. | ||
2 Experimental methods
The samples were prepared using a method detailed by Melby et al.19and were in the form of long purple/black needles of the order of a few millimetres in length. Dielectric measurements were performed using an Agilent E4980A Precision LCR meter where the sample (approximately 3 mm length) was mounted on a gold capacitor circuit evaporated onto a piece of sapphire (see ESI†). One must bear in mind therefore, that the capacitance will include that of the substrate and contacts, however, a background scan showed this contribution to be negligible and so the circuit can be considered to be a single resistor and capacitor in parallel. From the experiment both the capacitance and loss can be measured, which is a measure of the real and imaginary part of the dielectric constant. The capacitance is a measure of the dynamics of the polarisability of the sample, and the loss measures the phase shift of the impedance of the electronic polarisability to the applied AC field. Therefore, when the electric dipole moments can no longer keep up with the oscillating field, this will feature as a component within the loss. Note that although the capacitance (C) and loss could be measured, the area of the sample is unknown as there is no well defined cross-sectional area of the crystal; because of this one cannot calculate the dielectric constant. This should however not effect the conclusions from our measurements since | (1) |
3 Results and discussion
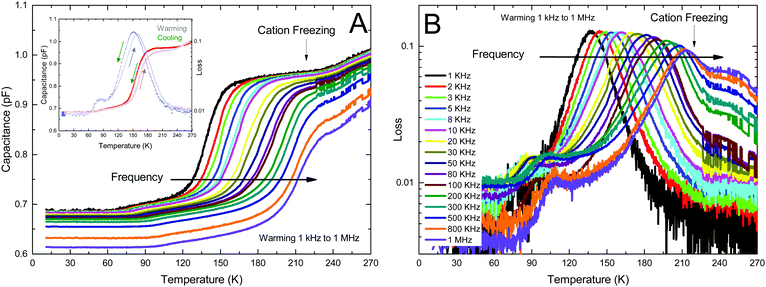
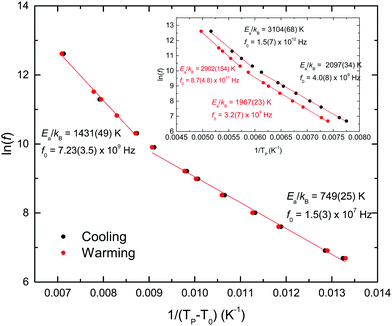
The raw data are shown in Fig. 2 and clear anomalies at approximately 220 and 100 K are observed in both C (Fig. 2A) and the loss (Fig. 2B). The dielectric experiments measure changes of the electronic polarisation within the sample as a function of frequency and so every change in the data corresponds to the sample undergoing a change related to the electronic polarisation within material. Below 60 K the response is flat and this includes a background contribution. There is a strong frequency dependence at both anomalies, which can be a clear indication of some glassy or relaxor type behaviour related to the electric dipole interactions.22 The warming and cooling data taken at 10 kHz shows hysteretic behaviour at the high temperature transition (220 K) that could point towards two possible scenarios; the first is that the transition is first order in nature, i.e. a pure structural distortion, and the second is that the relaxor/glassy nature of the sample dominates, as the relaxation time diverges. The structural study by Filhol and Thomas10 showed no evidence of a sudden change in the lattice parameters that would indicate a first order transition and since the cooling and warming rates were different, it may be that the latter, glassy scenario, is more likely. Within the loss, the behaviour at high frequencies (T > 240 K) is likely due to the sample being semiconducting or metallic above this cation freezing transition. As an estimate to gain the magnitude of the dielectric constant,23,24 the crystal dimensions could be approximated as 3 × 0.5 × 0.2 mm in length. This results in a permittivity of 2.4 × 10³, if one assumes a capacitance of 0.7 pF, which is a fairly large value but is in agreement with what is expected for a ferroelectric, although an order of magnitude lower than that of a colossal permittivity material.25Although both anomalies be will considered, we will firstly discuss the frequency dependent behaviour at ∼220 K. As mentioned previously, there is some form of hysteretic behaviour associated with the transition and so when taking the temperature of the maximum of the peak (TP) within the loss, two values will be obtained corresponding to heating and cooling of the sample. Using the Arrhenius equation, it is possible to analyse the data to obtain a value for the energy gap associated with the statistical population of the excited and ground states. A plot of ln(f) vs. 1/Tmax was made (see inset to Fig. 3) and within the plot there are two clearly different regimes with a difference in slopes that occur between 20 kHz and 30 kHz. Fitting to the data provides unreasonable values for the activation energy (Ea) and nominal time scale of the fluctuations/attempt frequency (f0), as shown in the inset of Fig. 3. Instead a better model is the Vogel–Fulcher law (VF);
 | (2) |
At ln(f) ≈ 10 or f ≈ 22 kHz, there is a definite change in slope shown clearly in Fig. 3. This change in slope may be due to the fact that the measurements are sensitive to different relaxations or processes, although the two processes are likely to be related. Measures of energy gap associated with the transition are of the order of ∼2000 K,21,27 therefore one may allocate the high frequency (f > 20 kHz) behaviour to the increasing interactions within the TCNQ stacks. The difference may be due to the different time scales of measurements. The process with an Ea = 749 K from our measurements may therefore be due to the ordering of the TEA cations at ∼210 K. The lower energy associated with the cation freezing again supports the idea that the structural distortion may be due to the freezing of the cations which in turn causes the interactions between TCNQ dimers and tetramers to increase leading to a strongly coupled Mott state.13
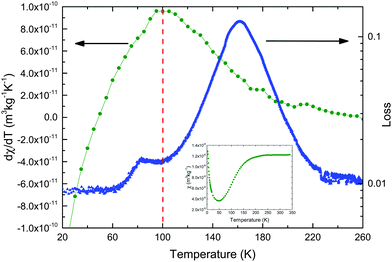
The magnetism of TEA(TCNQ)2 has been previously studied where there is a gradual tetramerisation of the TCNQ units below 250 K,17 which is also seen in our data (see inset to Fig. 4). When differentiating the magnetic susceptibility data one finds the steepest part of the slope is approximately 100 K which can be considered to be where the singlet–triplet excitations freeze out and the system is locked into a singlet ground state. This transition matches well with the low temperature features seen in the C and loss data for the sample. This is demonstrated in Fig. 4, where the loss and differentiated susceptibility of the sample are compared and there is a definite correlation between the two datasets. Ultimately this means that the magnetic transition is coupled to the electronic polarisation and the magnetic ordering may trigger an electric dipole ordering.
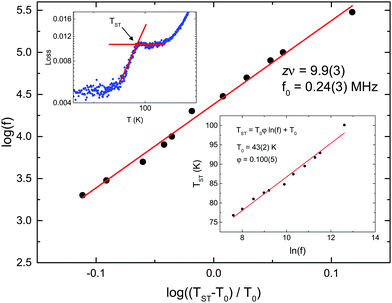
The frequency dependence of the peak within the loss can be analysed in a similar manner to the cation freezing distortion above. Note that TST, the temperature associated with the condensing of the system into the singlet phase, was from the loss data and defined as the intersection of two straight lines as shown in the upper inset of Fig. 5. The strong frequency dependence and the unreasonable fitting parameters from the Arrhenius behaviour (see ESI†) points to a more glassy or relaxor state. One must therefore use the VF law to describe the data (see ESI†). In order to calculate a reasonable value for T0 the frequency dependence of the peak was plotted as it tends to f = 0 (see the lower inset of Fig. 5) where T0 = 43(2) K. Using the Mydosh criterion one can look at the frequency dependence of the transition where ϕ = 0.1, which is, for the spin glass analogue, similar to cluster glasses or super spin glasses.28 Within TEA(TCNQ)2 the sample may undergo a transition where the electric dipoles order in local clustered regions. For the VF analysis it was found that the best fits to the data produced values for Ea/kB and f0 of 423 K and 4.8 × 10⁸ Hz respectively. Therefore these represent the energy scale required for an excitation from the ground state, but since both the magnetic and electrical behaviour is coupled, a perturbation in one causes a perturbation in the other.
Since there are strong analogies between dipolar and spin glasses, it is worth attempting further analysis of the anomaly in the dielectric loss associated with singlet–triplet transition. One model used within spin glasses is critical scaling behaviour,28 described by
 | (3) |
Both the cation freezing and singlet–triplet (ST) crossovers are observed in the dielectric data and as mentioned above this implies that in the case of the ST transition, the magnetic and electronic polarisation are strongly coupled. This is evidence that the sample behaves similarly to κ-Cl,8 which is a multiferroic at low temperatures. The multiferroic behaviour in κ-Cl is dominated by a freezing of electric dipoles across a cationic BEDT-TTF dimer (each BEDT-TTF is an electron donor). The TCNQ dimers within our sample, behave in an opposite manner and are the electron acceptors. Although charge-ordering is common within low dimensional charge transfer salts31 this can manifest as differences in critical and ferroelectric transition temperatures. Therefore within TEA(TCNQ)2, since a charge difference exists across the TCNQ dimers that results in an electric dipole, which may be able to fluctuate and be polarisable even below the temperature at which the TEA cation configuration freezes. Since the P![[1 with combining macron]](https://www.rsc.org/images/entities/char_0031_0304.gif) space group contains an inversion centre, this may simply represent a spatially averaged structure and one interpretation of the dipolar ordering could come from the local regions where the freezing of the TEA cations produces a static disorder, where the inversion symmetry of the average structure could be broken. At TST the magnetic exchange between TCNQ dimers may cause a freezing of the magnetic moments and the system enters a quasi-static state. This in turn causes a freezing or locking of the fluctuations of the electronic dipole moments across the TCNQ dimers. This leads to static electric dipole due to the inequivalent electron density distribution across a TCNQ dimer and could lead to ferroelectric or multiferroic ordering.
space group contains an inversion centre, this may simply represent a spatially averaged structure and one interpretation of the dipolar ordering could come from the local regions where the freezing of the TEA cations produces a static disorder, where the inversion symmetry of the average structure could be broken. At TST the magnetic exchange between TCNQ dimers may cause a freezing of the magnetic moments and the system enters a quasi-static state. This in turn causes a freezing or locking of the fluctuations of the electronic dipole moments across the TCNQ dimers. This leads to static electric dipole due to the inequivalent electron density distribution across a TCNQ dimer and could lead to ferroelectric or multiferroic ordering.
4 Conclusion
To conclude, we have demonstrated anomalies within the C and loss data taken on a single crystal of TEA(TCNQ)2 which correspond to the onset of a cation freezing and of singlet–triple excitations. The dielectric data show a sensitivity to the high temperature cation freezing distortion where two different relaxation processes were separated; one due to the cation freezing and the other related to the opening of a pseudo-energy gap, which effects the conduction along the TCNQ stacks. At lower temperatures the features within the C and loss data are due to the onset of a singlet–triplet energy gap opening up resulting from correlations between S = 1/2 TCNQ dimers. On going through the magnetic transition the electric dipole ordering is observed to be glassy with analysis that shows similar characteristics to that of spin glasses. Therefore although the magnetism is considered to be in a frozen coupled state, this may not be the case for the electric dipoles until below TST where they freeze into a clustered arrangement.There is a lot of interest in the search for organic systems for technological applications and we have presented data for a material that highlights the applicability and potential of TCNQ based organic charge transfer salts in which there is a strong magneto-electric coupling. Hopefully the usefulness of these type of π-stacked systems has been highlighted when designing materials where a coupling between the magnetism and electrical properties is desirable, such as within multiferroics.
Acknowledgements
The authors thank Ray Withers for discussions/advice and Tony Willis for single crystal X-ray diffraction measurements. AB and YL would like to acknowledge funding from ARC discovery projects. AB would also like to acknowledge ANSTO for financial support and Durham University for access to equipment through his Visiting Associateship.References
- S. Horiuchi and Y. Tokura, Nat. Mater., 2008, 7, 357 CrossRef CAS PubMed
.
- D. A. Bonnell, Science, 2013, 339, 401 CrossRef CAS PubMed
.
- D.-W. Fu, H.-L. Cai, Y. Liu, Q. Ye, W. Zhang, Y. Zhang, X.-Y. Chen, G. Giovannetti, M. Capone, J. Li and R.-G. Xiong, Science, 2013, 339, 425 CrossRef CAS PubMed
.
- A. A. Bokov and Z.-G. Ye, J. Mater. Sci., 2006, 41, 31 CrossRef CAS
.
- R. A. Cowley, S. N. Gvasaliya, S. G. Lushinikov, B. Roessli and G. M. Rotaru, Adv. Phys., 2001, 60, 229 CrossRef
.
- F. Kagawa, T. Sato, K. Miyagawa, K. Kanoda, Y. Tokura, K. Koybayashi, R. Kumai and Y. Murakami, Nat. Phys., 2013, 9, 419 CrossRef CAS
.
- K. Miyagawa, A. Kawamoto, Y. Nakazawa and K. Kanoda, Phys. Rev. Lett., 1995, 75, 1174 CrossRef CAS PubMed
.
- P. Lunkenheimer, J. Muller, S. Krohns, F. Schrettle, A. Loidl, B. Hartman, R. Rommel, M. de Souza, C. Hotta, J. A. Schlueter and M. Lang, Nat. Mater., 2012, 11, 755 CrossRef CAS PubMed
.
- M. Poirier, M. de Lafontaine, C. Bourbonnais and J.-P. Pouget, Phys. Rev. B: Condens. Matter Mater. Phys., 2013, 88, 245134 CrossRef
.
- A. Filhol and M. Thomas, Acta Crystallogr., Sect. B: Struct. Sci., 1984, 40, 44 CrossRef
.
- H. Koybayashi and Y. Ohashi, Acta Crystallogr., Sect. B: Struct. Crystallogr. Cryst. Chem., 1970, 26, 459 CrossRef
.
- A. Brau, J.-P. Farges, A. Filhol and H. Grassi, Phys. Status Solidi B, 1983, 120, 547 CrossRef CAS
.
-
Organic Conductors: Fundamentals and Applications, ed. J.-P. Farges, CRC Press, New York, 1994 Search PubMed
.
- J. P. Travers, F. Devreux and M. Nechtschein, J. Phys., Colloq., 1983, 44, C3-1295 CrossRef
.
- A. Filhol, C. M. E. Zeyen, P. Chenavas, J. Gaultier and P. Delhaes, Acta Crystallogr., Sect. B: Struct. Crystallogr. Cryst. Chem., 1980, 36, 2719 CrossRef
.
- S. Flandrois, J. Amiell, F. Carmona and P. Delhaes, Solid State Commun., 1975, 17, 287 CrossRef CAS
.
- J. S. Pedersen and K. Caneiro, Rep. Prog. Phys., 1987, 50, 995 CrossRef
.
- J.-P. Farges, J. Phys., 1985, 46, 1249 CAS
.
- L. R. Melby, R. J. Harder, W. R. Hertler, W. Mahler, R. E. Benson and W. E. Mochel, J. Am. Chem. Soc., 1962, 84, 3374 CrossRef CAS
.
- V. Zelezny, J. L. Musfeldt and D. B. Tanner, Adv. Mater. Opt. Electron., 1996, 6, 353 CrossRef CAS
.
- A. Brau and J.-P. Farges, Phys. Status Solidi B, 1974, 61, 257 CrossRef CAS
.
-
Frontiers of ferroelectricity: a special issue of the journal of Materials science, ed. S. B. Lang and H. L. W. Chan, Springer Science and Business Media, 2007 Search PubMed
.
- J. P. Farges, A. Brau and F. Guttmann, J. Phys. Chem. Solids, 1972, 33, 1723 CrossRef CAS
.
- J. P. Farges and A. Brau, Phys. Status Solidi B, 1974, 61, 669 CrossRef CAS
.
- W. Hu, Y. Liu, R. L. Withers, T. J. Frankcombe, L. Norén, A. Snashall, M. Kitchin, P. Smith, B. Gong, H. Chen, J. Schiemer, F. Brink and J. Wong-Leung, Nat. Mater., 2013, 12, 821 CrossRef CAS PubMed
.
- K. B. Lyons, P. A. Fleury and D. Rytz, Phys. Rev. Lett., 1986, 57, 2207 CrossRef CAS PubMed
.
- J.-P. Farges, J. Phys., 1985, 46, 465 CAS
.
-
Spin Glasses: An Experimental Introduction, ed. J. A. Mydosh, Taylor and Francis, 1993 Search PubMed
.
- B. W. Lovett, S. J. Blundell, F. L. Pratt, T. Jestadt, W. Hayes, S. Tagaki and M. Kurmoo, Phys. Rev. B: Condens. Matter Mater. Phys., 2000, 61, 12241 CrossRef CAS
.
- J. Wu and C. Leighton, Phys. Rev. B: Condens. Matter Mater. Phys., 2003, 67, 174408 CrossRef
.
- F. Nad and P. Monceau, J. Phys. Soc. Jpn., 2006, 75, 051005 CrossRef
.
Footnote |
| † Electronic supplementary information (ESI) available. See DOI: 10.1039/c6tc01538g |
| This journal is © The Royal Society of Chemistry 2016 |

