
 Open Access Article
 This Open Access Article is licensed under a Creative Commons Attribution-Non Commercial 3.0 Unported Licence
Solvent-triggered relaxative spin state switching of [Fe(HB(pz)3)2] in a closed nano-confinement of NH2-MIL-101(Al)†
Tian
Zhao
a,
Ishtvan
Boldog
*a,
Vojislav
Spasojevic
b,
Aurelian
Rotaru
c,
Yann
Garcia
d and
Christoph
Janiak
*a
aInstitut für Anorganische Chemie und Strukturchemie, Universität Düsseldorf, D-40204 Düsseldorf, Germany. E-mail: ishtvan.boldog@gmail.com; janiak@uni-duesseldorf.de
bInstitute for Nuclear Sciences, P. O. Box 522, 11001 Beograd, Serbia
cDept. of Electrical Engineering and Computer Science & Research center MANSiD, Ştefan cel Mare Univ., University Street 13, 720229 Suceava, Romania
dInstitute of Condensed Matter and Nanosciences, Molecules, Solids and Reactivity (IMCN/MOST), Université catholique de Louvain, Place L. Pasteur 1, 1348 Louvain-la-Neuve, Belgium
First published on 9th June 2016
Abstract
The synthesis of the NH2-MIL-101(Al) Metal–Organic Framework (MOF) with bis(hydrotris(pyrazolyl)borato)iron(II), [Fe(HB(pz)3)2], added to the reaction medium yielded [Fe(HB(pz)3)2]@NH2-MIL101(Al) encapsulation products, denoted as S@Ms, in the course of a ‘bottle-around-the-ship’ assembly. [Fe(HB(pz)3)2] is a spin-crossover (SCO) compound with a gradual spin transition at 290–440 K for the bulk material (repeated cycles), associated with a pronounced colour change from the red low spin (LS) state to the white high-spin (HS) state. The identity of S@Ms, with a maximum loading of the iron complex at ∼11 wt% (0.16 molecules per Al3OL3 moiety), was confirmed by PXRD and spectroscopic measurements. The entrapped complex, which is stable in air and cannot be removed by vacuum drying, is confined in the cages of the framework. N2 and CO2 gas adsorption measurements on the dry S@M composite with different iron complex loadings confirm the absence of most of the initial NH2-MIL-101(Al) porosity. The S@M composite material demonstrates a gradual thermally induced transition from the red low-spin (LS) state to the light yellow HS state, associated with the colour of the matrix, chiefly over the range 300–450 K, which is close to the 290–440 K temperature range for [Fe(HB(pz)3)2]. The thermally induced HS form of S@M does not return to the LS upon cooling to room temperature, and the metastable HS form relaxes only very slowly, which becomes noticeable only after weeks of storage. Rapid and almost complete relaxation and decrease of magnetic moment for up to ∼97% of the whole sweep could be triggered by the addition of n-hexane, as evidenced by the change of colour and magnetic measurements. Via mechanical stress akin to the action of capillary forces, the adsorbed liquid effectively amplifies the otherwise very weak ‘matrix effect’ by increasing the effective local pressure imposed on the transiting molecules, thus favouring even further the LS state. The immersion of the dried composites into practically any typical solvents, including MeOH, DMSO, DMF, iPrOH, BuOH, t-BuOH, THF, ethylacetate, CH2Cl2, CHCl3 CCl4, toluene, mesitylene, and cyclohexane, also induces a spin state change, which is evidenced by the change of colour. The effect is fully reversible: the metastable HS state could be reinstated upon drying the sample at elevated temperature and subsequent cooling. The materials were thoroughly characterized by AAS, PXRD, gas sorption analysis, IR spectroscopy, magnetic measurements, and optical reflectivity measurements. Therefore, a novel MOF-based material with isolated SCO units is proposed, which demonstrates a salient relaxative ‘solvent assisted matrix-effect’ on metastable entrapped sites, potentially suitable for light-driven single-unit addressability.
Introduction
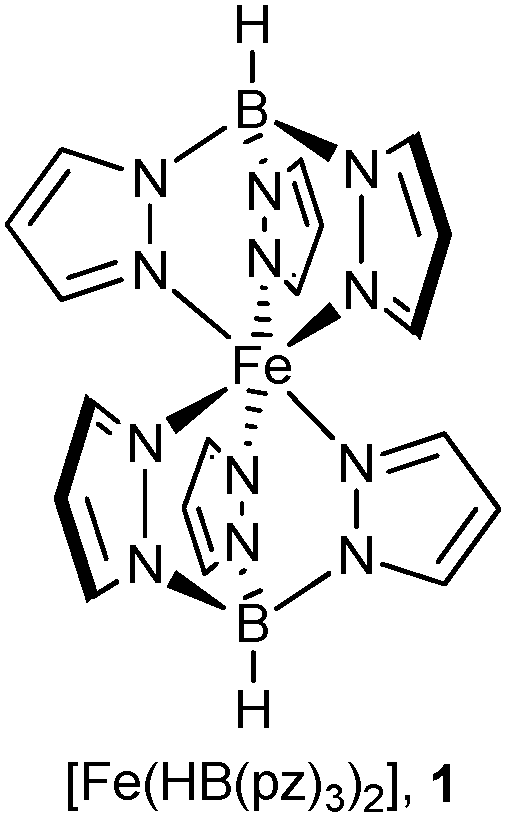
The spin-crossover (SCO) phenomenon1,2 is the switching of spin states in complexes of some first row transition metals, with d6-iron(II) (pseudo-)octahedral nitrogen-donor ligand complexes being the most studied examples.3 The reversible switching between the low- and high-spin states (LS ⇆ HS) is not only associated with a pronounced change of the magnetic state from diamagnetic to paramagnetic (1A1, S = 0 ⇆ 5T2, S = 2), but also with many other important physical parameters, including structural, vibrational,4 dielectric, and optical properties in most cases. The simplicity of the optical detection of the usual LS-red ⇆ HS-white transition and the associated magnetic changes for iron(II) SCO compounds stimulate the interest in potential information storage,5,6 display devices,2,6 and sensors.7–12The iron complexes of hydrotris(pyrazolyl)borato ligands exhibit such a SCO phenomenon between LS-red ⇆ HS-white states13–19 and the transition temperatures (T1/2) were found to vary strongly with the substituents on the pyrazolyl rings or on the boron atom.18,20 The interplay of the steric effects of substituents with different sizes of LS and HS Fe(II) ions was demonstrated to be the decisive factor in controlling the relative stability of the spin states.17,19 For the parent compound [Fe(HB(pz)3)2] (1, Fig. S1 in the ESI†) with unsubstituted pyrazolyl rings the transition temperature is T1/2 ∼ 410 K.21–23 This compound undergoes an irreversible transformation upon warming between a metastable tetragonal form in the LS state to a stable monoclinic form in the HS state.23
Triggering of SCO transition can be achieved by the change in temperature,24–26 pressure,27,28 and the magnetic field, irradiation with light (LIESST),29,30 or the action of a chemical agent (chemo-switching).31,32 Production of functional, individually addressable SCO units3,33 as small as possible is an important process actively researched in the area of SCO nanomaterials.34,35 Various methods for the synthesis of SCO nanoparticles36–38 and thin films39,40 including nanopatterned41 growth were successfully implemented, which also act as prototypical functional elements for nanodevices.42 One of the traditional problems in nanostructuration refer to the loss of abruptness in thermal- and pressure-induced SCO, which is associated with the reduction of cooperative effects, i.e., the reduced efficiency of elastic interactions in the solid-state, propagating the effect of structural changes during spin transition.43,44
An interesting alternative is to sacrifice entirely the traditional cooperativity for the possibility of embedding isolated molecular SCO entities in a regular matrix with a precise spatial placement and addressability. A transparent matrix, penetrable for small molecules, but encapsulating the SCO entities should allow light- and chemo-switching, also providing good mechanical protection. The effect of matrix confinement36 imposing additional elastic interactions between the host and the embedded object is well known for SCO nanoparticles, represented by either ‘soft’ matrices, such as organic polymers, e.g., polyvinylpyrrolidone (PVP)45 or chitosan,38 or ‘hard’ matrices, such as silica shells46 or in the form of various core–shell particles.33,34 Practically in all those cases the embedded objects are firmly adjoined to the surface of the matrix, completely isolating the SCO particles. Ship-in-the-bottle inclusion of mononuclear iron47 or cobalt48 SCO complexes in a principally rigid matrix, Y-zeolite, is among the few examples where isolative inclusion, i.e. with lowered interaction with the matrix, is observed for the molecular species, but not realized fully due to the small size of the pores. However, recently we have observed that in [Fe(Htrz)3](BF4)2·H2O@MCM-41 (Htrz = 4H-1,2,4-triazole) and [Fe(Htrz)2trz]BF4@MCM-41 (trz = 1,2,4-triazolato), the mesoporous zeolite matrix loosely surrounds the embedded 1D SCO polymer and can still transfer the confinement pressure through adsorbed water molecules as mediators, significantly altering the width of the hysteresis, the abruptness of the transition, and shifting the latter to higher temperatures.49
Guided by this finding we have chosen the micro-to-mesoporous NH2-MIL-101(Al) metal–organic framework (MOF) material as a stable, diamagnetic, optically transparent host,50 for the placement of the charge-neutral mononuclear SCO complex [Fe(HB(pz)3)2], 1, targeting a new SCO composite material, S@M, based on a rigid porous matrix with aimed loose placement of the functional entities.
Results and discussion
In-depth investigation of the possible confinement effect exerted by a MOF host on an encapsulated molecular SCO compound presumes optical and magnetic detection of the transition. The chosen host, NH2-MIL-101(Al), is colourless, diamagnetic and belongs to the MIL-101 family of highly porous materials. With the empirical formula [Al3(μ3-O)(NH2-bdc)3(OH)(H2O)2] it is known to have the same structure as the prototypal MIL-101(Cr), [Cr3(μ3-O)(bdc)3(F,OH)(H2O)2].50 The compound MIL-101(Cr), introduced by the group of Férey51 as Matériaux de l'Institut Lavoisier No. 101, has a pore volume of VPore = 2.0 cm3 g−1 and a very high internal surface area of SBET = 4100 ± 200 m2 g−1. NH2-MIL-101(Al) is characterized by similar remarkable thermal (stable up to 650 K) and chemical stability but somewhat lower porosity (SBET up to 2100 m2 g−1).50 The decrease of total pore volume as well as the apparent specific surface area for the modified NH2-MIL-101(Al) can partially be attributed to the increased steric demand of the amino group.52The MIL-101 framework is similar to an MTN zeolite topology. The building blocks are benzene-1,4-dicarboxylate ligands bridging M3(μ3-O) units, thereby forming trinuclear building units (SBUs) (see Fig. 1a). The trinuclear units represent vertices of supertetrahedra (Fig. 1b), which, via vertex sharing, constitute a three-dimensional network (Fig. 1c) with two types of mesoporous cages. In MIL-101(Cr) the small cage (Fig. 1d) has an inner diameter of 29 Å and only pentagonal windows. The half so frequent large cage (Fig. 1e) has an inner diameter of 34 Å and both pentagonal and hexagonal windows. The window openings (apertures) are 12 Å or 15–16 Å, respectively (Fig. 1f).51 The amino-functionalization of the terephthalate linkers should decrease the effective apertures. Small drug molecules, namely ibuprofen (Mw = 206) and indomethacin (Mw = 358), were successfully loaded in the pores of MIL-101(Cr)53 and NH2-MIL-101(Al).54 Soaking the evacuated samples in concentrated solutions allowed to reach loadings of 1.4 and 1.1 g of the drug per 1 g of MOF, which is equivalent to >10 molecules per small cage for both cases.
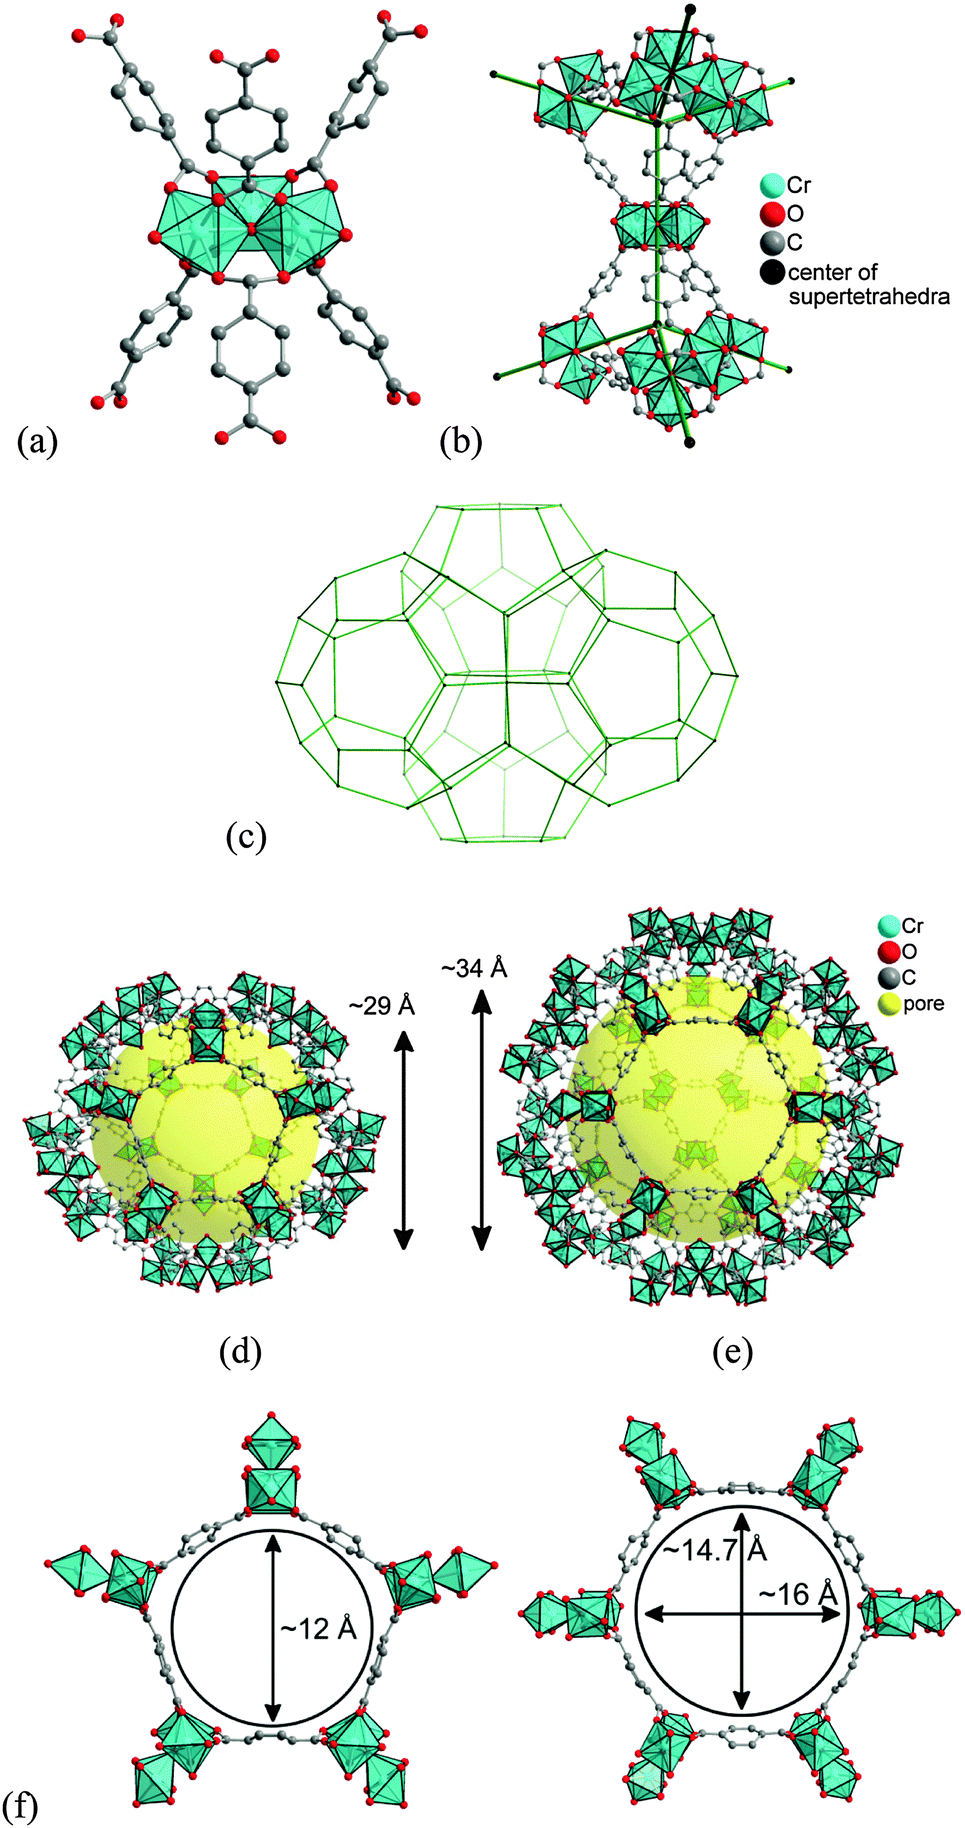 | ||
| Fig. 1 (a) Trinuclear {Cr3(μ3-O)(bdc)6(F,OH)(H2O)2} building unit; (b) supertetrahedra; (c) mesoporous network; (d) small cage with pentagonal windows; (e) large cage with pentagonal and hexagonal windows; and (f) dimensions of pentagonal and hexagonal cage window openings. Objects in (a) to (f) are not drawn to scale. Graphics have been created from the deposited cif-file for MIL-101Cr (CSD-Refcode OCUNAK)51 using the program DIAMOND.55 | ||
Synthesis, analytics and porosity characterization
The iron complex [Fe(HB(pz)3)2]20 (Mw = 481.9) is well-known to exhibit a SCO transition in the crystalline state in the 300–450 K range, i.e., conveniently above room temperature. The compound is volatile and starts to sublime slowly at 430 K, allowing to be vapour deposited to produce thin films, which can be useful for practical applications.56 The van der Waals dimensions of the molecule are 11.6 × 10.6 × 10.6 Å (Fig. S1 in the ESI†), which was expected to be small enough for entering the pores of the host NH2-MIL-101(Al). Surprisingly, the soaking of the evacuated MOF in a solution of [Fe(HB(pz)3)2] in dichloromethane at room temperature was not efficient, resulting in the reversible adsorption of the complex on the surface, which was possible to remove almost completely upon repeated rinsing with pure dichloromethane. Similarly, heating the evacuated MOF and [Fe(HB(pz)3)2] in a sealed ampoule (170 °C, 72 h) did yield a product with significant content of iron (over 7–8 wt%) in the cases of NH2-MIL-101(Al) or MIL-101(Cr) which was used as a model object, but unfortunately on-surface adsorption was observed chiefly.While the preliminary experiments did not refute entirely the possibility to introduce [Fe(HB(pz)3)2] via diffusion, we focused on the opportunity to incorporate the guest molecules during the synthesis of the MOF, which is allowed due to the mild conditions, viz. 130 °C in DMF (Scheme 1). The reaction mixture identical to the one used for the synthesis of NH2-MIL-101(Al), but with addition of [Fe(HB(pz)3)2], was wine-red in colour, according to the expected LS state of the iron compound.23 Heating to 130 °C caused gradual but complete disappearance of the red colour in accordance with the expected SCO at elevated temperature. The resulting yellow product, nearly indistinguishable from bulk NH2-MIL-101(Al), retained its colour after cooling down to room temperature and isolation by centrifugation, provided that the isolation steps were reasonably quick. If the synthesized compound was left in the mother solution at room temperature for days, the reddish colouration gradually reappeared. However, the most interesting feature of the synthesized material was observed during the synthetic step of washing of the freshly isolated yellowish solid by methanol. As a result, the material practically immediately changed its colour to red, i.e., a rapid HS → LS transition took place (see Fig. 8).
 | ||
| Scheme 1 Schematic drawing of the synthesis of NH2-MIL-101(Al) with the irreversible encapsulation of [Fe(HB(pz)3)2] (pink spheres stand for [Fe(HB(pz)3)2] molecules). This schematic picture should not imply that every cage is filled or that a cage is only filled with one molecule. | ||
Three samples, using the same method but different amounts of [Fe(HB(pz)3)2] starting material (50, 70 and 90 mg), were synthesized with the aim of checking the variation of loading of the SCO compound. Thorough washing procedures with acetone, dichloromethane and methanol ensured that no iron complex was left on the outside of the MOF particles, while the truly incorporated [Fe(HB(pz)3)2] remained inside. The washing procedure of the S@M samples, done with solvents, which dissolve the iron complex (dichloromethane is particularly good in this regard), was different from the procedure used for the bulk NH2-MIL-101(Al) as it intended only to remove the externally adsorbed iron complex. The approximated cylindrical size of the [Fe(HB(pz)3)2] complex (height ∼ 11.6 Å, diameter ∼ 10.6 Å see Fig. S1 in the ESI†) is probably slightly larger than the effective pore entrance for NH2-MIL-101(Al) with the amino groups on the terephthalate ligand (cf.Fig. 1). At least the closeness of the dimensions ensures that the diffusion of the molecules out of the cages is very slow. Hence, the Fe-complex molecules could practically not be washed out, even under the conditions of boiling the samples in MeOH and vacuum drying as part of the analytical sample preparation.
The inclusion of [Fe(HB(pz)3)2] in the pores of NH2-MIL-101(Al) was proven by the analysis of iron content, pore size analysis and by temperature- and solvent-adsorption induced magnetic and colour changes for the SCO transition.
| [Fe(HB(pz)3)2]@NH2-MIL-101(Al), S@M | [Fe(HB(pz)3)2]b (mg)/(mmol) | Al![[thin space (1/6-em)]](https://www.rsc.org/images/entities/char_2009.gif) :Fe (molar ratio)c :Fe (molar ratio)c |
Fe content by AASd (wt%) | Calc. [Fe(HB(pz)3)2] contente (wt%) | Al:Fe (molar ratio)f |
|---|---|---|---|---|---|
|
a Each sample was dried in the vacuum oven (120 °C, 12 mbar) for 2 h before AAS analysis.
b Amount of [Fe(HB(pz)3)2] used in S@M synthesis with 57 mg (0.24 mmol) of aluminium chloride hexahydrate (AlCl3·6H2O) and 61 mg (0.34 mmol) of 2-aminoterephthalic acid.
c Initial molar ratio of Al:Fe in the synthesis.
d Additional values from repeated, independent Fe analysis.
e Fe content in [Fe(HB(pz)3)2], C18H20B2N12Fe (481.91 g mol−1) is 11.59%.
f Molar ratio of Al:Fe in the S@M composite.
g Fe analysis after the samples were dried at 120 °C and <10−5 Torr for an additional 4 h.
h From EDX analysis with error (3 sigma) in parenthesis.
|
|||||
| S@M-1 | 50/0.10 | 1:0.43 |
0.61 | 5.26 | 1:0.028 |
| 0.62g | 5.35 | 1:0.028 |
|||
| 1:0.033(3)h |
|||||
| S@M-2 | 70/0.15 | 1:0.61 |
1.31 | 11.31 | 1:0.063 |
| 1.42 | |||||
| 1.29g | 11.13 | 1:0.062 |
|||
| S@M-3 | 90/0.19 | 1:0.78 |
1.18 | 10.18 | 1:0.056 |
| 1.09 | |||||
| 1.14g | 9.84 | 1:0.054 |
|||
It is evident that from the offered [Fe(HB(pz)3)2] amount during synthesis only about 10% or less is incorporated in the formed S@M composite when looking at the possible and the obtained molar Al:Fe ratio. When increasing the starting amount of [Fe(HB(pz)3)2] from 50 to 70 mg the incorporated Fe amount more than double, that is, S@M-2 contains 2.25-fold the [Fe(HB(pz)3)2] amount of S@M-1. A further attempted increase in the available [Fe(HB(pz)3)2] amount to 90 mg did not lead to increased Fe loading and S@M-3 contains even slightly less encapsulated iron compared to S@M-2. In a molar ratio S@M-2 corresponds to the formula {0.16[Fe(HB(pz)3)2]·[Al3(μ3-O)(NH2-bdc)3(OH)(H2O)2]}, S@M-1 and S@M-3 correspond to 0.07 and 0.14 Fe-complex molecules per Al3OL3 moiety respectively.
For a better understanding of the actually observed incorporation values, it is expedient to estimate the physically maximal loading, based on the comparison of molecular- and pore volumes. From the molecular dimensions of the molecule, approximated as a cylinder (Fig. S1b in the ESI†), the van-der-Waals surface limited molecular volume of 357 Å3 can be estimated (see the ESI†). On the other hand, the unit cell volume of 2158 Å3 of one of the single-crystal X-ray structures of [Fe(HB(pz)3)2] with Z = 4 (Refcode HPZBFE03)23 gives ∼540 Å3 volume per single [Fe(HB(pz)3)2] molecule at ρ = 1.483 cm3 g−1 (Fig. S1 in the ESI†). The ratio of 357/540 = 0.66 is in the range of typical packing coefficients (k = 0.65–0.77) for molecular structures.57
Taking the known density of the bulk Fe complex, 1.483 g cm−3 as a realistic density estimate for closely packed molecules in the pores, the maximal loading could be estimated as Vpore × ρ, where Vpore is the specific pore volume. The latter could be estimated at 1.09 cm3 g−1 from the value of gas uptake based total pore volume of 1.16 cm3 g−1, save the 0.07 cm3 g−1 part associated with pores with d < 10 Å as estimated by the NL-DFT model. Hence, the maximum loading is 1.483 g cm−3 × 1.09 cm3 g−1 = 1.62 g (Fe complex)/g (MIL), or 1.62/(1.62 + 1) = ∼62% by weight.
The achieved highest incorporation of ∼0.11 g (Fe complex)/g (S@M) or ∼11 wt% (Table 1) is, as expected, significantly less than the value estimated above. The solution of the iron complex, used for the synthesis is relatively diluted, and high incorporation rates are not expected, particularly under conditions, where diffusion of the large molecules of the iron complex is strongly hindered. During the synthesis, the pores are also filled by solvent molecules, terephthalic acid and low-molecular coordination-bonded ‘synthetic debris’ and some of those components could also perform an important templating action (i.e. the variation of the established synthetic concentrations could possibly be only limited and the sufficient dilution by potentially templating DMF might be crucial). Washing of bulk NH2-MIL-101(Al) for maximal removal of the small entrapped species was carried out with DMF followed by drying at 25 °C for 16 h with further drying under vacuum (10−3 Torr) at 120 °C for at least 2 h, prior to the N2 gas adsorption measurement from which the pore volume is derived. It is important to accentuate that despite the low loading of the iron complex, the situation, when one cage could contain a few (most probably 2) molecules is not impossible, as the molecular dimensions in principle allow this. However, the most probable situation is 1 molecule per cage.
 | ||
| Fig. 2 Thermogravimetric curves of S@M materials and NH2-MIL-101(Al). | ||
 | ||
| Fig. 3 PXRD patterns of the three samples of [Fe(HB(pz)3)2]@NH2-MIL-101(Al) (differing in Fe-complex loading, cf.Table 1) in comparison with the NH2-MIL-101(Al) reference and the [Fe(HB(pz)3)2] complex. | ||
 141 Torr and low relative pressure measurements necessary for micropore analysis are achieved in the range of moderate absolute pressures (1–760 Torr).59 CO2 micropore analysis at 273 K versus N2 analysis at 77 K ensures cardinally faster equilibration and hence analysis time as well as a slight extension of the range of analysis to pores of smaller sizes that are accessible to CO2 molecules, but not to N2 (∼3.30 vs. 3.64 Å kinetic diameters respectively).49,60 Higher temperature speeds up the equilibration considerably,61 while the smaller kinetic diameter of CO2 also improves somewhat the access to the micropores.
| Material | S BET (m2 g−1) | S Langmuir (m2 g−1) | V pore,N2 (cm3 g−1) | V micro(CO2)c (cm3 g−1) |
|---|---|---|---|---|
| a Calculated in the pressure range of 0.05 < p/p0 < 0.2 from N2 sorption isotherm at 77 K with an estimated standard deviation of ±50 m2 g−1. b Calculated from N2 sorption isotherm at 77 K (p/p0 = 0.95). c Pore volume for pores with d ≤ 1 nm (10 Å, cf.Fig. 7) from the CO2 NL-DFT model at 273 K. | ||||
| NH2-MIL-101(Al) | 2220 | 2890 | 1.16 | 0.068 |
| S@M-1 | 150 | 210 | 0.13 | 0.044 |
| S@M-2 | 50 | 70 | 0.049 | 0.029 |
| S@M-3 | 170 | 230 | 0.21 | 0.033 |
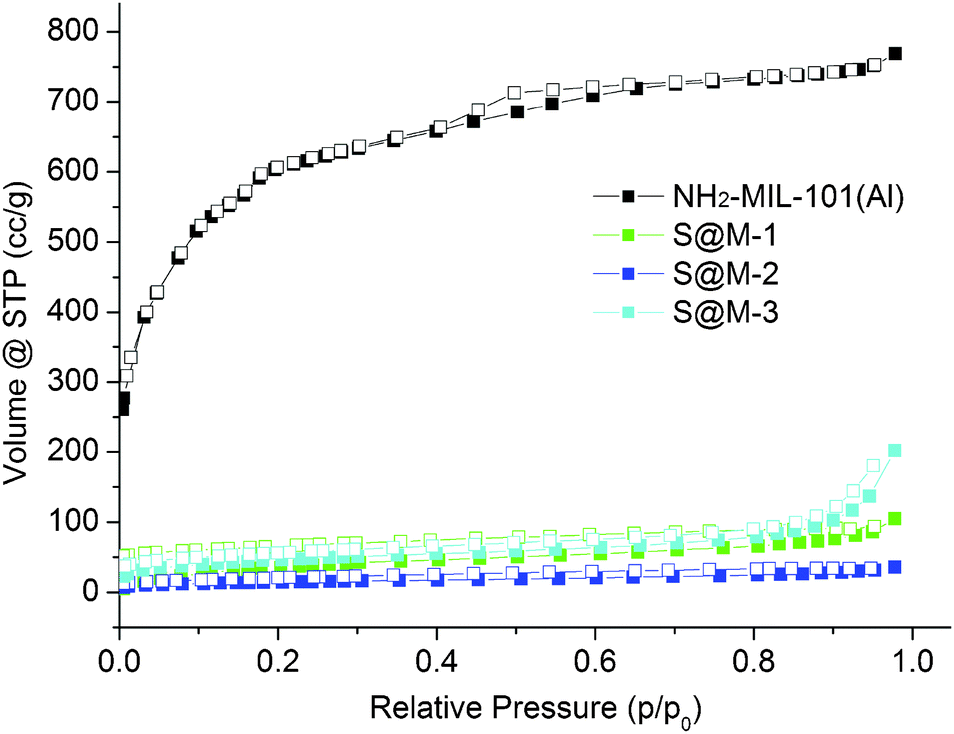 | ||
| Fig. 5 N2 sorption isotherms of S@M samples and NH2-MIL-101(Al) (filled symbols for adsorption and empty symbols for desorption). | ||
CO2 adsorption (Fig. 6) indeed confirms the presence of notable residual free volume, i.e., the clogging of the host matrix by the molecules of the [Fe(HB(pz)3)2] complex forms a kinetic barrier only for the N2 molecules at 77 K, but not for CO2 molecules at 273 K (see above). The adsorption isotherms are similar for all the S@M samples and the most porous sample is expectedly the S@M-1 with the lowest loading of the iron complex (Table 2). The comparison of S@M-2 and S@M-3 demonstrate the close and relatively low residual porosity values. That suggests that the reserves for further incorporation of the iron complex molecules at the expense of solvent molecules are depleted under current conditions. From CO2 adsorption isotherms at 273 K (Fig. 5), the pore size distribution (PSD) using nonlocal density functional theory (NLDFT) with a “slit-pore model” was estimated (Fig. 7). The contribution of the 8–9 Å pore sizes has expectedly decreased in the loaded samples compared to the pristine NH2-MIL-101(Al) and the integral pore volume associated with the smaller 4–7 nm pores also has become lower. In line with their similar CO2 sorption isotherms the three S@M materials give very similar pore size distributions for pores below 10 Å (1 nm).
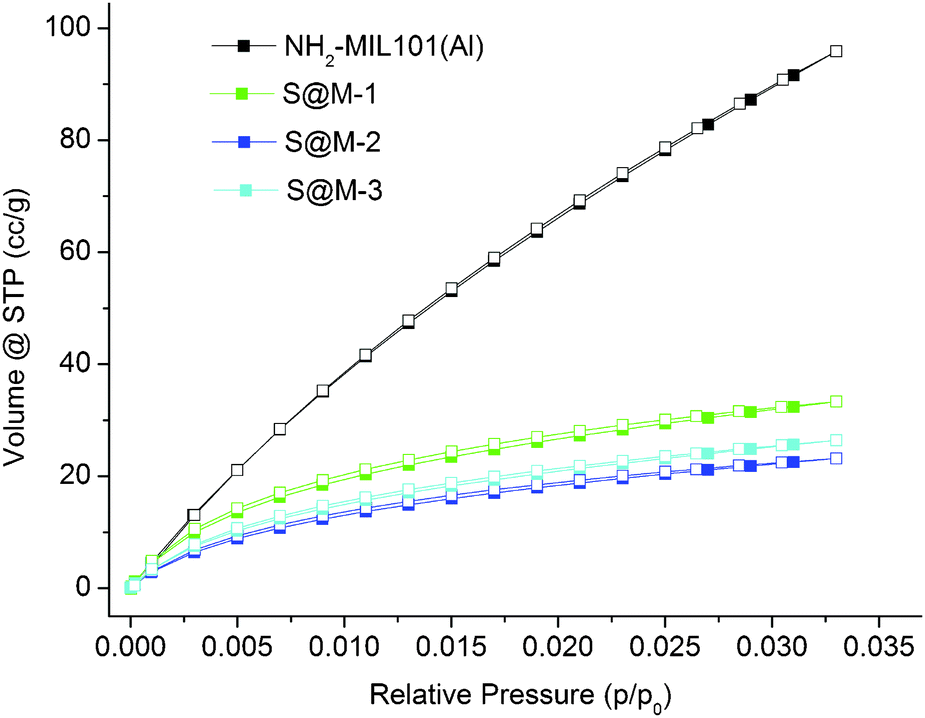 | ||
| Fig. 6 CO2 sorption isotherms of S@M samples and NH2-MIL-101(Al) (filled symbols for adsorption and empty symbols for desorption). | ||
 | ||
| Fig. 7 NLDFT pore size distribution (PSD) curves of NH2-MIL-101(Al) and S@M composite materials from CO2 adsorption isotherms (at 273 K). Note that the charts reflect a relatively crude DFT-based estimation and the jagged lines are caused by large quantization steps. | ||
 | ||
| Fig. 8 Photographs of bulk [Fe(HB(pz)3)2]@NH2-MIL-101(Al) as sample S@M-2 (left) with methanol added (right) for colour comparison. Additional images for other solvents added are given in Table S1 in the ESI.† | ||
Solvent-addition triggered spin state switching
The initial solution of reactants in DMF prior to heating is similar to the wine-red colour of [Fe(HB(pz)3)2], which is characteristics of the LS state of this complex at room temperature. As the reaction proceeded, the red colour faded and the yellowish colour of bulk NH2-MIL-101(Al) started to dominate (Fig. 8, left), i.e. the incorporated complex switches to the colourless HS state at the temperature of synthesis (130 °C), as expected from magnetic/optical measurements (vide infra). From the reaction mixture, the resulting yellowish powdered sample was separated by centrifugation. When the first sample was washed with methanol a surprising change of colour was detected: the yellow sample turned into dark red (Fig. 8, right), which gave a serendipitous proof that a spin state switching could be triggered by interaction of the [Fe(HB(pz)3)2]@NH2-MIL-101(Al) (S@M) composite with solvent, expectedly through its adsorption and interaction with the encapsulated molecules of the iron complex. A series of experiments with different solvents were performed for better understanding of the phenomenon. For these experiments, thoroughly washed S@M samples, additionally purified in refluxing methanol and dried (see the Experimental section), were used (Fig. 9). The drying was performed at 120 °C in a vacuum oven, thus inducing a direct LS → HS conversion, reinstating the yellowish colour of the composite. Addition of a range of polar to non-polar solvents (MeOH, DMSO, DMF, iPrOH, BuOH, t-BuOH, THF, ethylacetate, CH2Cl2, CHCl3, CCl4, toluene, mesitylene, cyclohexane, and hexane) in all cases induced a spin state switching from the HS to the LS at room temperature, with a pronounced off-white to red colour change (Fig. 9, Table S1 in the ESI†). The result of the addition of different solvents is slightly different, giving different grades of red intensities during the first seconds after the addition. The most intense red colour in a short time was seen for the chlorinated solvents, followed by the alcohols and the hydrocarbons. The observed order rather correlates with the sizes of the solvent molecules than with their polarity, or chemical nature. The solvent-adsorption induced colour change was fully reversible, i.e., vacuum drying of the sample at 120 °C caused the transition back to the HS state and complete disappearance of the LS-characteristic red colour. | ||
| Fig. 9 The solvent-adsorption triggered- (top) and liquid-nitrogen immersion (bottom) colour change associated with the SCO transition. | ||
Differential scanning calorimetry (DSC) is in principle also suitable to follow a spin-transition for SCO compounds.14 To the best of our knowledge this must be, however, an abrupt spin-transition to generate a clear DSC signal. Here, in the absence of contiguous domains of a bulk SCO material, we rather see gradual transition of molecular species, akin to a solid solution.
The solvent conditioned spin state switching is well known for ‘bulk’ crystalline materials, which is associated with a change in the crystal structure (see for example here: ref. 62 and 63). This case with the expected underlying mechanism is principally different, and in the absence of ordered dense structure the effect is expected to be weaker, but distant similarities might exist. One of the initial hypothesis was that there might be a specific interaction between the adsorbed host molecules and the incorporated iron complex, which specifically changes the effective pressure accepted by the latter, thus triggering the spin state change and thus the colour change. Nonetheless no specific influence of the nature of the solvent, dependence on polarity, size or other factors was clearly observed. Curiously, the addition of pure DMF, i.e., the same solvent which was used for the synthesis, also switched the colour to wine red. The initial preservation of the colour of the freshly synthesized compound after cooling it down to room temperature could be explained by the ‘metastable’ character of the HS state.
Indeed, the metastability of the HS state was confirmed, when in a control experiment the cooled tube with the freshly synthesized composite was left intact for a few days, the red colouration gradually reappeared the experiment was carried out in a closed tube, thus the interaction with the atmosphere was precluded; hydration is a known possible issue, which might cause a spin state transition e.g. in crystalline bulk compounds like in the [Fe(NH2trz)3](2-napthalene-sulfonate)2 coordination polymer.64
Aside from the addition of a solvent, a fast HS → LS transition could also be triggered by fast immersion in liquid nitrogen, i.e. rapid or ‘stress’ cooling (Fig. 9). All the synthesized compounds behave similarly with evidently weaker colour change of S@M-1, which is consistent with lower Fe loading. This phenomenon was expected, but is not entirely self-evident: slow cooling at least to room temperatures, or even below (see further the magnetic experiments) does not cause fast transition, while the cryogenic temperatures might ‘freeze’ the transition kinetically.
Thus, the full observations allow formulating a hypothesis, that the addition of a solvent with a subsequent adsorption at least in the surface layer as well as stress-cooling causes a rapid HS → LS relaxation of the encapsulated complex residing in the metastable state. A solvent mediated pressure transfer from the confinement to the encapsulated molecules is a process, which favours the LS state with smaller molecular volume,1,27,28 which might serve as an underpinning of the process' mechanism. The addition of the solvent might not just cause relaxation, but also shift the effective transition temperature to lower value, thus stimulating more complete transition.
Magnetic and optical reflectivity measurements
The SCO behaviour of bulk [Fe(HB(pz)3)2] is well described in the literature.21–23 The temperature dependence of the effective magnetic moment of crystalline [Fe(HB(pz)3)2] is shown in Fig. S5–S7 in the ESI.† Heating a crystalline sample of [Fe(HB(pz)3)2], recrystallized from hot toluene21 or freshly sublimed,22 from room temperature21 or 90 K22 to above 400 K results in an increase of effective magnetic moment from <1.0 to 4.9 μB, which indicates a change from primarily LS lA1g to the HS 5T2g state (Fig. S5 and S6 in the ESI†). Yet, this increase is slow and very gradual up to 390 K (∼2.90 μB) at which point a sharp rise in effective magnetic moment to 4.14 μB occurs. This sharp increase was assigned to a crystallographic phase transition: the initial well-formed crystals shatter into extremely small fragments. The phase transition is accompanied by a change in the electronic ground state to an essentially HS configuration. The magnetic moment reaches the spin-only value of 4.90 μB for iron(II) at 461 K.21,22 Upon cooling the same sample shows no sharp decrease in magnetic moment anymore. The decrease occurs gradually to ∼1.38 μB at 298 K and to 0.61 μB at 90 K. During a second heating of the same sample the magnetic moment follows the gradual preceding cooling curve.21–23 Thus, the change in the magnetic moment or susceptibility displayed an apparent hysteresis only for the first thermal cycle (Fig. S5–S7 in the ESI†). Subsequent heating and cooling cycles follow the first cooling curve and not the first heating curve as the initially metastable tetragonal form of [Fe(HB(pz)3)2] had relaxed into a stable monoclinic form.23The temperature variable magnetic susceptibility of the S@M materials and NH2-MIL-101(Al) reference were monitored using DC magnetic measurements. Prior to the magnetic measurements the samples were stored in a closed glass vessel in order to prevent excess adsorption of vapours from air.
For the NH2-MIL-101(Al) reference sample a paramagnetic contribution is visible below 114 K (Fig. S8 in the ESI†). Above 150 K the diamagnetic contribution is fitted to the linear equation χdia = −1.1 × 10⁻⁹–2.2 × 10⁻⁷ emu g−1 Oe−1. It is apparent from the equation that a small paramagnetic contribution is present also above 150 K. Additionally, χdia = −3.553 (emu mol−1 Oe−1) diamagnetic corrections based on Pascal constants for the iron complex were applied for the S@M composites.
The χT vs. T plots for the S@M-2 and S@M-3 samples with the highest iron loading are presented in Fig. 10 (the effective molar susceptibility was calculated using the iron content established by the AAS analytics). Then the weights of the incorporated complex and matrix were determined, and the diamagnetic corrections associated with both constituents were applied. See also the ESI.† The dependencies, measured in the interval of 70–400 K are similar. The samples, stored for approximately 3 months after the synthesis in closed vials, and hence partially relaxed (i.e. with iron atoms mainly in the LS state) were cooled down for performing the first cycle. The heating invoked a gradual spin transition, slow until 300 K and steeper thereafter, when app. 70–80% of the transition occurs. For the subsequent cooling to 70 K the magnetic moment decreases only for ∼30–40% from the initial sweep of app. 1.4–2.0 emu K mol−1. Thus most of the Fe(II) of the composites remain in the HS state and the loop of the χT vs. T plot for the first heating–cooling cycle does not close, demonstrating an inherently slow relaxation process. From 150 K to 70 K the paramagnetic contribution of NH2-MIL-101(Al) (cf. Fig. S10 in the ESI†) becomes more visible, thus, χT slightly increases with the temperature decrease as shown in Fig. 10. The second warming–cooling cycle is nearly closed and retraces the cooling path of the first cycle, remaining above 80% of the maximum χT value. Thus, most of the Fe(II) in the S@M materials is kept in the high-spin state during second cycle measurements.
 | ||
| Fig. 10 Temperature-variable magnetic curves for S@M-2 (top) and for S@M-3 (bottom). | ||
In order to confirm the magnetic measurements, temperature dependent optical reflectivity spectra were collected at λ = 550 ± 50 nm over the range of 90–480 K. They (Fig. 11 and Fig. S12 in the ESI†) correspond rather well to the magnetic measurements with some shift in the transition temperature ranges, which is expected given the difference in physical techniques employed: DC magnetometry (recorded in settle mode) focuses on the bulk of the sample whereas optical reflectivity (in scanning mode) records the surface of the sample. For the first cycle of sample S@M-2, the transition is observed over the range of ∼320–450 K, while for S@M-3 it is observed over ∼310–450 K. The subsequent cycles shows that no return to the LS state takes place. The specific ‘flexures’ at 250–310 K observed on the heating-up branches of the χT vs. T plots are also observed for the repeated cycles, proving that they are not artefacts. The approximate endpoint of the transition, which was not accessible from the magnetic measurements due to temperature limitations of our SQUID magnetometer, was provided by the optical reflectivity spectra (Fig. 11, Fig. S12 in the ESI†).
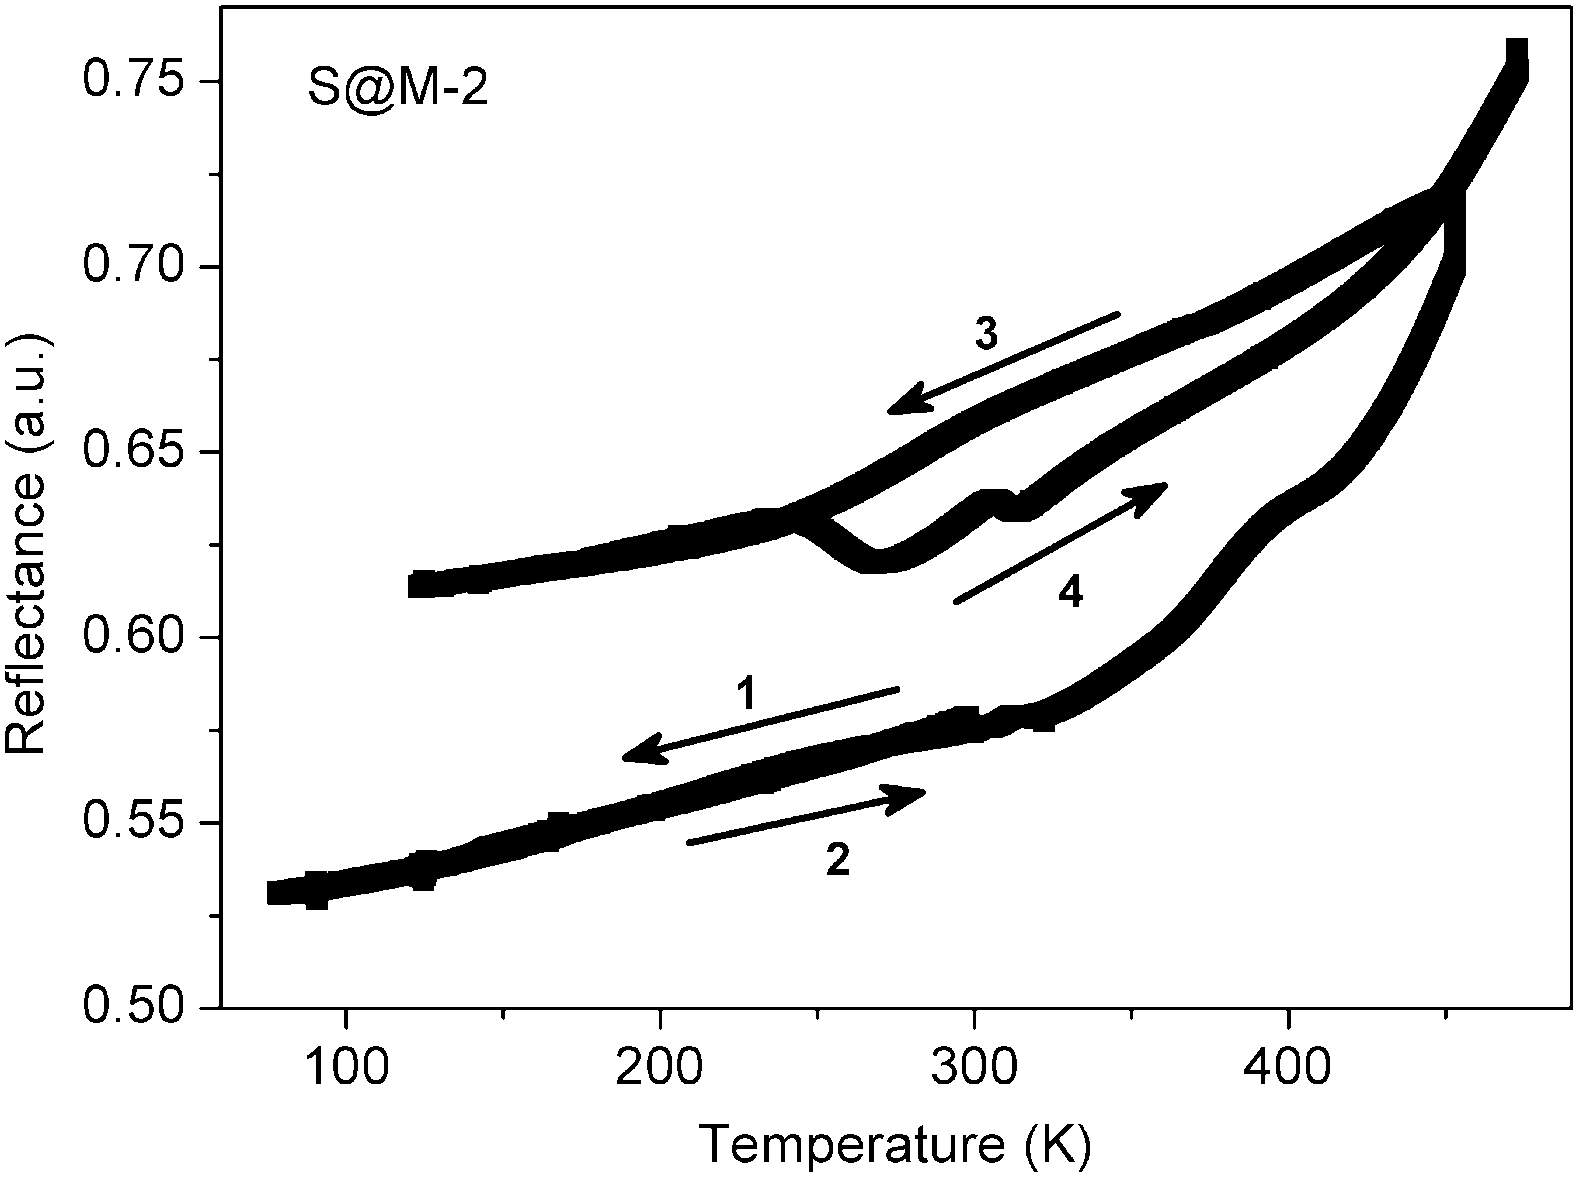 | ||
| Fig. 11 Thermal dependence of optical reflectivity recorded for the sample S@M-2 (see Fig. S12 in the ESI,† for sample S@M-3). | ||
The distinctive characteristics of the χT vs. T plots underpin the plausible hypothesis proposed before: the molecules of the iron complex, isolated in the matrix, reside in a metastable state for prolonged time (weeks to months for the majority of the centres). In the samples, which were kept for a long time in closed vials at room temperature, a process of HS → LS relaxation underwent gradually to a significant extent. Hence, the heating up during the first warming–cooling cycle, caused a LS → HS transition for a significant part of the already relaxed, LS iron centres. Subsequent cooling down did not affect the majority of them, due to a good isolation in the matrix. Only a relative minority of iron centres are probably bound more strongly to the matrix and hence could undergo a faster relaxation and respond to the cooling, fast compared to the average relaxation time. Subsequent warming–cooling cycles, which precisely repeat themselves, confirm that the first observation is not a measurement artefact.
It was interesting to check the extent to which the addition of a solvent induces the HS → LS transition. Single point magnetic measurements at room temperature on ‘time-relaxed’ (app. 1 month) dry samples and on the same samples after addition of one drop of n-hexane (∼40 μL, comparable with the weight of the sample used for the measurement) followed by a certain equilibration time (∼1 h) were performed. The measurements were compared with pure [Fe(HB(pz)3)2] as reference (Table 3; the diamagnetic contribution of n-hexane, which has also at least partially evaporated after addition, was not accounted for). Addition of n-hexane at room temperature caused a substantial decrease of magnetic moment (82/97% for S@M-2 and 63/90% for S@M-3, respectively, where the first number relates to the ratio of the ‘time-relaxed’ sample level and the second to the maximum for the HS sample, reached at 400 K), i.e., a proportional reduction of the share of iron atoms residing in the HS state. Thus, despite the residual porosity of the samples is believed to be relatively low, n-hexane acted remarkably efficiently. A possible explanation of such a high efficiency is that the n-hexane molecules actually do not reach all recesses in the porous solid, but rather impose a strong stress associated with the capillary forces. The applied stress drastically shortens the relaxation time because of intensified mechanic interaction between the incorporated molecules of the iron complex with the framework and the remaining ‘synthetic debris’, still partially occupying the pores. Such a viewpoint is supported by the relative stability of the HS state in the mother solution of DMF immediately after the synthesis, i.e., even when the liquid is present, but no specific stresses are imposed.
| Sample | χ mol (emu/Oemol Fe) | χ mol·T | μ (μB) | % in HS
|
Reduction of mag. moment Δμ/μ (%) |
|---|---|---|---|---|---|
| S@M-2 | 7.13 × 10⁻³ | 2.13 | 4.12 | 78 | |
| S@M-2 + n-hexane | 2.22 × 10⁻⁴ | 0.07 | 0.75 | 15 | 82 |
| S@M-3 | 1.05 × 10⁻² | 3.17 | 5.03 | 100 | |
| S@M-3 + n-hexane | 1.45 × 10⁻³ | 0.43 | 1.85 | 37 | 63 |
In any case, it is important to accentuate that the whole mechanism of the solvent-triggered relaxation is viewed as chiefly analogous to a ‘matrix-effect’, i.e., the influence of the confining matrix. The added solvent, by entering the pores of the composite, generates an increase of efficient local pressure (practically a manifestation of capillary forces). The added pressure favours the LS state, which means an increase of temperature range of its existence, or, equivalently, stabilizes the LS state at the same temperature and speeds up the relaxation.
If we compare dry composite samples with the bulk Fe-complex (see Fig. S5–S7 in the ESI†), we can say that at 400 K all composite samples demonstrate practically complete transition to the HS state (5.0 μB for S@M-2 and 5.9 μB for S@M-3 calculated for a formal unit with one iron atom, based on the AAS data). The practically measured values of the magnetic moment for a single Fe(II) ion is up to μ = 5.6 μB (see also the ESI† for additional information) (Fig. S9 and S10 in the ESI†). On the other hand, the magnetic moment of the pure Fe-complex is only 0.7 μB (LS state) at 70 K and reaches 0.94 μB at 298 K and 2.94 μB at 400 K which is about 60% of a full HS state (Fig. S11 in the ESI†). According to the literature, the pure iron complex achieves a complete HS state at 460 K. This is an interesting observation, which might suggest that the spin-switching in the S@M composites occurs at lower temperature compared to the case of the pure complex. The precise measure of this decrease is hard to quantify. According to the optical reflectivity measurements some fraction of the iron centres switch also beyond 400 K (while the calculated magnetic susceptibility cannot be a precise and reliable indicator of when the transition is completed due to the possible presence of minority iron species other than [Fe(HB(pz)3)2] with lower molecular weight). The comparison of the inflection points of the T1/2↑ branches of the χT(T) dependencies for the bulk compound and the S@M composites (Fig. S9–S12 in the ESI†) allows to state that the shift is smaller than 25 K. It is reasonable to expect that due to even smaller cooperativity, the transition in S@M should be broader, which might explain, at least partially, the perceived shift. The observed faint “matrix effect”49 could formally be associated with the increased effective pressure suffered by the incorporated species, which favours the LS form. In the present case the MOF matrix with rigid pores larger than the size of the molecules is not expected to impose a strong effective pressure. However, the pores are not empty and the remaining synthetic debris together with the framework could generate such a pressure, which should be especially evident at higher temperatures, when the molecular motion is intensified. The magnetic moment for S@M-3 is somewhat higher than the maximal theoretical value. The discrepancy is still within the expected experimental error, as the iron concentration in the samples is relatively small (<1.5%), compared to the large diamagnetic part. The diamagnetic contribution is quite significant for such a sample; for example, for S@M-3 the magnetic moment is 5.9 μB, and the value uncorrected for diamagnetism is 5.1 μB. It is estimated that the magnetic moment is measured in this case with an error of at least ±0.5 μB. A minority admixture of iron species other than [Fe(HB(pz)3)2] could also contribute.
The non-coincidence of the repeated cycles, especially for the case of S@M-2 is an observation, which deserves a short additional note. The effect might, at least partially, be explained by some hydration of the S@M-2 sample due to a non-hermetic storage vessel. At 400 K some quantity of water escapes from the gelatine capsule, and even if a part of it remains it could be re-adsorbed, the loss might contribute to the changes in the subsequent cycles. In any case, the amount of water is small, and not enough to invoke a rapid relaxation, so this effect is considered of secondary importance, even if it might be present. Another observation, which might be associated with water are the flexures (‘humps’) on χT(T) plots between 240 and 320 K observed for all S@M samples on the heating branches (number 3 in Fig. 10), which effects in a small hysteresis, saliently different from the behaviour of the bulk complex. An attractive, but still non-confirmed explanation is that this behaviour is associated with a phase transition of water. Due to increased mobility the molecules of the latter could affect the magnetic state by causing relaxation of the neighbouring magnetic centres and a local depression on the plot.
We did not record Mössbauer spectra on the samples since we felt that our magnetic and optical measurements were already enough to probe the spin transition nature. More important, the sample is diluted, which makes the Mössbauer spectra much longer to record, with the necessity to go to low temperatures which makes it difficult to track the spin transition by this technique here.
Conclusions
Intriguing solvent-triggered rapid relaxation of the magnetic state was demonstrated for a novel [Fe(HB(pz)3)2]0.07–0.16@NH2-MIL-101(Al) (S@M) composite material series, where SCO molecules are embedded in a Metal–Organic Framework material (MOF). The molecules of the iron complex, introduced during the synthesis of the diamagnetic and transparent MOF, are irreversibly entrapped in the rigid cages, and experience weakened interactions, particularly in the form of elastic deformations, which are otherwise important for the cooperative spin crossover phenomenon. The isolation indeed causes the expected loss of cooperativity, and the observed ‘matrix’ effect in dried samples is non-conspicuous, in accordance with the expected loose placement of the iron complex molecules in the rigid cages. On the other hand the quite unique observation is that the entrapped molecules are residing in a metastable HS state for a long time with only slow (weeks to months) HS → LS relaxation, while a rapid, practically momentary relaxation could be induced by addition of a solvent or by stress-cooling via immersion in liquid nitrogen (slow cooling, in contrast, has only a minimal effect). The effect is not solvent specific, at least when the colour change is taken as a fast screening criterion: n-hexane, dichloromethane, toluene, methanol and many other solvents act similarly. The independence on polarity and molecular size suggests a non-specific, mechanical-stress mediated relaxation mechanism, which might involve also the pressure transfer propagation through the framework and the residual ‘filler material’ in the pores.Thus, a new model SCO system with an isolation of SCO sites is proposed (Fig. 12). Classical LS → HS transfer is possible via thermal stimulus, and the durable metastable HS form could be switched back by a fast liquid solvent-action mediated relaxation at room temperature. The demonstrated phenomenon and methodology is an early attempt of demonstration, how the switchable region could be expanded by durable metastability, using the isolation of transferable sites. The loss of cooperativity is compensated by an opportunity of potential molecular-precision addressability in such materials using light switching. The demonstrated use of inherently crystalline MOFs is particularly well suited, due to the presence of long range order and thus, a similar environment created by every cage.
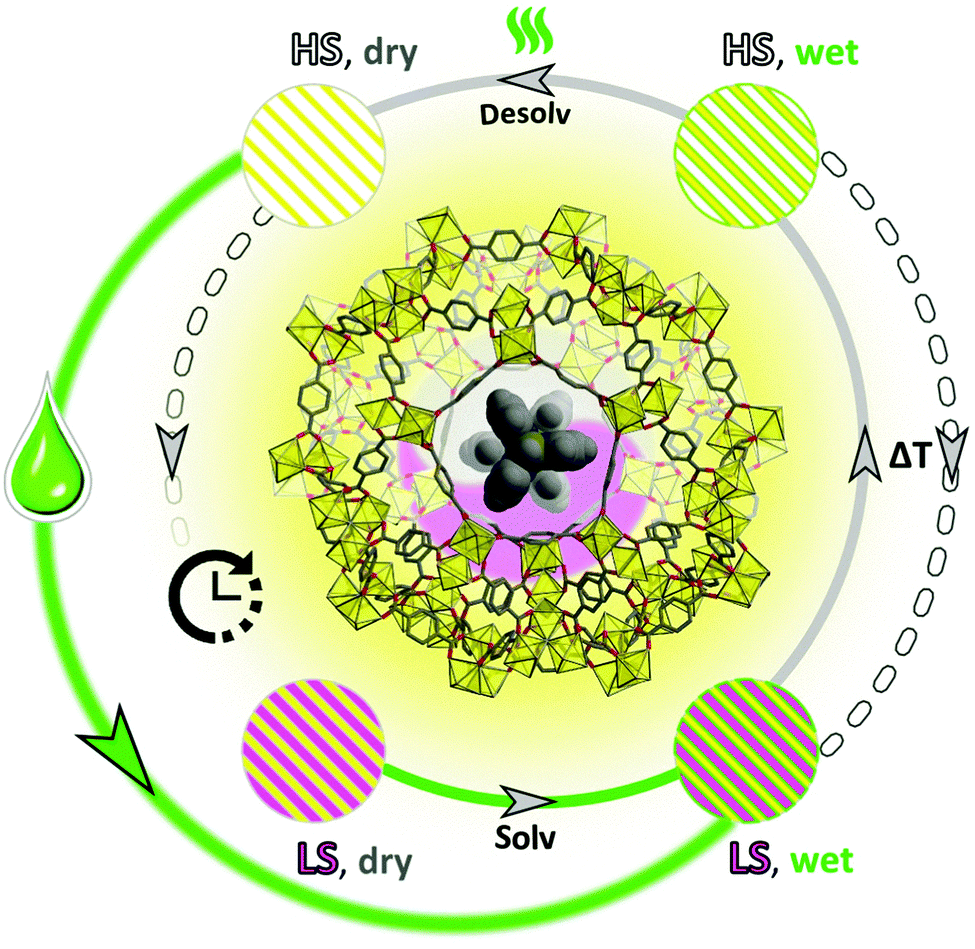 | ||
| Fig. 12 Schematic summary of the phenomenon of solvent and temperature influenced spin state switching. The as-synthesized ‘LS, wet’ form of S@M, the composite of a molecular iron complex in a rigid MOF matrix, transits to ‘HS, wet’ form under heating in DMF; upon cooling a slow reverse process is observed. Vacuum drying at elevated temperatures yields the ‘HS, dry’ form, which has an unexpectedly long relaxation time to the ‘LS, dry’ form. This relaxation can be strongly accelerated through solvation, giving ‘LS, wet’ form. The whole process can be repeated. | ||
The observed phenomenon, which is interpreted as a relaxative spin state switching might be more complex and calls for further investigation. The spin-state switching of single molecules or two- to three-molecule ensembles have little similarity to bulk crystalline material with extended, structurally contiguous, domains. On one hand the rigid MOF matrix isolates the switching molecules within various, relatively weakly interacting environments, which could effect in a broader range of transition temperatures compared to a bulk material, or even to a solution. On the other hand, the rigidity of the MOF matrix is relative and even moderate deformations, which are facilitated in solids of low density, could add to the complexity of the possible phenomena, which involves the change in pressure.
A clear further target for comparison is an S@M inclusion compound of the larger [Fe(HB(Me2pz)3)2] complex with below-room temperature transition temperatures, upon which the work is continuing. On the other hand the novel effect of fast solvent triggered relaxation is clear, salient in its easy observation. It comes in the row of the relatively few, but interesting cases of solvent triggered spin-state transitions, primarily in crystalline solids. Composite materials of this new type could be prototypes for light-driven single-unit addressable memory, while the ‘bottle-around-the-ship’ assembly could, possibly, be generalized for the synthesis of materials with more specific response for adsorbate molecules. In principle the potential area of ‘solvent assisted matrix-effect’ in the context of SCO is of general interest, as the addition of solvent could decrease the effective transition temperature, to trigger a true non-relaxative transition.
Experimental section
All measurements on S@M samples were done on samples pre-dried in a vacuum for 2 h (120 °C, 12 mbar) before the measurement.Methods
Thermogravimetric analysis (TGA) was performed using a Netzsch Tarsus 209 F3 TGA instrument in a protecting flow of nitrogen (10 mL min−1) at a 10 °C min−1 heating rate.
Infrared spectra (IR) were recorded on a Bruker Tensor 37FT-IR Spectrometer using an ATR unit (Platinum ATR-QL, Diamond) with a resolution of 2 cm−1.
Atom absorption spectroscopy (AAS) for the determination of iron content was conducted using a Perkin Elmer Analyst1000 instrument (acetylene/air flame, 10 cm burner head length). For calibration, 1 μg mL−1, 5 μg mL−1 and 10 μg mL−1 iron standard solutions were used. Solutions for the AAS were prepared from a precisely weighed amount of a few milligram of a sample dissolved in 5 mL of conc. HNO3 (65%) solution and further diluted by water to a precise total volume of 20 mL using a volumetric flask.
Energy-dispersive X-ray analyses (EDX) were obtained on a Jeol JSM-6510LV QSEM Advanced electron microscope using a LAB-6 cathode at 5–20 keV. This microscope is equipped with a Bruker Xflash 410 silicon drift detector and the Bruker ESPRIT software for EDX analysis.
Direct current (DC) magnetic measurements were performed using a Quantum Design MPMS XL-5 SQUID magnetometer. For each sample, M(T) measurement was carried out in the magnetic field of 1000 Oe, starting from T = 70 K up to 400 K (heating), followed by cooling back to 70 K with 1 K min−1 rate.
Optical reflectivity measurements were done using an Olympus BX51 optical microscope equipped with a silicon photodiode and a (550 ± 50) nm interferential filter. The heating and cooling of the sample was done inside a Linkam HFS600-P variable temperature stage by varying the temperature at a rate of 2 K min−1.
Synthesis and characterization
Three samples were synthesized using the general procedure, encoded S@M-n, where n = 1–3. The amounts of [Fe(HB(pz)3)2] used and total S@M yields were as follows. S@M-1: 50 mg of [Fe(HB(pz)3)2] was used, the yield of the composite was ∼47 mg; S@M-2: 70 mg, ∼54 mg, S@M-3: 90 mg, ∼52 mg. The samples were stored under ambient air in a closed glass vessel before further measurements.
Acknowledgements
T. Z. thanks the China Scholarship Council (CSC) for a doctoral fellowship and I. B. thanks the Alexander von Humboldt foundation for a postdoctoral fellowship (1135450 STP). The work was supported by the University of Düsseldorf through its strategic research fund (SFF). Y. G. thanks the financial support from FNRS (PDR T.0102.15), FNRS-Academie Roumaine, WBI Roumanie and COST actions MP1202, CM1305 and CA15128. A. R. acknowledges the financial support of Romanian National Authority for Scientific Research, CNCS – UEFISCDI, project number PN-II-RU-TE-2014-4-2695 (Contract No. 267/01.10.2015). We also thank Dr Ana Belén Gaspar for some preliminary measurements on S@M samples. We thank one of the referees for his or her valuable and constructive comments.References
- P. Gütlich and H. A. Goodwin, Top. Curr. Chem., 2004, vol. 233–235 Search PubMed.
- O. Kahn and C. J. Martinez, Science, 1998, 279, 44–48 CrossRef CAS.
- P. Gütlich, A. B. Gaspar and Y. Garcia, Beilstein J. Org. Chem., 2013, 9, 342–391 CrossRef PubMed.
- J. A. Wolny, H. Paulsen, A. X. Trautwein and V. Schünemann, Coord. Chem. Rev., 2009, 253, 2423–2431 CrossRef CAS.
- M. Cavallini, I. Bergenti, S. Milita, G. Ruani, I. Salitros, Z.-R. Qu, R. Chandrasekar and M. Ruben, Angew. Chem., Int. Ed., 2008, 47, 8596–8600 CrossRef CAS PubMed.
- M. Kepenekian, J. S. Costa, B. L. Guennic, P. Maldivi, S. Bonnet, J. Reedijk, P. Gamez and V. Robert, Inorg. Chem., 2010, 49, 11057–11061 CrossRef CAS PubMed.
- C. Lefter, R. Tan, S. Tricard, J. Dugay, G. Molnár, L. Salmon, J. Carrey, A. Rotaru and A. Bousseksou, Polyhedron, 2015, 102, 434–440 CrossRef CAS.
- A. Lapresta-Fernández, M. P. Cuéllar, J. M. Herrera, A. Salinas-Castillo, M. del Carmen Pegalajar, S. Titos-Padilla, E. Colacio and L. F. Capitán-Vallvey, J. Mater. Chem. C, 2014, 2, 7292–7303 RSC.
- M. P. Cuéllar, A. Lapresta-Fernández, J. M. Herrera, A. Salinas-Castillo, M. del Carmen Pegalajar, S. Titos-Padilla, E. Colacio and L. F. Capitán-Vallvey, Sens. Actuators, B, 2015, 208, 180–187 CrossRef.
- (a) J. Linares, E. Codjovi and Y. Garcia, Sensors, 2012, 12, 4479–4492 CrossRef CAS PubMed; (b) C. M. Jureschi, J. Linares, A. Rotaru, M. H. Ritti, M. Parlier, M. M. Dîrtu, M. Wolff and Y. Garcia, Sensors, 2015, 15, 2388–2398 CrossRef CAS PubMed; (c) C.-M. Jureschi, J. Linares, A. Boulmaali, P. R. Dahoo, A. Rotaru and Y. Garcia, Sensors, 2016, 16, 187, DOI:10.3390/s16020187.
- C.-M. Jureschi, I. Rusu, E. Codjovi, J. Linares, Y. Garcia and A. Rotaru, Physica B, 2014, 449, 47–51 CrossRef CAS.
- M. M. Dîrtu, F. Schmit, A. D. Naik, A. Rotaru, J. Marchand-Brynaert and Y. Garcia, Int. J. Mol. Sci., 2011, 12, 5339–5351 CrossRef PubMed.
- C. Janiak, Chem. Ber., 1994, 127, 1379–1385 CrossRef CAS.
- C. Janiak, T. G. Scharmann, J. C. Green, R. P. G. Parkin, M. J. Kolm, E. Riedel, W. Mickler, J. Elguero, R. M. Claramunt and D. Sanz, Chem. – Eur. J., 1996, 2, 992–1000 CrossRef CAS.
- S. Zamponi, G. Gambini, P. Conti, G. G. Lobbia, R. Marassi, M. Berrettoni and B. Cecchi, Polyhedron, 1995, 14, 1929–1935 CrossRef CAS.
- T. Buchen and P. Gütlich, Inorg. Chim. Acta, 1995, 231, 221–223 CrossRef CAS.
- S. Calogero, G. G. Lobbia, P. Cecchi, G. Valle and J. Friedl, Polyhedron, 1994, 13, 87–97 CrossRef CAS.
- G. J. Long and B. B. Hutchinson, Inorg. Chem., 1987, 26, 608–613 CrossRef CAS.
- Y. Sohrin, H. Kokusen and M. Matsui, Inorg. Chem., 1995, 34, 3928–3934 CrossRef CAS.
- (a) A. Gulino, E. Ciliberto, S. Di Bella and I. Fragalà, Inorg. Chem., 1993, 32, 3759–3769 CrossRef CAS; (b) J. P. Jesson, J. F. Weiher and S. Trofimenko, J. Chem. Phys., 1968, 48, 2058–2066 CrossRef CAS; (c) J. P. Jesson, S. Trofimenko and D. R. Eaton, J. Am. Chem. Soc., 1967, 89, 3148–3158 CrossRef CAS; (d) J. P. Jesson, S. Trofimenko and D. R. Eaton, J. Am. Chem. Soc., 1967, 89, 3158–3164 CrossRef CAS; (e) J. P. Jesson and J. F. Weiher, J. Chem. Phys., 1967, 46, 1995–1996 CrossRef CAS.
- B. Hutchinson, L. Daniels, E. Henderson, P. Neill, G. J. Long and L. W. Becker, J. Chem. Soc., Chem. Commun., 1979, 1003–1004 RSC.
- F. Grandjean, G. J. Long, B. B. Hutchinson, L. Ohlhausen, P. Neill and J. D. Holcomb, Inorg. Chem., 1989, 28, 4406–4414 CrossRef CAS.
- L. Salmon, G. Molnár, S. Cobo, P. Oulié, M. Etienne, T. Mahfoud, P. Demont, A. Eguchi, H. Watanabe, K. Tanaka and A. Bousseksou, New J. Chem., 2009, 33, 1283–1289 RSC.
- M. B. Duriska, S. M. Neville, B. Moubaraki, J. D. Cashion, G. J. Halder, K. W. Chapman, C. Balde, J.-F. Létard, K. S. Murray, C. J. Kepert and S. R. Batten, Angew. Chem., 2009, 121, 2587–2590 CrossRef.
- H. L. C. Feltham, C. Johnson, A. B. S. Elliott, K. C. Gordon, M. Albrecht and S. Brooker, Inorg. Chem., 2015, 54, 2902–2909 CrossRef CAS PubMed.
- W. Liu, X. Bao, J.-Y. Li, Y.-L. Qin, Y.-C. Chen, Z.-P. Ni and M.-L. Tong, Inorg. Chem., 2015, 54, 3006–3011 CrossRef CAS PubMed.
- A. Galet, A. B. Gaspar, G. Agusti, M. C. Muñoz, G. Levchenko and J. A. Real, Eur. J. Inorg. Chem., 2006, 3571–3573 CrossRef CAS.
- G. Levchenko, A. Khristov, V. Kuznetsova and V. Shelest, J. Phys. Chem. Solids, 2014, 75, 966–971 CrossRef CAS.
- N. Moliner, L. Salmon, L. Capes, M. C. Muñoz, J.-F. Létard, A. Bousseksou, J.-P. Tuchagues, J. J. McGarvey, A. C. Dennis, M. Castro, R. Burriel and J. A. Real, J. Phys. Chem. B, 2002, 106, 4276–4283 CrossRef CAS.
- R. Bertoni, M. Cammarata, M. Lorenc, S. F. Matar, J.-F. Létard, H. T. Lemke and E. Collet, Acc. Chem. Res., 2015, 48, 774–781 CrossRef CAS PubMed.
- G. J. Halder, C. J. Kepert, B. Moubaraki, K. S. Murray and J. D. Cashion, Science, 2002, 298, 1762–1765 CrossRef CAS PubMed.
- (a) B. Schäfer, C. Rajnák, I. Šalitroš, O. Fuhr, D. Klar, C. Schmitz-Antoniak, E. Weschke, H. Wende and M. Ruben, Chem. Commun., 2013, 49, 10986–10988 RSC; (b) I. Šalitroš, O. Fuhr, R. Kruk, J. Pavlik, L. Pogány, B. Schäfer, M. Tatarko, R. Boča, W. Linert and M. Ruben, Eur. J. Inorg. Chem., 2013, 1049–1057 CrossRef; (c) I. Šalitroš, J. Pavlik, R. Boča, O. Fuhr, C. Rajaduraia and M. Ruben, CrystEngComm, 2010, 12, 2361–2368 RSC.
- D. Qiu, L. Gu, X.-L. Sun, D.-H. Ren, Z.-G. Gu and Z. Li, RSC Adv., 2014, 4, 61313–61319 RSC.
- C. M. Quintero, G. Félix, I. Suleimanov, J. Sánchez Costa, G. Molnár, L. Salmon, W. Nicolazzi and A. Bousseksou, Beilstein J. Nanotechnol., 2014, 5, 2230–2239 CrossRef PubMed.
- G. Molnár, L. Salmon, W. Nicolazzi, F. Terkib and A. Bousseksou, J. Mater. Chem. C, 2014, 2, 1360–1366 RSC.
- H. J. Shepherd, G. Molnár, W. Nicolazzi, L. Salmon and A. Bousseksou, Eur. J. Inorg. Chem., 2013, 653–661 CrossRef CAS.
- A. Tissot, L. Rechignat, A. Bousseksou and M.-L. Boillot, J. Mater. Chem., 2012, 22, 3411–3419 RSC.
- A. Tokarev, J. Long, Y. Guari, J. Larionova, F. Quignard, P. Agulhon, M. Robitzer, G. Molnár, L. Salmon and A. Bousseksou, New J. Chem., 2013, 37, 3420–3432 RSC.
- D. Qiu, D.-H. Ren, L. Gu, X.-L. Sun, T.-T. Qu, Z.-G. Gu and Z. Li, RSC Adv., 2014, 4, 31323–31327 RSC.
- E. C. Ellingsworth, B. Turner and G. Szulczewski, RSC Adv., 2013, 3, 3745–3754 RSC.
- S. Basak, P. Hui and R. Chandrasekar, Chem. Mater., 2013, 25, 3408–3413 CrossRef CAS.
- J. Dugay, M. Giménez-Marqués, T. Kozlova, H. W. Zandbergen, E. Coronado and H. S. J. van der Zant, Adv. Mater., 2015, 27, 1288–1293 CrossRef CAS PubMed.
- G. Felix, W. Nicolazzi, L. Salmon, G. Molnar, M. Perrier, G. Maurin, J. Larionova, J. Long, Y. Guari and A. Bousseksou, Phys. Rev. Lett., 2013, 110, 235701 CrossRef PubMed.
- N. Willenbacher and H. Spiering, J. Phys. C: Solid State Phys., 1988, 21, 1423–1439 CrossRef.
- V. Martinez, I. Boldog, A. B. Gaspar, V. Ksenofontov, A. Bhattacharjee, P. Gütlich and J. A. Real, Chem. Mater., 2010, 22, 4271–4281 CrossRef CAS.
- (a) Y. Raza, F. Volatron, S. Moldovan, O. Ersen, V. Huc, C. Martini, F. Brisset, A. Gloter, O. Stephan, A. Bousseksou, L. Catala and T. Mallah, Chem. Commun., 2011, 47, 11501–11503 RSC; (b) P. Durand, S. Pillet, E.-E. Bendeif, C. Carteret, M. Bouazaoui, H. El Hamzaoui, B. Capoen, L. Salmon, S. Hebert, J. Ghanbaja, L. Aranda and D. Schaniel, J. Mater. Chem. C, 2013, 1, 1933–1942 RSC; (c) J. M. Herrera, S. Titos-Padilla, S. J. A. Pope, I. Berlanga, F. Zamora, J. J. Delgado, K. V. Kamenev, X. Wang, A. Prescimone, E. K. Brechin and E. Colacio, J. Mater. Chem. C, 2015, 3, 7819–7829 RSC.
- Y. Umemura, Y. Minai, N. Koga and T. Tominaga, J. Chem. Soc., Chem. Commun., 1994, 893–894 RSC.
- (a) K. Mizuno and J. H. Lunsford, Inorg. Chem., 1983, 22, 3484–3486 CrossRef CAS; (b) S. K. Tiwary and S. Vasudevan, Chem. Phys. Lett., 1997, 277, 84–88 CrossRef CAS.
- T. Zhao, L. Cuignet, M. M. Dîrtu, M. Wolff, V. Spasojevic, I. Boldog, A. Rotaru, Y. Garcia and C. Janiak, J. Mater. Chem. C, 2015, 3, 7802–7812 RSC.
- P. Serra-Crespo, E. V. Ramos-Fernandez, J. Gascon and F. Kapteijn, Chem. Mater., 2011, 23, 2565–2572 CrossRef CAS.
- G. Férey, C. Mellot-Draznieks, C. Serre, F. Millange, J. Dutour, S. Surblé and I. Margiolaki, Science, 2005, 309, 2040–2042 CrossRef PubMed.
- M. Hartmann and M. Fischer, Microporous Mesoporous Mater., 2012, 164, 38–43 CrossRef CAS.
- P. Horcajada, C. Serre, M. Vallet-Regí, M. Sebban, F. Taulelle and G. Férey, Angew. Chem., Int. Ed., 2006, 45, 5974–5978 CrossRef CAS PubMed.
- T. Čendak, E. Žunkovič, T. U. Godec, M. Mazaj, N. Z. Logar and G. Mali, J. Phys. Chem. C, 2014, 118, 6140–6150 CrossRef.
- K. Brandenburg, Diamond (Version 3.2), Crystal and Molecular Structure Visualization, Crystal Impact, K. Brandenburg & H. Putz Gbr, Bonn (Germany), 2009 Search PubMed.
- T. Mahfoud, G. Molnar, S. Cobo, L. Salmon, C. Thibault, C. Vieu, P. Demont and A. Bousseksou, Appl. Phys. Lett., 2012, 99, 053307 CrossRef.
- A. I. Kitaigorodskii, Molecular Crystals and Molecules, Academic Press, New York, 1973 Search PubMed.
- F. Rodriguez-Reinoso and A. Linares-Solano, in Chemistry and Physics of Carbon, ed. P. A. Thrower, Marcel Dekker, New York, 1988, vol. 21 Search PubMed.
- Quantachrome Instruments (1900 Corporate Drive, Boynton Beach, FL 33426 USA, http://www.quantachrome.com) Powder Tech Note 35.
- A. Bhunia, I. Boldog, A. Möller and C. Janiak, J. Mater. Chem. A, 2013, 1, 14990–14999 RSC.
- (a) J. Garrido, A. Linares-Solano, J. M. Martin-Martinez, M. Molina-Sabio, F. Rodriguez-Reinoso and R. Torregosa, Langmuir, 1987, 3, 76–81 CrossRef CAS; (b) D. Cazorla-Amoros, J. Alcaniz-Monje and A. Linares-Solano, Langmuir, 1996, 12, 2820–2824 CrossRef CAS; (c) J. Garcia-Martinez and D. Cazorla-Amoros and A. Linares-Solano, in Characterization of Porous Solids V, ed. K. K. Unger, G. Kreysa and J. P. Baselt, Elsevier, Amsterdam, 2000, pp. 485–494 Search PubMed.
- A. D. Naik, K. Robeyns, C. Meunier, A. Léonard, A. Rotaru, B. Tinant, Y. Filinchuk, B. L. Su and Y. Garcia, Inorg. Chem., 2014, 53, 1263–1265 CrossRef CAS PubMed.
- Y. Garcia, P. J. van Koningsbruggen, R. Lapouyade, L. Fournès, L. Rabardel, O. Kahn, V. Ksenofontov, G. Levchenko and P. Gütlich, Chem. Mater., 1998, 10, 2426–2433 CrossRef CAS.
- Y. Garcia, P. J. van Koningsbruggen, E. Codjovi, R. Lapouyade, O. Kahn and L. Rabardel, J. Mater. Chem., 1997, 7, 857–858 RSC.
- S. Trofimenko, J. Am. Chem. Soc., 1967, 89, 3170–3177 CrossRef CAS.
Footnote |
| † Electronic supplementary information (ESI) available: Additional data regarding IR spectroscopy, gas adsorption measurements, and temperature dependent optical reflectivity. See DOI: 10.1039/c6tc01297c |
| This journal is © The Royal Society of Chemistry 2016 |