 Open Access Article
Creative Commons Attribution 3.0 Unported Licence
The structure, chemistry and magnetic properties of FePbBiO4
Benjamin P.
de Laune
a,
Frank J.
Berry
a,
Jose F.
Marco
b,
Sarah L.
Horswell
a and
Colin
Greaves
*a
aSchool of Chemistry, University of Birmingham, Birmingham B15 2TT, UK. E-mail: c.greaves@bham.ac.uk
bInstituto de Quimica-Fisica “Rocasolano”, CSIC, Serrano 119, 28006 Madrid, Spain
First published on 4th May 2016
Abstract
The compound FePbBiO4 has been synthesised and has a tetragonal structure (P42/mbc, a = 8.48924(9) Å, c = 6.10597(8) Å) that is closely related to FeSb2O4. It provides the first example of a compound with this structure that (a) contains only trivalent ions (here Fe3+) within the chains of edge-linked octahedra and (b) accommodates Bi3+ in the walls of the channels formed between the chains of octahedra. FePbBiO4 orders antiferromagnetically with a Néel temperature of 24 K; neutron diffraction reveals A-type magnetic order with moments oriented perpendicular to [001]. The magnetic moment of Fe3+ at 4 K is 3.74(6) μB, slightly lower than that commonly observed for this cation in well-ordered magnetic oxides.
1 Introduction
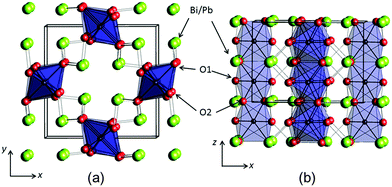
The mineral schafarzikite, FeSb2O4, has been reported to be tetragonal (P42/mbc, a = 8.62 Å and c = 5.91 Å)1 with one-dimensional features: chains of edge-linked FeO6 octahedra are aligned along [001] and enclose parallel channels. This is illustrated in Fig. 1 for the detailed structure of the new compound reported here, FePbBiO4 (or Fe(PbBi)2O4), where one Pb2+ and one Bi3+ ion have replaced two Sb3+ ions. In FeSb2O4, therefore, Sb3+ ions link the FeO6 octahedra via their apical (O1) and equatorial (O2) ligands and form SbO3 trigonal pyramids. The Sb3+ lone pairs (e) are directed into the channels and provide pseudo-tetrahedral SbO3e coordination. Strong intrachain magnetic exchange (primarily direct orbital overlap between adjacent Fe2+ ions) results in A-type magnetic order (Fig. 2a) below the Néel temperature, TN = 46 K.2,3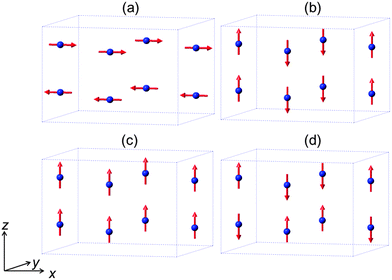 | ||
| Fig. 2 The four possible collinear spin alignments generating the basic observed magnetic structures for MSb2O4 phases: (a) A-type, (b) C-type, (c) F-type and (d) G-type. | ||
Related MSb2O4 materials (M = magnetic transition metal) are known for M = Mn, Co, Ni, Cu and Zn.4–8 All order magnetically at low temperatures except for CuSb2O4, which appears to show no long range order above 2 K,9 and ZnSb2O4, which is diamagnetic. Whereas the phases with M = Mn, Fe display predominantly A-type magnetic order (Fig. 2a), the M = Co, Ni phases are C-type antiferromagnets (Fig. 2b).1,10,11 It has been suggested that the nature of the direct exchange within the chains – size of cation, M–M separation distance and occupancy of the t2g orbitals – is responsible for the change in magnetic order.11,12 The 90° M–O–M intrachain exchange is expected to be ferromagnetic but weak for all ions in the series Mn⋯Ni. However, Mn2+ and Fe2+ experience strong direct antiferromagnetic exchange because the t2g orbitals are relatively diffuse; this allows overlap of orbitals on adjacent cation sites to give an antiferromagnetic groundstate. Across the series from Mn to Ni, the d-orbitals contract and the t2g orbitals fill up both of which weaken the direct exchange such that intrachain ferromagnetic order occurs to give, overall, C-type order. In confirmation of these basic principles, the change in magnetic order for the series FexCo1−xSb2O4 and MnxCo1−xSb2O4, 0 ≤ x ≤ 1 has recently been reported and shows a gradual change from A-type to C-type as x decreases.12
Attempts to functionalise some materials by creating mixed M2+/M3+ oxidation states have been reported via substitution of Pb2+ for Sb3+ for M = Mn, Fe and Co.11,13,14 However, only for M = Fe is oxidation of the transition metal favoured over oxidation of Sb3+ to Sb5+.13 Even for this system, FeSb2−xPbxO4, pure crystalline products were obtained only for x ≤ 0.7 and no phase containing 100% Fe3+ (requiring equal amounts of +2 and +3 charged lone pair cations) has been reported. The magnetic properties of such a material are of interest because the direct exchange would be expected to be weaker than in the Fe2+ compound, FeSb2O4, such that the resultant magnetic order is not simple to predict. It is also strange that no schafarzikite-type phase containing Bi3+ ions has been reported since the ionic radius of Bi3+ (1.03 Å) is intermediate between those of Pb2+ (1.19 Å) and Sb3+ (0.76 Å); these data are for 6-coordinate ions since data are not given for 3-coordination.15 In the present study, we examined the use of the similarly sized cations Pb2+ and Bi3+ and we report the successful synthesis, structure, magnetic properties and chemistry of the resultant product FePbBiO4: the first schafarzikite compound to contain only +3 cations within the chains of octahedra and the first to contain Bi3+ cations.
2 Experimental
A polycrystalline sample of FePbBiO4 was synthesised by heating an intimate mixture of pre-dried Fe2O3 (99%, Aldrich), PbO (99.9%, Aldrich) and Bi2O3 (99.9%, Aldrich) in the appropriate stoichiometric amounts. The mixture was heated in air for two periods of 7 h at 650 °C in an alumina boat.X-Ray powder diffraction (XRPD) data were collected on a Bruker D8 diffractometer (PSD: Lynxeye, Cu-Kα1, Ge monochromator) in planar transmission mode. Neutron powder diffraction (NPD) data were collected on diffractometer D2B, ILL, Grenoble at temperatures of 300, 20, 16 and 4 K. The wavelength was calibrated using XRPD refinement data on the same sample to give λ = 1.5923 Å. The ILL data used for the refinements were extracted from only the centre of the detectors to provide greater peak resolution.
A 57Fe Mössbauer spectrum was recorded at 298 K with a constant acceleration spectrometer in transmission geometry using a ca. 400 MBq 57Co/Rh source. To avoid the effects of excessive absorption by the presence of Pb and Bi, a sample enriched to 10% 57Fe was synthesised. The drive velocity was calibrated with the 57Co/Rh source and a natural iron foil. The chemical isomer shift data are reported relative to that of metallic iron at 298 K.
The Rietveld method16 was used to refine the nuclear and magnetic structures of FePbBiO4 with the aid of the general structures analysis system (GSAS)17 and EXPGUI interface.18 Background intensity was modelled using a shifted Chebyschev polynomial with 25 terms, while peak shapes were modelled using a pseudo-Voigt function. Isotropic displacement parameters were assigned to Fe3+ and the equatorial O2, but anisotropic parameters were used for Pb2+/Bi3+ and the apical O1. The magnetic structure was modelled using a second unit cell (P1) containing only magnetic cations, with appropriate constraints applied to the magnetic moments to conform to a given model. The unit cell dimensions of the magnetic phase were constrained to those of the nuclear unit cell.
Magnetic susceptibility data were acquired using a Quantum Design MPMS SQUID under field cooled (FC) and zero field cooled (ZFC) conditions with an applied field of 100 Oe. No corrections for diamagnetism were applied since they are too small to provide a significant effect. A cooling and heating rate of 10 K min−1 was used, with measurements taken in ‘Sweep’ mode. The polycrystalline sample (∼70 mg) was contained in a gelatin capsule, within a plastic straw.
3 Results and discussion
3.1 Crystal structure
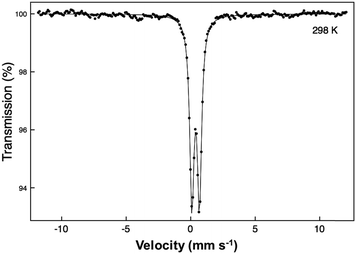
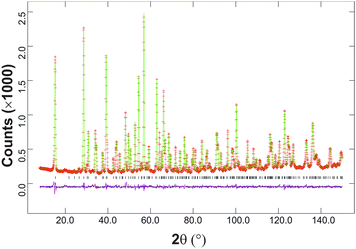
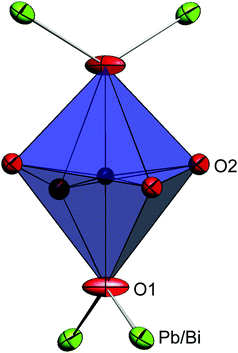
The synthesised FePbBiO4 was dark brown and stable in air up to the melting point at ∼700 °C. The ambient temperature Mössbauer spectrum, Fig. 3, shows a single Fe3+ doublet with a chemical isomer shift, δ, of 0.39 mm s−1 and quadrupole splitting, Δ, of 0.59 mm s−1. These values are typical of octahedral Fe3+ and confirm that the synthesis yields a product for which 100% of the Fe is present as Fe3+. XRPD data revealed the product to be single phase with a tetragonal, P42/mbc, structure which is indicative of the schafarzikite structure. The unit cell parameters determined from Rietveld refinement against X-ray data were subsequently used to calibrate the NPD data, against which the structure was refined. The refined structural parameters are given in Table 1 for data obtained at ambient temperature and 4 K. The relevant diffraction profiles corresponding to the refinement based on ambient temperature data are shown in Fig. 4. The Bi and Pb ions were found to be randomly distributed on the channel wall site; it was found that this position and the apical O1 site had higher than expected isotropic displacement parameters (IDPs). Allowing anisotropy resulted in strongly anisotropic parameters (ADPs) as shown in Table 1. These values are attributed to the presence of both Pb2+ and Bi3+: the charge and size differences, as discussed in the Introduction, result in local displacements of the cations and the O1 ions, to which they are bonded. The effects of the ADPs are highlighted in Fig. 5, which focuses on this region of the structure. The local displacements of Pb/Bi towards or away from the bonded O1 are indicated, and O1 moves in a perpendicular direction so that the Fe–O1 bond distance will not change significantly. The displacements allow optimisation of the bonding requirements according to whether Pb2+ or Bi3+ is bonded to a particular O1 site. Table 2 gives important bond distances and angles and also provides bond valence sums (BVS)19 for the cations and the full structure is shown in Fig. 1.| Atom | Site | x | y | z | U iso (or Ueq) × 100/Å2 |
|---|---|---|---|---|---|
| P42/mbc: a = 8.48925(9) (8.4725(2)) Å, c = 6.10597(8) (6.1004(2)) Å, volume = 440.04(1) (437.90(3)) Å3. Rwp = 0.036 (0.056); χ2 = 4.19 (8.98).a Anisotropic displacement parameters (all × 100/Å2) are given. | |||||
| Fe | 4d | 0.0 | 0.5 | 0.25 | 0.91(3) |
| 0.58(4) | |||||
| Pb/Bi | 8h | 0.1541(1) | 0.1570(1) | 0.0 | 1.65a |
| 0.1547(2) | 0.1558(2) | 0.0 | 1.13 | ||
| O1 | 8g | 0.6686(1) | 0.1686(1) | 0.25 | 2.74a |
| 0.6687(2) | 0.1687(2) | 0.25 | 1.86 | ||
| O2 | 8h | 0.0930(2) | 0.6303(2) | 0.0 | 1.34(3) |
| 0.0916(3) | 0.6313(3) | 0.0 | 0.70(5) | ||
| Atom | U 11 | U 22 | U 33 | U 12 | U 13 | U 23 |
|---|---|---|---|---|---|---|
| Pb/Bi | 1.27(6) | 2.10(6) | 1.59(4) | 0.21(4) | 0.0 | 0.0 |
| 0.68(9) | 1.58(10) | 1.13(8) | 0.23(6) | 0.0 | 0.0 | |
| O1 | 3.54(6) | 3.54(6) | 1.14(6) | −2.40(7) | −0.99(5) | 0.99(5) |
| 2.52(9) | 2.52(9) | 0.52(11) | −1.51(12) | −0.66(10) | −0.66(5) |
| Bond | Distance/Å | BVS | |||
|---|---|---|---|---|---|
| Fe | –O1 | 2.024(1) [×2] | 2.83 | ||
| –O2 | 2.0435(9) [×4] | ||||
| Pb/Bi | –O1 | 2.1298(10)…[×2] | Pb2+ 2.79 | Bi3+ 2.65 | |
| –O2 | 2.159(2) | ||||
| Bond | Angle/° |
|---|---|
| O1–Fe–O1 | 180.0(0) |
| O1–Fe–O2 | 83.71(4) [×4] |
| 96.29(4) [×4] | |
| O2–Fe–O2 | 83.34(5) [×2] |
| 98.05(5) [×2] | |
| O1–Pb/Bi–O1 | 91.57(5) |
| 90.89(5) [×2] | |
The unit cell volume (440.0 Å3, Table 1) is similar to that of FeSb2O4 (439.5 Å3),13 which reflects a balance in the effects of replacing Fe2+ with the smaller Fe3+ whilst, at the same time, substituting the larger Pb2+/Bi3+ combination for Sb3+. However, a contraction occurs along a and an expansion along c (for FeSb2O4: a = 8.6157(1) Å, c = 5.9207(1) Å).13 This effect is universally seen when oxidation occurs at the octahedral intrachain cation owing to enhanced electrostatic repulsions across the common edges of the linked octahedra.
Although the BVS for Fe3+ is close to that expected (Table 2), the determined Pb/Bi site provides a highly “overbonded” location for Pb2+ whereas Bi3+ would be somewhat “underbonded”. However, these values are to be expected since they are determined from the average Pb/Bi and O ionic positions and are consistent with the ADP values, which represent an attempt to model the distribution of the average scattering from the O, Pb and Bi nuclei. Because of the electrostatic repulsion between Fe3+ cations within the chains of edge-linked octahedra along [001], the octahedra are extended in this direction; this provides O2–Fe–O2 equatorial angles of 83.34(5)° (where the angle bisector is parallel to [001]) and 98.05(5)° (where the bisector is perpendicular to [001]).
3.2 Magnetic properties
Magnetic susceptibility (χ) data for FePbBiO4 are shown in Fig. 6a and suggest a simple paramagnetic-antiferromagnetic transition with a Néel temperature of 24 K; a small divergence between the FC and ZFC susceptibilities below TN is possibly due to a slight canting of the moments. Fig. 6b shows the variation of 1/χ with temperature, which is exactly linear such that it is difficult to differentiate the data points and the least squares fit; the material therefore strictly obeys the Curie–Weiss law: the slope corresponds to an effective moment of μeff = 5.870(1) μB and the intercept on the temperature axis gives the Weiss constant, θ = −97(1) K. As expected for a d5 high spin cation, for which there is zero orbital contribution to the magnetic moment, the moment is in excellent agreement with the spin-only moment of 5.92 μB. As is usual for materials with this structure, −θ is significantly greater than TN; this may be rationalised since θ will reflect the average exchange energy (intrachain and interchain) at temperatures above TN, whereas TN is determined largely by the weaker interchain exchange interactions.12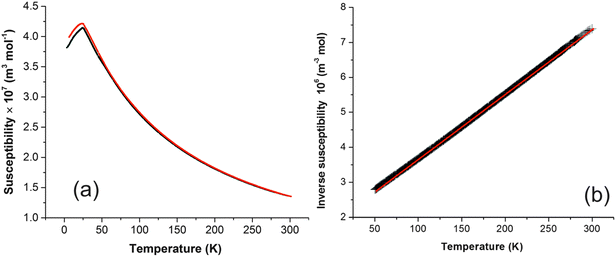 | ||
| Fig. 6 (a) Plot of magnetic susceptibility against temperature for FePbBiO4 (FC data red, ZFC data black). (b) Plot of inverse susceptibility against temperature (data are black, linear fit is red). | ||
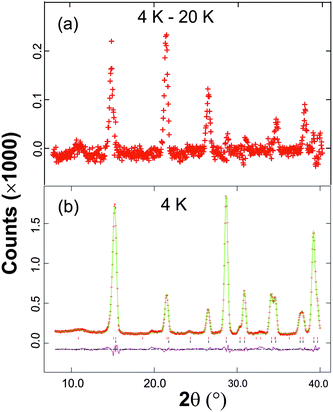
The low temperature magnetic order was explored by collecting NPD data sets at 4 K, 16 K and 20 K. The nuclear structural parameters at 4 K are given in Table 1 and show no major changes compared with those at 300 K. Symmetry allows a range of magnetically ordered structures. Fig. 2 shows the basic types of magnetic order that have been observed for MSb2O4 materials, but the actual order in these materials can be complex, with contributions from more than one of the types of order shown in Fig. 2.12 A separate magnetic phase with P1 symmetry was therefore used in the low temperature refinements to allow complete flexibility. The principal order observed was found to be A-type with moments aligned along [100], Ax, or the equivalent Ay. Although a small Cz component was observed for the largest overall moment (at the lowest temperature, 4 K), at higher temperatures no significant evidence for this was apparent. The refined moments are given in Table 3, where μx gives the A-type moment and μz the C-type component. The mixture of Ax and Cz components at 4 K corresponds to a small rotation of the moments by 6.3(8)° away from the x-axis towards the z-axis. The NPD profiles at 300 K and 4 K are compared in Fig. 7 for 2θ < 40°, where strong magnetic scattering is observed.
| Temperature/K | μ x /μB | μ z /μB | μ total/μB |
|---|---|---|---|
| 4 | 3.72(5) | 0.41(7) | 3.74(6) |
| 16 | 3.17(6) | 0 | 3.17(6) |
| 20 | 2.70(7) | 0 | 2.70(7) |
The NPD data show that FePbBiO4 and FeSb2O4 display the same principal magnetic order: Ax-type with antiferromagnetic order within the chains of FeO6 octahedra. However, the overall exchange interactions appear to be weaker for FePbBiO4, since TN (24 K) is significantly lower than that for FeSb2O4, 46 K.2,3 The Fe3+⋯Fe3+ direct exchange is probably weaker in FePbBiO4 because of the more contracted d-orbitals of Fe3+. It is also likely that the extended interchain covalent exchange pathway (Fe–O–Pb/Bi–O–Fe) is reduced in energy. Given the increased size of Co2+ compared with Fe3+, it is a little surprising that CoSb2O4 displays C-type order11 (with ferromagnetic order within a given chain of octahedra) whereas FePbBiO4 is A-type, which is normally associated with strong direct exchange. This feature can be rationalised by the difference in electron configurations within the t2g orbitals participating in the direct exchange: (t2g)5 and (t2g),3 respectively. In contrast to Fe3+, where all t2g–t2g overlaps will result in antiferromagnetic exchange, for Co2+ both antiferromagnetic and ferromagnetic exchange interactions are present depending on the electron occupancy of the overlapping orbitals; this will reduce the overall tendency for antiferromagnetic chain order.
The refined magnetic moment at 4 K, 3.74(6) μB, is lower than the ideal value of 5 μB for Fe3+. However, the value is similar to values normally seen for Fe3+ compounds, and the reduced moment is caused by zero-point quantum mechanical effects and ligand-to-metal electron transfer inherent to covalence within the Fe–O bonds.
The overall magnetic moments are plotted against temperature in Fig. 8. The Néel temperature from the susceptibility measurements has been included and the resulting four data points fit well to the Brillouin function  where the Néel temperature, TN, is fixed at 24 K, μ0 is the zero-point moment and β is an exponent that is linked to the nature of the transition. In this case, fitting the data results in the parameters: μ0, = 3.89(4) μβ, and β = 0.20(1). Although lower than that normally found for magnetic order in isotropic materials (for which β is usually ca. 0.3), β is typical for low dimensional systems and is similar to the value of 0.18 reported for FeSb2O4.3
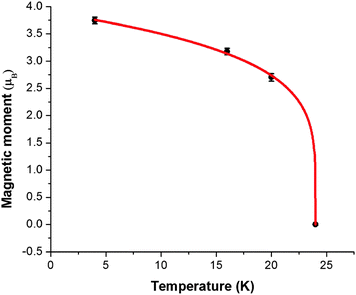 | ||
| Fig. 8 Variation of ordered magnetic moment (●) with temperature fitted to a Brillouin function (red line). | ||
4 Conclusions
Tetragonal FePbBiO4 has been synthesised and its unit cell shows a contraction along a and an expansion along c compared with that of FeSb2O4. These changes are the result of enhanced electrostatic repulsion between the Fe3+ cations within the chains of octahedra oriented along [001]. The Bi3+ and Pb2+ ions are randomly distributed on the sites which form the walls of the channels within the structure, and their bonding preferences result in small differences to their ionic positions; these are reflected in the atomic ADP values. Below the Néel temperature (24 K), FePbBiO4 displays A-type antiferromagnetic order with moments perpendicular to [001]. The magnetic moment of Fe3+ at 4 K is 3.74(6) μB, slightly lower than expected for this cation in well-ordered magnetic oxides.Acknowledgements
We thank EPSRC for financial support of this research (EP/L014114/1) and EPSRC, EU and ILL for the provision of NPD facilities. We are grateful to Dr Emma Suard for assistance in collecting the NPD data and Dr Martin Lees for the use of a SQUID at the Department of Physics, University of Warwick. The X-ray diffractometers used in this research were obtained through Birmingham Science City: Creating and Characterising Next Generation Advanced Materials (West Midlands Centre for Advanced Materials Project 1), with support from Advantage West Midlands (AWM) and part funded by the European Regional Development Fund (ERDF). Data associated with the results shown in this paper are accessible from the University of Birmingham Archive: http://epapers.bham.ac.uk/2162/.References
- J. A. Gonzalo, D. E. Cox and G. Shirane, Phys. Rev., 1966, 147, 415 CrossRef CAS.
- F. Varret, P. Imbert, A. Gerard and F. Hartmann-Boutron, Solid State Commun., 1968, 6, 889 CrossRef CAS.
- R. Chater, J. R. Gavarri and A. W. Hewat, J. Solid State Chem., 1985, 60, 78 CrossRef CAS.
- G. Tammann, Z. Anorg. Allg. Chem., 1925, 149, 21 CrossRef CAS.
- E. Koyama, I. Nakai and K. Nagashima, Nippon Kagaku Kaishi, 1979, 6, 793 CrossRef.
- J. R. Gavarri, G. Calvarin and B. Chardon, J. Solid State Chem., 1983, 47, 132 CrossRef CAS.
- H. T. Witteveen, Solid State Commun., 1971, 9, 1971 CrossRef.
- S. Ståhl, Ark. Kern. Min. Geol., 1943, 17B, 1 Search PubMed.
- M. T. Atanasova, A. M. Strydom, C. J. H. Schutte, L. C. Prinsloo and W. W. Focke, J. Mater. Sci., 2014, 49, 3497 CrossRef CAS.
- J. R. Gavarri and A. W. Hewat, J. Solid State Chem., 1983, 49, 14 CrossRef CAS.
- B. P. de Laune and C. Greaves, J. Solid State Chem., 2012, 187, 225 CrossRef CAS.
- J. Cumby, B. P. de Laune and C. Greaves, J. Mater. Chem. C, 2016, 4, 201 RSC.
- M. J. Whitaker, R. D. Bayliss, F. J. Berry and C. Greaves, J. Mater. Chem., 2011, 21, 14523 RSC.
- A. M. Abakumov, M. G. Rozova, E. V. Antipov, J. Hadermann, G. Van Tendeloo, M. V. Lobanov, M. Greenblatt, M. Croft, E. V. Tsiper, A. Llobet, K. A. Lokshin and Y. S. Zhao, Chem. Mater., 2005, 17, 1123 CrossRef CAS.
- R. D. Shannon, Acta Crystallogr., Sect. A: Cryst. Phys., Diffr., Theor. Gen. Crystallogr., 1976, 32, 751 CrossRef.
- H. M. Rietveld, J. Appl. Crystallogr., 1969, 2, 65 CrossRef CAS.
- A. C. Larson and R. B. Von Dreele, General Structural Analysis System (GSAS), Los Alamos National Laboratory LAUR, 1994, pp. 86–748 Search PubMed.
- B. H. Toby, J. Appl. Crystallogr., 2001, 34, 210 CrossRef CAS.
- I. D. Brown and D. Altermatt, Acta Crystallogr., Sect. B: Struct. Sci., 1985, 41, 244 CrossRef.
| This journal is © The Royal Society of Chemistry 2016 |

