
 Open Access Article
 This Open Access Article is licensed under a
 Creative Commons Attribution 3.0 Unported Licence
Aerosol-assisted fabrication of tin-doped indium oxide ceramic thin films from nanoparticle suspensions
T. A.
Nirmal Peiris
a,
S.
Ghanizadeh
b,
D. S. Y.
Jayathilake
a,
D. A.
Hutt
b,
K. G. U.
Wijayantha
*a,
P. P.
Conway
b,
D. J.
Southee
c,
I. P.
Parkin
d,
P.
Marchand
d,
J. A.
Darr
d and
C. J.
Carmalt
d
aEnergy Research Laboratory, Department of Chemistry, Loughborough University, Loughborough LE11 3TU, UK. E-mail: U.Wijayantha@lboro.ac.uk
bWolfson School of Mechanical and Manufacturing Engineering, Loughborough University, Loughborough LE11 3TU, UK
cDesign School, Loughborough University, Loughborough LE11 3TU, UK
dDepartment of Chemistry, University College London, London WC1H 0AJ, UK
First published on 16th May 2016
Abstract
Sn-doped In2O3 (ITO) thin films were fabricated on float glass substrates from a nanoparticle suspension using a new and inexpensive aerosol-assisted chemical transport (AACT) process. The influence of the solvent type, loading level and film deposition time on the structural, electrical and optical properties of the deposited thin films was investigated. In addition, the effect of the post-deposition heat-treatment of ITO films on the film resistivity and transparency was investigated using microwave radiation and compared with more conventional radiant heat-treated films. The SEM images of the films prepared using a 30 min deposition time with 0.20% (wt/vol%) methanolic ITO suspension provided better surface coverage compared to the other deposition times investigated. The optimised ITO films were heat-treated after deposition by either conventional radiant or microwave assisted heating methods in order to improve the inter-particle connections and film adherence. The films heat-treated after deposition by microwave annealing exhibited an average transmittance of >85% in the visible region with a resistivity of 12 Ω cm and a carrier concentration of −3.7 × 1016 cm3, which were superior to films that were heat-treated using more conventional thermal processing (despite the shorter processing time for the microwave process). The resistivity of ITO films was further decreased to 6.0 × 10⁻² Ω cm with an increased carrier concentration of −8.0 × 1018 cm3 when ethyl cellulose was added to the ITO suspension prior to the AACT deposition. The enhanced conductivity of this film is due to the improved particle–particle and particle–substrate connections as observed by SEM imaging.
Introduction
Metal oxide ceramics have attracted significant attention due to their wide use in electronic and optoelectronic applications.1,2 Among them, transparent conducting metal oxide (TCO) ceramics have received particular attention due to their applications in modern electronic devices such as touch panel displays, smart windows, optics, biochemical and environmental sensors as well as transducers.3–5 Generally TCO thin films require high optical transparency in the visible light spectrum and high electrical conductivity, which is not possible in an intrinsic stoichiometric material.6 TCOs are prepared by the addition of dopants at various concentrations into a crystal lattice of pure semiconductors, thereby altering the optical and electrical properties of the material. The electrical and optical properties of TCO ceramics can be controlled during the deposition and post-deposition heat-treatment steps as they are dependent on the film nanostructure, coverage and particle connections.7,8 Pulsed laser deposition (PLD),9 chemical vapour deposition (CVD),10–13 and radio frequency (RF) sputtering14–16 are thin film deposition techniques commonly used in depositing TCO films. Typically, these deposition techniques require a vacuum pressure (∼10−6 Pa) or higher deposition temperatures (450–700 °C) over a long period of time, hence, the energy demand and overall production cost are high. Therefore, there is considerable interest in developing low and inexpensive film fabrication methods and processing technologies to improve the optical and electrical properties.Aerosol assisted17,18 and sol–gel19–21 deposition methods are considered to be simple and inexpensive routes for thin film fabrication as they do not require specially designed heated reactor lines and high vacuum systems. For example, already known methods such as aerosol assisted chemical vapour deposition (AACVD), atmospheric pressure chemical vapour deposition (APCVD) and sol–gel deposition do not require specially designed metal–organic precursors and high temperature zones.13,19,22 Aerosol-assisted chemical transport (AACT), a physical vapour deposition method, was used to deposit TCO thin films in this study using nanoparticle suspensions at relatively low temperatures. Using the AACT technique, aerosol droplets containing nanoparticles can be generated by nebulising a nanoparticle suspension using an ultrasonic generator, the droplets are then transported onto the substrate at a relatively low temperature (i.e. 50 °C) using an inert carrier gas, thus depositing a thin film of nanoparticles on the substrate due to solvent evaporation. The AACT method has been previously used in our laboratory to deposit CuI thin films on glass substrates,23 which were then suitably heat-treated post-deposition by conventional radiant heating.
Post-deposition heat-treatments are important for strengthening particle–particle and particle–substrate connections in the film and improving the conductive properties of the deposited film. However, conventional radiant annealing can lead to breakdown of the film nanostructure and its physical nature, leading to poor conductivity. Hence, a great deal of interest has been directed in recent years towards microwave irradiation as an alternative material annealing technique in place of conventional radiant sintering.24 This technique is capable of improving particle necking and crystallinity with minimal effects on the surface texture, due to the fact that microwave irradiation generates a volumetric heating profile compared to radiant sintering.12,25 Furthermore, there are many unique characteristics of microwave assisted sintering, including its ability to achieve higher heating rates, short processing times, selective heating and greater control of the heating process, which help to improve the crystallinity as well as inter-particle and particle–substrate connections of the film.26
Herein, we demonstrate for the first time a new and simple aerosol assisted physical vapour deposition technique (i.e. AACT) to fabricate TCO films by using TCO nanoparticle suspensions. A nanoparticle suspension of Sn-doped In2O3 (ITO) was used to demonstrate the applicability of this technique for TCO film fabrication. ITO films were post-deposition heat-treated by either conventional radiant or microwave assisted heating methods in order to compare them; in particular, the microwave heat-treatment was relatively shorter, which significantly reduced the energy input for that step compared to more conventional radiant heating. Furthermore, the resistivity of the microwave heat-treated AACT ITO films showed comparable results to the films reported using the sol–gel method.19,21
Experimental
ITO nanoparticle synthesis
ITO nanoparticles (with 10 at% Sn) were directly synthesised using a continuous hydrothermal flow synthesis (CHFS) method as discussed in a previous report.27 Briefly, a solution of 0.09 M indium(III) nitrate (99%, Alfa Aesar, Lancashire, UK) was pumped to meet a flow consisting of a combined solution of 0.01 M potassium stannate trihydrate (99.9%, Sigma Aldrich, Dorset, UK) and 0.3 M KOH (Fisher Scientific, Leicestershire, UK) at room temperature in a low volume stainless steel T-piece. Each of these precursor feeds was pumped at a flow rate of 25 mL min−1. Separately, a 80 mL min−1 flow of deionised water was heated to 450 °C and then mixed with a 20 mL min−1 flow of 1 M formic acid (≥95%, Sigma Aldrich, Dorset, UK), before mixing with the combined precursor feeds within a confined jet mixer,28 resulting in rapid precipitation of nanoparticles. The resulting suspension was cooled in-line by passing it through a pipe-in-pipe heat-exchanger. The blue slurry product was then collected at the outlet of the back-pressure regulator (Tescom). The material was purified by three cycles of centrifugation and washing with deionised water, before being freeze-dried at 13 Pa with slow heating from −60 to 25 °C (over 24 h) to form a free-flowing blue powder.ITO suspension preparation
A series of ITO suspensions with different loadings were made by adding 0.02, 0.04, 0.06, and 0.1 g of nano-ITO powder (made as detailed above via CHFS) to 50 mL of each solvent followed by 15 min of sonication using a sonicator probe (S-4000, Misonix, Inc, USA). The solvents used were methanol (100%, VWR Chemicals), ethanol (99.9%, VWR Chemicals), propan-2-ol (99.9%, VWR Chemicals) and acetone (100%, VWR Chemicals). Each suspension with corresponding wt/vol percentages of 0.04%, 0.08%, 0.12% and 0.20% was used to fabricate ITO thin films using the AACT technique. The particle size and the zeta potential of the suspensions were recorded using a Zetasizer-nano (Malvern Instruments Ltd, UK).ITO thin film deposition using the AACT method
ITO films were deposited on 1 × 2 cm2 float glass (NSG, Pilkington, UK) substrates held at 50 °C by AACT. The glass substrates were ultrasonically cleaned with doubly distilled water, acetone, propan-2-ol, and then stored in ethanol prior to the deposition. Fig. 1 shows a schematic diagram of the AACT set-up.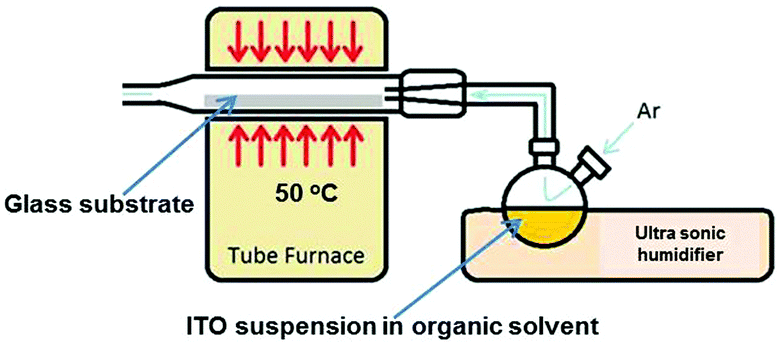 | ||
| Fig. 1 Schematic diagram of the aerosol-assisted chemical transport (AACT) apparatus. | ||
In this deposition method, an ultrasonically generated aerosol containing ITO nanoparticles was directed via an argon gas flow (BOC, UK) at a flow rate of 108 mL min−1 towards the substrate, which was held at 50 °C in a tube furnace (MTF-10-25-130, Carbolite, UK). The ITO films were optimised for higher surface coverage of the substrate by varying the solvent type, the loading level and the deposition time.
In some experiments, 0.01 g of ethyl cellulose (Sigma-Aldrich) was added to 50 mL of nanoparticle suspension and stirred until it fully dissolved prior to the deposition in order to improve the binding properties of the ITO particles.
Post-deposition heat-treatment of ITO films
The ITO films prepared using the AACT method were post-deposition heat-treated using conventional radiant as well as microwave-assisted heating methods. Conventional radiant heating was carried out in a tube furnace (MTF-10-25-130, Carbolite, UK) with a ramp rate of 15 °C min−1 to 600 °C and then held for 3 h under a steady N2 flow of 1825 mL min−1 (N2 purity > 99%, BOC). After heat-treatment, the furnace was turned off and the samples were allowed to cool down to room temperature in the tube furnace under continuous N2 flow. Alternatively, microwave-assisted annealing was performed using a microwave oven (Microwave research Applications Inc. BP-211/50, USA) operating at 2.45 GHz frequency with a maximum power of 3000 W. The sintering of the ITO films was assisted by placing the samples between SiC susceptor tiles and heat loss during annealing was minimized by shielding the sample with insulator blocks.29 The microwave sintering of the films was conducted under a constant gas flow of N2 at 1825 mL min−1 (BOC, UK) and sintering was conducted for 90 s. During sintering, the temperature of the SiC susceptor was monitored using an infrared temperature probe (Mikron infrared Inc. M67/M67S series, USA) with an error of ±5 °C. After 90 s, the temperature of the susceptor reached 600 °C.Characterisation of ITO thin films
The microstructure and surface morphology of the ITO thin films were investigated using a field emission gun scanning electron microscope (FEG-SEM, Jeol, Hertfordshire, UK) operating at an accelerating voltage of 5 keV and a working distance of 5 mm. The phase and crystallinity of the as-deposited and sintered films were studied using a Bruker D8 XRD, operating with monochromatic Cu Kα (k = 1.54 Å) radiation and a position sensitive detector. The optical transmittance measurements were conducted using a dual beam Perkin-Elmer Lambda 35 UV-Vis spectrometer (Perkin Elmer, Massachusetts, US) over the wavelength range of 300–800 nm. A standard scotch tape test was conducted to assess the film adherence.30 The sheet resistance was measured using a four point probe conductivity meter (Jandel, HM20, Jandel Engineering Ltd, Linslade, UK) and the film thickness was measured using an Ambios XP2 stylus profilometer in order to calculate the film resistivity. Hall effect measurements were carried out using the van der Pauw method to determine the bulk resistivity of the films. The films were subjected to an input current of 1 μA and a calibrated magnetic field of 0.58 T. The transverse voltage was then measured. The measurement was repeated by reversing the direction of the magnetic field and the current. For measurements, we used an ECOPIA Hall effect measurement system (HMS-3000).Results and discussion
ITO suspension preparation
Preparation of a stable nanoparticle suspension in a suitable solvent is very important in order to deposit ITO thin films using the AACT technique. Herein, the solvent was required to evaporate at the operational/deposition temperature of the experiment. The suspensions of 0.04, 0.08, 0.12 and 0.20 wt/vol% were prepared by adding the corresponding weight of ITO powder to 50 mL of each solvent used in this study, followed by 15 min of sonication using a sonicator probe. ITO suspensions made in both methanol and ethanol showed the best stability for a period over 30 min, which was sufficient to complete the deposition cycle. The particle size distribution and the surface charge of the particles were monitored using a Zetasizer-nano. For example, the recorded particle size distribution and the zeta potential distribution curves of the 0.20 wt/vol% ITO methanolic suspension are shown in Fig. 2. The average ITO particle size in the methanolic suspension was observed to be around 130 nm, whereas the average zeta potential value (at pH 5) was +25 mV. These values indicated that there is less chance of agglomeration of ITO particles in the methanol media as the positive surface charge of the ITO particles causes particles to separate from each other due to repulsion. However, due to the high surface energy of these nanoparticles, they tend to agglomerate during the evaporation of the solvent.31 The addition of surfactants or binders lowered the surface energy of nanoparticles, thereby preventing the particle agglomeration.32 | ||
| Fig. 2 (a) Particle size distribution and (b) zeta potential distribution curves for the 0.20 wt/vol% ITO suspension in methanol. | ||
ITO thin film fabrication using AACT and optimisation for surface coverage
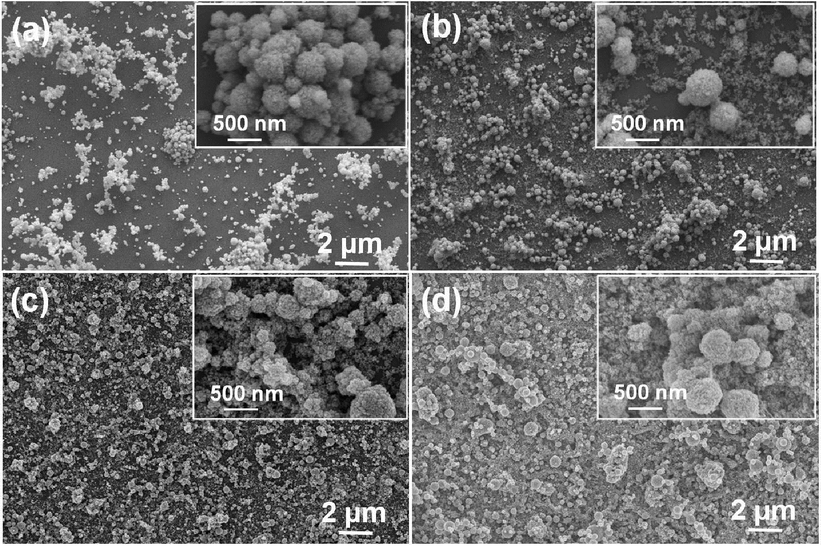
ITO thin films were deposited at 50 °C on glass substrates using the AACT technique. The deposition parameters were systematically investigated in order to control nanoparticle surface coverage. The surface coverage of nanoparticles in the film was controlled by means of solvent type, loading level and deposition time. The FEG-SEM images (Fig. 3) show the surface morphology of ITO thin films deposited using 0.20 wt/vol% suspensions in methanol, ethanol, propan-2-ol and acetone. The films deposited using methanol (Fig. 3a) and ethanol (Fig. 3b) showed good surface coverage compared to those deposited using propan-2-ol (Fig. 3c) and acetone (Fig. 3d). Since these suspensions contain no binders, the nanoparticles in the films were aggregated. The SEM images showed the randomly oriented, nano-scale spherical particles along with some nanoparticle clusters in the film. In fact, the clusters were more prominent in the films deposited using propan-2-ol and acetone, leading to patchy coverage. The SEM investigation confirmed that the best ITO nanoparticle coverage on glass substrates was obtained for the films deposited using methanolic and ethanolic suspensions. | ||
| Fig. 3 The FEG-SEM images of ITO thin films deposited for 30 min using 0.20 wt/vol% suspensions made with (a) methanol, (b) ethanol, (c) propan-2-ol, and (d) acetone. | ||
The films deposited using methanol and ethanol suspensions illustrated agglomerates on a uniform layer of nanoparticles. The higher magnified surface topographic images of the films deposited by these suspensions, shown in Fig. 4, confirmed that a relatively good ITO nanoparticle coverage can be obtained when methanol was used as the solvent (Fig. 4a–c).
 | ||
| Fig. 4 FEG-SEM images at different magnifications of the ITO thin films deposited for 30 min using 0.20 wt/vol% suspensions made with methanol (a–c) and ethanol (d–f). | ||
The effect of the loading level of the methanolic ITO nanoparticle suspension on the film coverage was also studied. The SEM surface morphologies of films deposited using suspensions with loadings between 0.04–0.20 by wt/vol% are shown in Fig. 5. The images indicated that the film coverage is not only dependent on the solvent type, but also on the ITO loading level in the suspension. It was apparent that at relatively low loadings (i.e. 0.04–0.12 wt/vol%), the resulting films had poor nanoparticle coverage (Fig. 5a–c). This may be due to the low nanoparticle content in the aerosol droplets. When the suspension loading was further increased to 0.20 wt/vol%, the deposited film showed improved surface coverage (Fig. 5d).
 | ||
| Fig. 5 FEG-SEM images of ITO thin films deposited for 30 min by AACT using methanolic suspensions with loading levels of (a) 0.04%, (b) 0.08%, (c) 0.12% and (d) 0.20% by wt/vol%. | ||
Along with the solvent type and solid loading, the deposition time is another key parameter that affects the nanoparticle coverage of the film. Therefore, studies were conducted to investigate the influence of the deposition time on the nanoparticle coverage. Since our investigation thus far showed that films deposited from methanolic suspension with a 0.20 wt/vol% loading had a better coverage, those conditions were adopted to study the effect of the deposition time.
Fig. 6 shows the surface topographical SEM images of ITO films deposited at different deposition times by AACT. The deposition time was varied from 5 to 45 mins, whilst maintaining a constant deposition rate. As shown in Fig. 6b, it was found that the films prepared over 30 and 45 min deposition times had a more complete nanoparticle surface coverage than the film deposited for 5 min. However, the film deposited over 45 min appeared to be powdery which could be due to pronounced nanoparticle aggregation in the film. The application of the standard adherence test resulted in removal of the film (Fig. 6d), which was evidence of the powdery nature of the film.
 | ||
| Fig. 6 Surface topographical FEG-SEM images of ITO thin films deposited by AACT using a 0.20 wt/vol% methanolic suspension for different deposition times (a) 5 min, (b) 30 min, (c) 45 min and (d) images of the scotch tape test for the 45 min deposited film. | ||
Post-deposition sintering of AACT deposited ITO films
Post-deposition sintering of ceramics is a key processing technique that can be used to enhance electrical connection between individual particles themselves, as well as particle–substrate interactions, which also eventually improves the crystallinity and nanostructure of the film.33 In recent years, a great deal of interest has been focused on irradiation with microwaves as an alternative ceramic post-deposition sintering technique to conventional radiant annealing. It is capable of improving particle necking and crystallinity with a minimal effect on the material's original nanostructure formed after the drying step.34,35Fig. 7 shows the surface morphology of as-deposited, microwave and conventional radiantly heat-treated ITO films, which were deposited for 30 min by AACT using a 0.20 wt/vol% methanolic ITO suspension. It is intriguing that the edges of the crystallites of microwave treated ITO films were well-defined and smoother compared to those in the more conventional radiantly heated film (Fig. 7b). | ||
| Fig. 7 FEG-SEM images of ITO thin films deposited by AACT for 30 min using a 0.20 wt/vol% methanolic suspension (a) as-deposited, (b) post-deposition heat-treated to 600 °C from 90s by microwaves, (c) conventional radiant post-heated for 600 °C for 3 h. | ||
As shown in Fig. 7b, the best ITO films obtained in this study so far still contained agglomerates. The addition of surfactants or binders is known to lower the surface energy of nanoparticles and thereby reducing particle agglomeration.32 Therefore, we have investigated the effect of ethyl cellulose (EC) on the nanoparticle suspension; when EC was added to the ITO nanoparticle suspension used in the AACT process, the textural nature of the resulting films was more compact with better inter-particle necking compared to the ITO films without EC as shown in tilted SEM images in Fig. 8.
 | ||
| Fig. 8 The titled FEG-SEM images of as-prepared ITO thin films by AACT for 30 min using 0.20 wt/vol% methanolic suspension (a–c) different magnified images without adding the EC binder (d–f) different magnified images of ITO films deposited including 0.01 g of EC as a binder. | ||
After the post-deposition heat-treatment step, a significant change in the film morphology with the addition of EC was observed (Fig. 8), suggesting during post-deposition heat-treatment, new binding mechanisms between the agglomerates and binder may have resulted in a more compact film, albeit with more cracks. According to the reported dielectric properties of EC,36 heat generation by absorbing microwave radiation can be expected in the ITO films with EC. Generally, the dielectric properties of materials vary with the temperature. Due to the increase in the dielectric properties at the elevated temperatures, microwave absorption increases and enhances the heat generation in materials. Therefore, we believe that during the microwave heat-treatment, EC molecules in the films could absorb microwaves and generate heat locally until the substrate temperature reached the EC decomposition temperature. Hence, the particles around the EC molecules may experience slightly higher temperature due to this local heat generation by EC molecules exists in the film. However, the EC molecules will burn off when the temperature is reached above its decomposition temperature resulting in voids where the EC was present in the films. As the temperature of the ITO particles around the voids is slightly higher than the bulk, better sintering can be expected in such films under microwave heat-treatment compared to conventional radiant annealing.
Furthermore, it is evident that the addition of EC helped to improve the necking between the particles as well as with the substrate, which was demonstrated using a standard scotch tape test. The images further show that the crystallized grains of microwave sintered films were more uniform (Fig. 9a) than the conventionally sintered ITO film, despite the fact that the required microwave processing time (90 s) being much shorter than that of the radiant annealing time of 3 h (Fig. 9b).
 | ||
| Fig. 9 FEG-SEM images of ITO thin films deposited by AACT for 30 min using 0.20 wt/vol% methanolic suspension including 0.01 g of ethyl cellulose as a binder (a) post-deposition heat-treated to 600 °C from 90 s by microwaves, (b) conventional radiant annealed at 600 °C for 3 h. | ||
Materials characterisation
Powder X-ray diffraction (XRD) data collection and analysis was employed to determine the crystalline structure of the ITO powder sample and the films deposited by AACT. XRD diffractograms of the ITO powder, as deposited film and post sintered powder are shown in Fig. 10. The XRD diffractograms of the as-prepared and as-deposited ITO show reflections for both In2O3 and InOOH phases. For the ITO powder annealed at 600 °C for 3 h under a N2 atmosphere (Fig. 10b), the diffraction peaks correlated well with the lattice planes of the pure cubic structure of In2O3 (JCPDS 76-0152). Fig. 10c illustrates the XRD diffractograms of as deposited and microwave heat-treated ITO films with the addition of EC. The higher intensity in the In2O3 reflections of the microwave heat-treated sample indicated the InOOH phase transformation, enhancement in the crystal size and the improved crystallinity of the films. | ||
| Fig. 10 XRD diffractograms of (a) as-prepared powder and as-deposited thin film, (b) after post-heating of the as prepared ITO powder at 600 °C and (c) as-prepared and microwave heat-treated films with EC. | ||
Optical transmittance and film resistivity
The optical transmission spectrum of an ITO thin film deposited by AACT from a 0.20 wt/vol% methanolic suspension is shown in Fig. 11. In general, all films showed >85% transparent through the visible portion of the electromagnetic spectrum (400–700 nm). The thickness of the films was measured using a profilometer, which measures difference between the film and the substrate in nanometres. The measured thicknesses of as-deposited and post-deposited and heat-treated ITO films were ca. 800 and 600 nm, respectively. The sheet resistance was measured using a four point probe conductivity meter and the resistivity of the films was calculated by taking into account the measured sheet resistance and the film thickness. The sheet resistance (R), resistivity (ρ), Hall mobility (μ) and carrier concentration (n) values of ITO films with and without addition of EC are given in Table 1. A higher carrier concentration of −80.46 × 1017 cm3 was found for the microwave heat-treated films with ethyl cellulose which could be due to the improved particle necking properties. However a low Hall mobility of 2.19 cm2 V−1 s−1 was observed for the same sample due to the enhanced carrier–carrier scattering taking place at higher carrier concentrations.37,38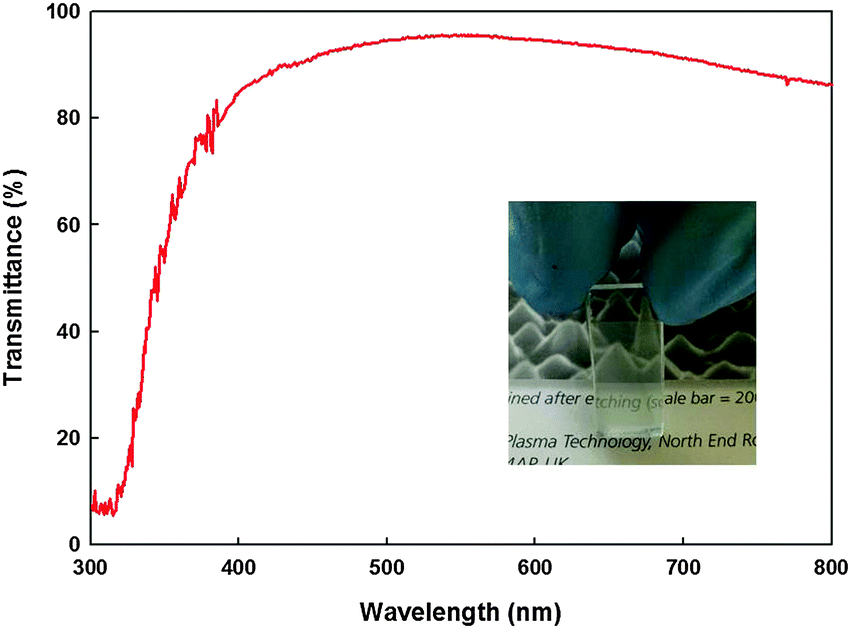 | ||
| Fig. 11 Optical transmission spectrum of ITO thin film deposited for 30 min by AACT using 0.20 wt/vol% methanolic suspension and heat-treated using microwave radiation. Inset is a photograph of the glass sample showing the optical transmission. | ||
| R/Ω □−1 | ρ/Ω cm | μ/cm2 V−1 s−1 | n/×1017 cm3 | ||
|---|---|---|---|---|---|
| As-deposited | Without EC | 4.0 × 10⁶ | 3.2 × 10² | 1.32 | −0.12 |
| With EC | 5.0 × 10⁶ | 4.0 × 10² | 2.92 | −0.02 | |
| Microwave annealed (90 s) | Without EC | 0.2 × 10⁶ | 1.2 × 101 | 11.74 | −0.37 |
| With EC | 1.0 × 10³ | 6.0 × 10⁻² | 2.19 | −80.46 | |
| Radiant annealed (3 h) | Without EC | 0.4 × 10⁶ | 2.4 × 101 | 22.70 | −0.18 |
| With EC | 5.0 × 10³ | 3.0 × 10⁻¹ | 2.18 | −59.80 | |
According to the resistivity values given in Table 1, it is clear that both microwave and conventional radiant post-deposition heat-treatments significantly reduced the resistivity, especially when EC was present due to enhanced inter-particle connections and film adherence caused during the sintering step. However, the lowest resistivity of 6.0 × 10⁻² Ω cm was obtained using microwave radiation for post-deposition heat-treatment due to the improved particle–particle and particle–substrate connections by the volumetric heating. The best resistivity values reported in the literature are based on solution processed ITO nanoparticle films and are of the order of 10−3 Ω cm.39 However, in that work the films were spin coated followed by a radiant annealing step (250–950 °C) under partial oxygen (1.3 × 10⁻⁴–2.1 × 10⁴ Pa) over a long period (1–3 h). The methods used herein and the optimised conditions provided an alternative, novel and significantly cost effective route for manufacturing TCO films. Further work on improving the conductivity of the ITO films deposited by the AACT method is being carried out by varying other parameters such as the flow rate, deposition temperature, doping level, post-processing parameters etc., to build from these initial promising results.
Conclusions
In this study, we introduced a simple and low cost deposition method to fabricate thin films from nanoparticle suspensions. We demonstrated the use of aerosol-assisted chemical transport (AACT) to fabricate Sn-doped In2O3 (ITO) thin films on glass substrates. The surface morphological images confirmed that by choosing an appropriate solvent (methanol) and the loading level (0.20 wt/vol%), a significant improvement in the film nanoparticle coverage can be obtained. The XRD diffractograms illustrated that post-deposition heat-treatment of ITO films helped to improve the phase purity of the films, as well as the inter-particle connections and film adherence. The required microwave processing time was much shorter than the radiant annealing time. The lowest resistivity of 6.0 × 10⁻² Ω cm, a Hall mobility of 2.19 cm2 V−1 s−1 and a higher carrier concentration of −8.046 × 1018 cm3 for the microwave heat-treated ITO films were assisted by the presence of an ethyl cellulose binder in the initial aerosol. Furthermore, the transmission plot showed over 85% transmission in the visible region for the microwave heat-treated ITO films.Acknowledgements
This research was funded by the UK Engineering and Physical Sciences Research Council (EPSRC) under grant number EP/L017709/1. The authors also gratefully acknowledge the support of the industrial collaborators, especially Malvern Instruments Ltd, Sun Chemical Ltd and NSG, Pilkington. The assistance received from all members of the Energy Research Laboratory in the Department of Chemistry, Loughborough University is also acknowledged. The authors acknowledge use of facilities with the Loughborough Materials Characterisation centre (LMCC) and CREST Loughborough University. We would like to thank Dr Keith Yendall, Dr Jagdeep Sagu and Dr Patrick Isherwood for their assistance given in getting titled SEM images and Hall Effect measurements.References
- C. Yuan, H. Bin Wu, Y. Xie and X. W. D. Lou, Angew. Chem., Int. Ed., 2014, 53, 1488–1504 CrossRef CAS PubMed.
- K. Ellmer, Nat. Photonics, 2012, 6, 809–817 CrossRef CAS.
- A. Llordés, G. Garcia, J. Gazquez and D. J. Milliron, Nature, 2013, 500, 323–326 CrossRef PubMed.
- K. Ellmer and G. Vollweiler, Thin Solid Films, 2006, 496, 104–111 CrossRef CAS.
- P. G. Hoertz, Z. Chen, C. A. Kent and T. J. Meyer, Inorg. Chem., 2010, 49, 8179–8181 CrossRef CAS PubMed.
- M.-M. Bagheri-Mohagheghi and M. Shokooh-Saremi, Semicond. Sci. Technol., 2003, 18, 97–103 CrossRef CAS.
- H. R. Fallah, M. Ghasemi, A. Hassanzadeh and H. Steki, Mater. Res. Bull., 2007, 42, 487–496 CrossRef CAS.
- U. Diebold, Surf. Sci. Rep., 2003, 48, 53–229 CrossRef CAS.
- H. Agura, A. Suzuki, T. Matsushita, T. Aoki and M. Okuda, Thin Solid Films, 2003, 445, 263–267 CrossRef CAS.
- D. S. Bhachu, G. Sankar and I. P. Parkin, Chem. Mater., 2012, 24, 4704–4710 CrossRef CAS.
- C. E. Knapp, G. Hyett, I. P. Parkin and C. J. Carmalt, Chem. Mater., 2011, 23, 1719–1726 CrossRef CAS.
- A. A. Tahir, T. A. N. Peiris and K. G. U. Wijayantha, Chem. Vap. Deposition, 2012, 18, 107–111 CrossRef CAS.
- M. A. Ehsan, T. A. N. Peiris, K. G. U. Wijayantha, M. M. Olmstead, Z. Arifin, M. Mazhar, K. M. Lo and V. Mckee, Dalton Trans., 2013, 42, 10919–10928 RSC.
- T. Minami, Thin Solid Films, 2008, 516, 5822–5828 CrossRef CAS.
- T. Minami, J. Vac. Sci. Technol., A, 1995, 13, 1095 CAS.
- P. J. M. Isherwood and J. M. Walls, Energy Procedia, 2014, 60, 129–134 CrossRef CAS.
- T. A. Nirmal Peiris, PhD thesis, Loughborough University, 2014.
- A. A. Tahir, K. G. U. Wijayantha, S. Saremi-Yarahmadi, M. Mazhar and V. McKee, Chem. Mater., 2009, 21, 3763–3772 CrossRef CAS.
- M. Alam and D. Cameron, Thin Solid Films, 2000, 377–378, 455–459 CrossRef CAS.
- H. Y. Valencia, L. C. Moreno and A. M. Ardila, Microelectron. J., 2008, 39, 1356–1357 CrossRef CAS.
- L. Predoana, S. Preda, M. Nicolescu, M. Anastasescu, J. M. Calderon-Moreno, M. Duta, M. Gartner and M. Zaharescu, J. Sol-Gel Sci. Technol., 2014, 71, 303–312 CrossRef CAS.
- P. Brack, J. S. Sagu, T. A. N. Peiris, A. Mcinnes, M. Senili, K. G. U. Wijayantha, F. Marken and E. Selli, Chem. Vap. Deposition, 2014, 20, 1–5 CrossRef.
- M. Mat-Teridi, PhD thesis, Loughborough University, 2012.
- T. A. N Peiris, J. S. Sagu, Y. Hazim Yusof and K. U. Wijayantha, Thin Solid Films, 2015, 590, 293–298 CrossRef.
- I. A. Bhatti, T. A. N. Peiris, T. D. Smith and K. G. U. Wijayantha, Mater. Lett., 2013, 93, 333–336 CrossRef CAS.
- E. T. Thostenson and T.-W. Chou, Composites, Part A, 1999, 30, 1055–1071 CrossRef.
- P. Marchand, N. M. Makwana, C. J. Tighe, R. I. Gruar, I. P. Parkin, C. J. Carmalt and J. A. Darr, ACS Comb. Sci., 2016, 18, 130–137 CrossRef CAS PubMed.
- R. I. Gruar, C. J. Tighe and J. A. Darr, Ind. Eng. Chem. Res., 2013, 52, 5270–5281 CrossRef CAS.
- S. D. Das, IOSR J. Electr. Electron. Eng., 2013, 6, 28–38 CrossRef.
- K. L. Mittal, Electrocomponent Sci. Technol., 1976, 3, 21–42 CrossRef CAS.
- X. S. Shen, G. Z. Wang, X. Hong and W. Zhu, Phys. Chem. Chem. Phys., 2009, 11, 7450–7454 RSC.
- B. Faure, G. Salazar-Alvarez, A. Ahniyaz, I. Villaluenga, G. Berriozabal, Y. R. De Miguel and L. Bergström, Sci. Technol. Adv. Mater., 2016, 023001 Search PubMed.
- S. Saremi-Yarahmadi, B. Vaidhyanathan and K. G. U. Wijayantha, Int. J. Hydrogen Energy, 2010, 35, 10155–10165 CrossRef CAS.
- B. Tang, F. Si, Y. Li, L. Liu and S. Zhang, J. Mater. Sci.: Mater. Electron., 2015, 26, 2719–2725 CrossRef CAS.
- J. Binner, B. Vaidhyanathan, A. Paul, K. Annaporani and B. Raghupathy, Int. J. Appl. Ceram. Technol., 2011, 8, 766–782 CrossRef CAS.
- G. Torgovnikov, Dielectric Properties of Wood and Wood-Based Materials, Springer Science & Business Media, 2012 Search PubMed.
- T. P. McLean and E. G. S. Paige, J. Phys. Chem. Solids, 1960, 16, 220–236 CrossRef CAS.
- A. Malik, A. Seco, E. Fortunato and R. Martins, Sens. Actuators, A, 1998, 68, 333–337 CrossRef CAS.
- N.-R. Kim, J.-H. Lee, Y.-Y. Lee, D.-H. Nam, H.-W. Yeon, S.-Y. Lee, T.-Y. Yang, Y.-J. Lee, A. Chu, K. T. Nam and Y.-C. Joo, J. Mater. Chem. C, 2013, 1, 5953 RSC.
| This journal is © The Royal Society of Chemistry 2016 |